Genetic contributions to white matter architecture revealed by diffusion tensor imaging in Williams syndrome Stefano Marenco*†, Michael A. Siuta*, J. Shane Kippenhan*‡, Samuel Grodofsky*, Wei-li Chang*‡, Philip Kohn*‡, Carolyn B. Mervis§, Colleen A. Morris¶, Daniel R. Weinberger*, Andreas Meyer-Lindenberg储, Carlo Pierpaoli**, and Karen Faith Berman*‡ *Clinical Brain Disorders Branch (CBDB), Genes Cognition and Psychosis Program (GCAP), Intramural Research Program (IRP), National Institute of Mental Health (NIMH), National Institutes of Health (NIH), Department of Health and Human Services, Bethesda, MD 20892; ‡Section on Integrative Neuroimaging, CBDB, IRP, NIMH, NIH, Bethesda, MD 20892; §Neurodevelopmental Sciences Laboratory, Department of Psychological and Brain Sciences, University of Louisville, Louisville, KY 40292; ¶Department of Pediatrics, University of Nevada School of Medicine, Las Vegas, NV 89102; 储Unit for Systems Neuroscience in Psychiatry, CBDB, GCAP, IRP, NIMH, NIH, Bethesda, MD 20892; and **Section on Tissue Biophysics and Biometrics, IRP, National Institute of Child Health and Human Development, NIH, Bethesda, MD 20892
Little is known about genetic regulation of the development of white matter. This knowledge is critical in understanding the pathophysiology of neurodevelopmental syndromes associated with altered cognition as well as in elucidating the genetics of normal human cognition. The hemideletion of ⬇25 genes on chromosome 7q11.23 that causes Williams syndrome (WS) includes genes that regulate cytoskeletal dynamics in neurons, especially LIMK1 and CYLN2, and therefore offers the opportunity to investigate the role of these genes in the formation of white matter tracts. We used diffusion tensor imaging to demonstrate alteration in white matter fiber directionality, deviation in posterior fiber tract course, and reduced lateralization of fiber coherence in WS. These abnormalities are consistent with an alteration of the late stages of neuronal migration, define alterations of white matter structures underlying dissociable behavioral phenotypes in WS, and provide human in vivo information about genetic control of white matter tract formation. development 兩 LIMK1 兩 neuronal growth cone 兩 neuronal migration 兩 tractography
C
haracteristics of white matter in humans are heritable (1), are important determinants of interindividual differences in cognition (2), can have profound consequences on brain function by affecting coordination of large ensembles of neurons (3), and can contribute to neuropsychiatric disorders (4), but there is little information about the underlying mechanisms of their genetic control. Williams syndrome (WS), a rare neurodevelopmental condition arising from a hemideletion on chromosome 7q11.23, including genes that are crucial for neuronal migration and maturation, provides a privileged setting for such an investigation. Because the haploinsufficiency of the affected genes confers both a distinctive cognitive pattern whose hallmark is impaired visuospatial construction and a remarkable, characteristic hypersocial personality, WS further offers the potential to study genetically determined white matter features in the context of clear clinical phenomena. We previously used multimodal neuroimaging to define three fundamental aspects of the brain phenotype in WS that are related to clinical features. (i) Underlying the cognitive hallmark of this syndrome, visuospatial construction impairment, is a neurostructural anomaly (decreased gray matter volume) and adjacent hypofunction in the intraparietal sulcus (IPS) region of the dorsal visual processing stream (5, 6). (ii) Hippocampal abnormalities in regional cerebral blood flow, neurofunctional activation, and N-acetylaspartate concentration (measured in vivo with MR spectroscopy) as well as subtle structural changes (7) also contribute to these visuospatial construction problems. www.pnas.org兾cgi兾doi兾10.1073兾pnas.0704311104
(iii) Underlying the hallmark social cognition features of the syndrome are structural and functional abnormalities in the orbitofrontal cortex (OFC), an important social and affect regulatory region that participates in a frontoamygdalar network found to be dysfunctional in WS (8; for review, see ref. 9). Because these features were defined in extremely rare persons with WS and normal intelligence quotients (IQs), allowing us to compare WS individuals to IQ-matched healthy controls and thus obviating an important potential confound, these brain phenotypes are likely proximal to the genetic core of the syndrome. Several of these abnormalities have also been reported in individuals with WS who had mental retardation (10–13). Using the previous multimodal neuroimaging findings to guide the present work, in a subset of the same participants with WS and controls carefully matched for age, sex, and IQ, we employed diffusion tensor imaging (DTI; refs. 14 and 15) to assess white matter integrity. DTI is a powerful MRI technique that allows identification of white matter tracts invisible to conventional imaging and that provides a quantitative measure of microscopic characteristics related to the directional organization of brain tissue. In hypothesis-driven analyses, we focused on brain regions where prior results in these same participants with WS had indicated the presence of the gray matter abnormalities described above. Exploratory analyses focusing on major white matter tracts and architecture in other brain regions were also carried out. Because some of the affected genes, particularly LIMK1, CYLN2, and possibly FZD9 (for review, see ref. 9), regulate cytoskeletal dynamics in neurons, it is likely that white matter tracts, which are established early during brain development and require intact growth cone regulation for normal development, are aberrant in WS. We, therefore, expected to find altered white matter immediately underlying and Author contributions: S.M., C.B.M., D.R.W., A.M.-L., C.P., and K.F.B. designed research; S.M., J.S.K., C.B.M., C.A.M., A.M.-L., and K.F.B. performed research; S.M., M.A.S., J.S.K., S.G., W.-l.C., and P.K. analyzed data; and S.M. wrote the paper. The authors declare no conflict of interest. This article is a PNAS Direct Submission. Abbreviations: DTI, diffusion tensor imaging; IFO, inferior frontooccipital faciculus; ILF, inferior longitudinal fasciculus; IPS, intraparietal sulcus; IQ, intellectual quotient; LI, lattice index; OFC, orbitofrontal cortex; ROI, region of interest; SLF, superior longitudinal fasciculus; VCING, ventral portion of the cingulum bundle; WS, Williams syndrome. †To
whom correspondence should be addressed at: National Institute of Mental Health, Clinical Brain Disorders Branch, Building 10, Room 45235, Bethesda, MD 20892. E-mail:
[email protected].
This article contains supporting information online at www.pnas.org/cgi/content/full/ 0704311104/DC1. © 2007 by The National Academy of Sciences of the USA
PNAS 兩 September 18, 2007 兩 vol. 104 兩 no. 38 兩 15117–15122
NEUROSCIENCE
Edited by Marcus E. Raichle, Washington University School of Medicine, St. Louis, MO, and approved July 18, 2007 (received for review May 8, 2007)
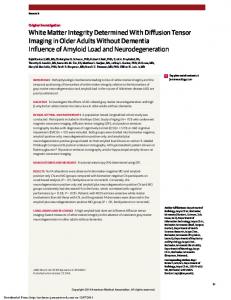
Fig. 1. Hypothesis-driven ROIs and results for orientation, LI, and skewness. (A) Location of ROIs based on prior hypotheses. CS, area of white matter surrounding the collateral sulcus. The original spheres were eroded to exclude gray matter and therefore minimize partial volume effects. (B) Significant white matter orientation ⫻ diagnosis effect (NC, controls; Z, inferior–superior orientation of white matter fibers, X, right-to-left orientation; Y, anterior– posterior orientation). (C) Significant side ⫻ diagnosis effect for LI (L, left hemisphere; R, right hemisphere). (D) Significant side ⫻ diagnosis effect for skewness.
structurally connected to the previously observed areas of cortical abnormality. Results Local Changes of White Matter Structure Underlying Areas with Altered Gray Matter Structure/Function. Hypothesis-driven analyses
of the regions of interest (ROIs) shown in Fig. 1A revealed three major between-group findings: (i) differential orientation of white matter fibers as assessed by the principal direction of diffusion, 1 [Fig. 1B, significant effect of orientation ⫻ diag-
nosis on repeated-measures ANOVA: F(2,16) ⫽ 12.2, P ⫽ 0.001]; (ii) significantly different lateralization of fiber coherence, measured by the lattice index, LI [Fig. 1C, significant effect of hemisphere ⫻ diagnosis: F(1,8) ⫽ 11.7, P ⫽ 0.01]; and (iii) significant differences in lateralization of the presence of crossing fibers, indexed by the skewness of the diffusion tensor [Fig. 1D, significant effect of hemisphere ⫻ diagnosis: F(1,8) ⫽ 16.6, P ⫽ 0.004]. Specifically, 1 orientation in participants with WS differed from controls because of a reduction of the component of the principal eigenvector oriented preferentially along the axis from right to left (red in our color scheme) and a concomitant increase in the component oriented along the anterior–posterior axis (green), indicating altered fiber organization in the depths of the affected sulci. Moreover, whereas controls had larger values of LI and skewness in the left than in the right hemisphere, individuals with WS did not display this normal asymmetry (Fig. 1 C and D). Finally, a significant effect of diagnosis was observed for the Trace of the diffusion tensor, a measure of overall water diffusivity dependent on the microscopic composition of brain tissue [see supporting information (SI) Discussion]. The overall mean across regions for Trace was 2,337 ⫻ 10⫺6 mm2/s ⫾ 60 (SD) in controls and 2,270 ⫾ 78 in WS [repeated-measures ANOVA: F(1,8) ⫽ 13.6, P ⫽ 0.006]. More details on these parameters are given in Methods and SI Methods. Alterations in White Matter Tracts Relevant to Areas with Altered Gray Matter Structure/Function. Tractography was performed by
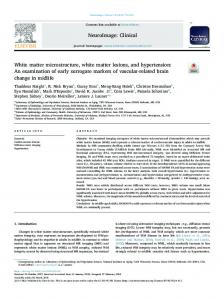
using the hypothesis-driven ROIs (Fig. 1 A) as seeds for the tracts of interest (for further details, see SI Methods). We found marked qualitative abnormalities in the course of fiber tracts connecting to the IPS ROI [mainly the inferior longitudinal fasciculus (ILF)/inferior fronto-occipital fasciculus (IFO) and the superior longitudinal fasciculus (SLF); Fig. 2 Left] and to the hippocampal ROI through the ventral portion of the cingulum bundle (VCING; Fig. 2 Right) in WS compared with controls. Although all participants (controls and WS) had tracts connecting from the IPS sphere to the temporal lobe via the ILF/IFO
Fig. 2. Differences between controls and WS in tracts connecting to the IPS and the VCING. (Left) Fiber tracking was performed with DTI studio seeding tracts from all voxels in the brain and then displaying only fibers that traversed the IPS ROI (illustrated as a blue circle) and a coronal plane at the center of the thalamus. The yellow arrows indicate fiber tracts coursing rostrally to the corpus callosum, which were never present in controls [normal control (NC), first and third columns] but present in four of five individuals with WS (second and fourth columns), especially in the right hemisphere (Mann–Whitney U ⫽ 2.5 P ⬍ 0.05). The blue arrow indicates fibers connecting the IPS to the thalamus, observed in the left hemisphere of one individual with WS. (Right) The VCING is represented in red. The yellow arrows highlight the prominent occipital projections in WS individuals, present significantly more frequently than in controls in the right hemisphere (Mann–Whitney U ⫽ 5, P ⫽ 0.07). 15118 兩 www.pnas.org兾cgi兾doi兾10.1073兾pnas.0704311104
Marenco et al.
(pink pathways in Fig. 2 Left), tractography indicated architectural differences in white matter with additional, aberrant tracts visualized in all participants with WS: four individuals with WS had tracts that coursed rostrally to the corpus callosum in the right hemisphere, either in the SLF or in the dorsal portion of the cingulum bundle (Fig. 2 Left, yellow arrows); two had similar anomalies in the left hemisphere, and the remaining individual with WS showed fibers connecting to the thalamus and then to the frontal lobe (Fig. 2, blue arrow). This between-group difference was statistically significant (Mann–Whitney U ⫽ 2.5, P ⫽ 0.037). These findings remained robust to changes in thresholds for fiber bending and anisotropy, with identical results for the right hemisphere and a single fiber appearing in the SLF of the left hemisphere of one control when bending was increased to 45 degrees or more. The anomalous tracts emerged in the depth of the white matter underlying the IPS. A representation of the relative frequency of tract location in normalized space for both WS and controls is provided in Fig. 3 A–D. For tracts connecting to the VCING (Fig. 2 Right), three individuals with WS had bilateral and one had unilateral occipital projections, whereas three normal controls had small unilateral projections to the occipital lobe (two in the left hemisphere and one on the right, indicated by yellow arrows), yielding a trend toward statistical significance (Mann–Whitney U ⫽ 5.5, P ⫽ 0.12 when both hemispheres were considered and Mann–Whitney U ⫽ 5, P ⫽ 0.07 when the presence of projections to the occipital lobe in the right hemisphere only was considered). Fiber tracts diverged at the junction between the medial temporal and occipital lobes (Fig. 3 E–H). Fiber tracking from the collateral sulcus and the white matter underlying the OFC showed no marked differences in WS compared with controls. Quantitative analysis of ROIs placed where fiber tracts diverged in WS and controls (green in Fig. 3) indicated significant alterations of 1 orientation in WS for tracts from the IPS and the VCING. In the ROI placed along the tracts from the IPS, the repeated-measures ANOVA for tract orientation revealed a significant orientation ⫻ diagnosis interaction [green ROI in Marenco et al.
Fig. 4. Tract ⫻ diagnosis effect for LI and skewness. The effect of tract ⫻ diagnosis was statistically significant for both LI and skewness [F(8,64) ⫽ 4.9, P ⫽ 0.0001 and F(8,64) ⫽ 4.8, P ⫽ 0.0001, respectively]. The means across right and left hemisphere for the major white matter tracts [and between the anterior and posterior regions of the corpus callosum (CC)] are represented. *, P ⬍ 0.05; **, P ⬍ 0.01 on a Mann–Whitney U test comparing WS and controls (this statistic was used as a post hoc test to identify which tracts showed more marked differences between controls and WS). ATR, anterior thalamic radiation; CST, cerebrospinal tract; DCING, dorsal portion of the cingulum bundle; UNC, uncinate fasciculus. Fornix major and minor are combined.
Fig. 3 A–D: F(2,16) ⫽ 3.9, P ⫽ 0.04; see SI Table 1, first row]. The ROI selected on the tracts from the VCING (green in Fig. 3 E–H) also revealed a significant orientation ⫻ diagnosis interaction [F(2,16) ⫽ 5.24, P ⫽ 0.018 on repeated-measures ANOVA; see SI Table 2, first row]. In both ROIs, WS had higher anterior–posterior but lower right–left orientation of the principal eigenvector than controls. Moreover, for the ROI associated with the VCING (Fig. 3 E–H), a significant effect of diagnosis for both LI and skewness emerged, with WS having significantly higher values on both measures [SI Table 2, bottom rows; F(1,8) ⫽ 9.2, P ⫽ 0.016 and F(1,8) ⫽ 9.93, P ⫽ 0.013, respectively]. In both ROIs, Trace was statistically significantly lower in WS compared with controls [SI Table 1, bottom row, F(1,8) ⫽ 11.83, P ⫽ 0.009 and SI Table 2, second row, F(1,8) ⫽ 6.06, P ⫽ 0.04]. Alterations in Major White Matter Tracts. The major tracts were
delineated as shown in SI Fig. 5. Results of quantitative analysis of tract-specific characteristics revealed a significant effect of tract ⫻ diagnosis for both LI and skewness [F(8,64) ⫽ 4.9, P ⫽ 0.0001 and F(8,64) ⫽ 4.8, P ⫽ 0.0001, respectively]. This result is illustrated in Fig. 4: the corticospinal tract had higher LI and skewness in controls compared with WS, whereas the opposite was true for the ILF, the inferior fronto-occipital fasciculus, and most other tracts. Moreover, Trace was lower in WS compared with controls, regardless of the tract measured [the overall mean across tracts for Trace was 2,299 ⫾ 97 ⫻ 10⫺6 mm2/s for controls and 2,217 ⫾ 113 in WS, repeated-measures ANOVA: F(1,8) ⫽ 29.8, P ⫽ 0.0006]. Qualitative Observations of Abnormalities in the WS Cohort. We
observed anomalies of the midline, consisting of dysgenesis of PNAS 兩 September 18, 2007 兩 vol. 104 兩 no. 38 兩 15119
NEUROSCIENCE
Fig. 3. Tracts connecting to the IPS and VCING: overlap and divergence in location between WS and controls. Tracts for WS and controls were normalized to a common study-specific template comprising all participants’ scans: in blue are locations in normalized space where tracts were present in more individuals with WS than controls (light blue corresponds to tracts present in five WS and no controls at that location in normalized space), whereas red corresponds to locations where tracts were present mostly in controls (bright yellow corresponds to five controls and no WS at that location; the gray color in the middle indicates the same number of controls and WS). (A–D) Tracts connecting to the IPS. (E–H) Tracts traversing the VCING. Coronal (A and E), sagittal (B and F) and axial (C and G) sections taken at the location of the cross-bars. (D) Coronal section demonstrating the course of fibers through the SLF in WS. (H) Coronal section illustrating projections to the parietal lobe in controls and to the occipital lobe in WS. The green ROIs were placed at the point in normalized space where tract location for WS diverged from that in controls. These locales were then registered back to the individual DTI space for quantitative analysis.
the corpus callosum in one participant with WS (SI Fig. 6) and incomplete or absent anterior commissure in three of five participants with WS (SI Fig. 7). Furthermore, a supranumerary cingulum bundle on the midline was present in one participant with WS (SI Fig. 8 and yellow arrow in SI Fig. 7), and excess longitudinal fibers above the corpus callosum were seen in another (green fibers dorsal to the corpus callosum in SI Fig. 6 Upper Left and white arrow in SI Fig. 7). Discussion We found significant differences in white matter tissue organization in individuals with WS, especially alterations in the main orientation (principal eigenvector) of fibers in regions underlying gray matter structural and functional abnormality. A significant effect of orientation ⫻ diagnosis was observed across the eight ROIs selected on the basis of our a priori hypotheses (Fig. 1B) and in the two ROIs identified by fiber tracking from these areas (SI Tables 1 and 2). In all of these regions, the principal eigenvector was directed more along the anterior–posterior axis and less along the right-to-left axis of the brain in WS compared with controls. Two interpretations of this finding are possible: (i) that some normally present fibers did not develop and that the longitudinal fibers that are usually obscured by the presence of crossing fibers were enhanced in WS (16); (ii) that fibers normally destined to grow laterally deviated in the longitudinal direction, similar to the formation of Probst bundles in callosal agenesis (17) and to the formation of aberrant sigmoid tracts in callosal dysgenesis (18). Other findings in WS support the latter contention: altered shape and reduced size of the corpus callosum have been demonstrated in individuals with WS (19–21); and in the present sample, we observed other midline anomalies consisting of dysgenesis of the corpus callosum in one participant (SI Fig. 6) and incomplete or absent anterior commissure in three of five WS participants (SI Fig. 7). Further evidence of an increase of longitudinal fibers in WS is provided by the presence of a supranumerary cingulum bundle on the midline in one individual (SI Fig. 8) and excess longitudinal fibers above the corpus callosum in another (SI Fig. 6 and white arrow in SI Fig. 7) as well as by the tractography findings described below. Fig. 2 demonstrates the presence of excess fiber bundles connecting to the IPS and to the hippocampus and oriented longitudinally in WS. Both of these findings are compatible with the reduction of transverse and increase of longitudinal fibers described above. Although the appearance of these tracts is strikingly different in the two groups examined here, connections between the parietal and the frontal lobes via the SLF (22; see also SI Discussion) and between the hippocampus and the occipital lobe via the cingulum bundle (23) are well established in human and non-human primates and have been demonstrated with tractography. The location of regions of tract divergence (green in Fig. 3) is of interest because it may correspond to the location of the stratified transitional fields (24). These are laminar formations of neuronal bodies and intercalated fibers visible in between the subventricular zone and the subplate during the course of development, that can still be clearly recognized at full term in postmortem specimens (24). Some of the long-range connections and specific functional characteristics of neurons may be determined while they sojourn in these transitional fields on their way to the cortical plate. It is likely that one or more of the haploinsufficient genes in WS has an important role during this functional specification period. In contrast, we did not find obviously aberrant tracts from the OFC sphere or the collateral sulcus ROI (see SI Discussion). In the hypothesis-derived ROIs, significant hemisphere ⫻ diagnosis effects emerged for the degree of coherence in fiber orientation (diffusion anisotropy as indexed by LI), indicating that the normal asymmetry (left ⬎ right) in fiber coherence (25–27) had been lost in WS (Fig. 1C). The increased fiber 15120 兩 www.pnas.org兾cgi兾doi兾10.1073兾pnas.0704311104
coherence in the right hemisphere could be the result of reduced crossing fibers (16), increased density of axons, or increased myelination (28). The concomitant presence in the same hemisphere of an increase in skewness (Fig. 1D), a measure particularly sensitive to crossing fibers, makes the first possibility more likely. This lateralized effect was seen only for the ROIs analyzed with a priori hypotheses and not for the main white matter tracts examined. This finding suggests the presence of abnormal lateralization of white matter development in WS, with preferential right hemisphere involvement. This observation may be compatible with the deficits in visuospatial construction and social cognition in WS, functions that are normally associated with the right hemisphere (29, 30). The lack of physiological asymmetry found here is also reminiscent of bilaterally symmetric abnormalities in sulcal depth reported by Van Essen et al. (12) and of loss of asymmetry of the planum temporale reported by Eckert et al. (31). Changes in asymmetry of cortical gyrification were also recently reported in WS (32). In addition to these changes in hypothesis-driven regions, exploration of additional white matter tracts revealed increases in fiber coherence (anisotropy) in WS in the ILF and IFO (the two main tracts occupying the lateral portion of the temporal lobe) and decreases in the corticospinal tract (Fig. 4). Skewness, our index of the presence of crossing fibers, paralleled these changes. It is possible that these changes in the lateral temporal lobe may be related to verbal abilities in WS, which are usually less severely affected than visual construction (33). Histopathological evidence from Holinger et al. (34) supports the presence of abnormal cell packing density and cell size in the cortex of the superior temporal gyrus. Similarly, reduced anisotropy and skewness in the corticospinal tract may accompany neurological problems observed in WS, such as coordination difficulties, hyperreflexia, and positive Babinski sign (35, 36), as well as reported alterations in morphology of the central sulcus (37, 38; see also SI Discussion). Finally, the most widespread alteration was a ⬇5% reduction in Trace in WS, likely indicating differences in tissue composition and/or structure. This reduction was present in all ROIs explored in this work and may therefore constitute a generalized alteration in tissue diffusivity. In a post hoc analysis, the average value of Trace across all eight hypothesis-driven ROIs was significantly correlated with IQ in the whole group of participants (Spearman rho for WS and controls combined ⫽ 0.74, P ⫽ 0.01). This finding supports the physiological relevance of changes in Trace and highlights the importance of selecting diagnostic groups matched by IQ. Multiple factors may be at hand in causing this change in diffusivity of water (see SI Discussion and SI Table 3). We propose a unified interpretation of these findings that has implications for understanding the genetic control of white matter development. It is likely that one or more of the proteins coded for by genes in the WS hemideleted region function to guide development of U fibers and/or of longitudinal long-range connections (such as the SLF). Because of the haploinsufficiency of these genes, fibers that would ordinarily develop into U fibers or cross the midline in the dorsal portions of the corpus callosum are unable to reach their natural target and therefore deviate longitudinally, giving origin to altered fiber tracts and orientation of white matter. This phenomenon may be the result of altered specification of connectivity in the transitional fields where neurons sojourn during their migration toward the cortex. This hypothesis would also predict that the haploinsufficiency in WS plays a major role during the later stages of neuronal migration (third trimester). This proposal is also consistent with the fact that the corpus callosum, which forms between 8 and 20 weeks of gestation (17), was present in all WS individuals, whereas U fibers whose maturation extends into the postnatal period (39) appeared to be particularly affected. The findings of Marenco et al.
Methods Participants. Four of the five individuals with WS studied were
male; their ages ranged from 19 to 37 years (mean ⫾ SD, 27 ⫾ 8), and their IQs (measured as described in ref. 5) ranged between 77 and 92 (87 ⫾ 6). Participants with WS were recruited from the same cohort of high-functioning individuals with WS previously studied by our group. They were genetically tested with fluorescence in situ hybridization to verify the typical hemideletions in the WS critical area (44) of chromosome 7q11.23. Controls free of neuropsychiatric or medical disorders that could affect brain structure and function were matched individually by age (mean ⫾ SD for controls: 26 ⫾ 5, t comparing WS and controls ⫽ 0.19, P ⫽ 0.85) and gender, and they did not differ significantly from the WS group in IQ (controls: 92 ⫾ 4, t ⫽ ⫺1.62, P ⫽ 0.14). All participants signed informed consent as specified by the National Institute of Mental Health Institutional Review Board and were compensated for their time.
Image Acquisition and Processing. Diffusion-weighted images were acquired with a single-shot echo-planar imaging sequence (six different gradient directions with b-value ⬇1,100 s/mm2 plus one acquisition with b-value ⬇0 s/mm2, 2-mm isotropic resolution, TE 82.7 ms, TR ⬎10 s, cardiac-gated, gradient strength of 5 G/cm) on a GE Signa 1.5T scanner (Milwaukee, WI). Between two and eight independent replicates were acquired based on the ability of individuals with WS to tolerate being in the scanner. The number of replicates was matched in the corresponding controls. Corrections for gross motion and eddy currents were implemented as described by Rohde et al. (45). Our software also allowed for registration of the images to an individual-specific template with a rigid body rotation. The b ⫽ 0 image for each participant was thus registered with a mutual information cost Marenco et al.
function to a T1 image of the same participant that had been aligned so that a line connecting the locale of the anterior and the posterior commissures was horizontal, and the interhemispheric fissure was vertical. This process allowed comparison of the average orientation of the principal eigenvector across groups. The tensor was calculated at each single voxel as described by Basser and Pierpaoli (14), and the signal amplitude, eigenvectors, eigenvalues, LI (46), skewness and Trace (D) were derived. The principal eigenvector was used for fiber-tracking according to Mori et al. (47) and to create color images where x, y, and z components of the principal eigenvector were represented in red (right–left or transverse orientation), green (anterior–posterior or longitudinal orientation), and blue (up–down or vertical orientation), respectively (48). The brightness of the color maps was modulated by the value of LI. The fiber orientation represented with these colors was used in quantitative assessments of average fiber orientation within the ROIs defined below. The LI was used as a measure of the microscopic directional organization of tissue and Trace as a measure of total diffusivity of water. Another parameter that was derived from the tensor was the skewness (49), which measures the degree of prolateness (cigar-like shape; positive values of skewness) vs. oblateness (pizza-like shape; negative values of skewness) of the diffusion tensor (for a more detailed explanation of these quantities, see SI Methods). Data Analysis. Our strategy for data analysis (further detailed in SI Methods) consisted of the following steps: Step 1. Differences in DTI indexes were quantified in white matter ROIs where prior results from our group indicated decreased sulcal depth, reduced gray matter volume, or reduced cerebral blood flow in WS (IPS, collateral sulcus, hippocampus, and medial OFC/subgenual cingulum; Fig. 1 A). Step 2. Fiber tracking from the ROIs identified in step 1 and identification of areas where tracts for normal controls diverged markedly from those of WS were performed. These tasks were accomplished by normalizing the fiber trajectories to a common space. We also explored qualitative differences in tract tracing by identifying the major tracts in the brain, namely the SLF, the VCING and dorsal cingula, the ILF, the IFO, the uncinate fasciculus, the anterior thalamic radiations, the corticospinal tract, and the occipital and frontal projections of the corpus callosum (fornix major and minor, respectively). Step 3. We placed a second set of ROIs (in green in Fig. 3) at the point where tracts in controls and WS diverged in normalized space. Positions for these regions of interest in the scans of individual participants were identified by inverting the transformations used for normalizing the structural images of each individual to the common space in order to quantify differences in DTI indices at brain locations that had been highlighted as possible areas of abnormality in step 2. Statistical Analysis. Mean trace, skewness, and orientation were
compared between groups by using repeated-measures ANOVA with hemisphere, ROI, and the intensity of the three basic orientation colors (red, green, and blue) as repeated measures. Because the intensity of the colors was modulated by the LI, effects of anisotropy were tested when running this ANOVA. Diagnosis was always the independent variable. Only significant effects of diagnosis or interactions of diagnosis with other variables (hemisphere and ROI) are reported because they are the only effects of interest for this work. F values and significances were obtained after ranking the values to remove outliers and avoid assuming normal distribution of the data. However, means ⫾ SD are reported from the original data. Although P PNAS 兩 September 18, 2007 兩 vol. 104 兩 no. 38 兩 15121
NEUROSCIENCE
altered laterality of anisotropy and skewness in WS may indicate an abnormality either in the differential timing of hemispheric development of the white matter fibers or of differential quantity of fibers formed in the two hemispheres. The mechanism proposed here is consistent with the tension morphogenesis hypothesis advanced by Van Essen (40). Our work provides important information to guide future investigations of postmortem brain tissue in WS, knockout mouse models of WSrelated genes, and individuals with small deletions in the WS critical region (7q11.23). The fact that we were able to demonstrate robust findings in this small and rare genetic cohort indicates an important role for the affected genes in the development of white matter architecture. LIMK1 and CYLN2 (9) are known to regulate different aspects of cytoskeletal dynamics that may be essential for growth cone regulation and therefore have a role in axon guidance and neuronal migration. It is also possible that other hemideleted genes such as FZD9 may contribute to the white matter phenotype described here, although this gene is unlikely to be associated with the visuospatial construction deficit (9). FZD9 belongs to a large family of receptors of WNT signaling, which have been shown to be critical to dendritic development and likely play a role also in axon guidance (41, 42). A recent paper (43) has used DTI to demonstrate tract course alterations in a mouse model of FZD3 deficiency. In conclusion, we have identified several areas of quantitative abnormalities of water diffusion in white matter of individuals with WS and advanced a hypothesis of specific alteration in the development of U fibers in the later stages of neuronal migration. These findings should prompt further studies in larger samples of individuals with WS with and without mental retardation. The white matter changes reported here not only constitute a critical component of the pathophysiology of WS but also shed light on the function of specific genes (hemideleted in WS) during normal human embryonic development.
compared gray and white matter volumes separately (t8 ⫽ 1.42, P ⫽ 0.19 and t8 ⫽ 1.15, P ⫽ 0.31, respectively).
values are reported before correction for multiple comparisons, all significant effects reported for hypothesis-driven comparisons remain significant after Bonferroni correction for three independent tests (Trace, orientation, and skewness: P ⬍ 0.017). Previous studies of individuals with WS and mental retardation have reported a reduction in brain volume (10). In the present cohort, composed of individuals with WS and normal intelligence, we did not find significant differences in total forebrain volume between controls and WS (t8 ⫽ 1.36, P ⫽ 0.21). The same absence of statistical significance applied when we
We thank Robyn Honea and Sonya Steele for helping in recruitment of normal controls and data collection and Antonina Savostyanova and Alexa Stern for help in figure preparation. We also thank Hangyi Jiang (The Johns Hopkins University, Baltimore, MD) for helping us learn and use DTI Studio. This work was funded by the National Institute of Mental Health Intramural Research Program and by National Institute for Neurological Disorders and Stroke/National Institutes of Health Grant NS35102 (to C.B.M.).
1. Hulshoff Pol HE, Schnack HG, Posthuma D, Mandl RC, Baare WF, van Oel C, van Haren NE, Collins DL, Evans AC, Amunts K, et al. (2006) J Neurosci 26:10235–10242. 2. Tuch DS, Salat DH, Wisco JJ, Zaleta AK, Hevelone ND, Rosas HD (2005) Proc Natl Acad Sci USA 102:12212–12217. 3. Thiebaut de Schotten M, Urbanski M, Duffau H, Volle E, Levy R, Dubois B, Bartolomeo P (2005) Science 309:2226–2228. 4. Lim KO, Helpern JA (2002) NMR Biomed 15:587–593. 5. Meyer-Lindenberg A, Kohn P, Mervis CB, Kippenhan JS, Olsen RK, Morris CA, Berman KF (2004) Neuron 43:623–631. 6. Kippenhan JS, Olsen RK, Mervis CB, Morris CA, Kohn P, Meyer-Lindenberg A, Berman KF (2005) J Neurosci 25:7840–7846. 7. Meyer-Lindenberg A, Mervis CB, Sarpal D, Koch P, Steele S, Kohn P, Marenco S, Morris CA, Das S, Kippenhan S, et al. (2005) J Clin Invest 115:1888–1895. 8. Meyer-Lindenberg A, Hariri AR, Munoz KE, Mervis CB, Mattay VS, Morris CA, Berman KF (2005) Nat Neurosci 8:991–993. 9. Meyer-Lindenberg A, Mervis CB, Berman KF (2006) Nat Rev Neurosci 7:380–393. 10. Reiss AL, Eckert MA, Rose FE, Karchemskiy A, Kesler S, Chang M, Reynolds MF, Kwon H, Galaburda A (2004) J Neurosci 24:5009–5015. 11. Eckert MA, Hu D, Eliez S, Bellugi U, Galaburda A, Korenberg J, Mills D, Reiss AL (2005) Neurology 64:152–153. 12. Van Essen DC, Dierker D, Snyder AZ, Raichle ME, Reiss AL, Korenberg J (2006) J Neurosci 26:5470–5483. 13. Boddaert N, Mochel F, Meresse I, Seidenwurm D, Cachia A, Brunelle F, Lyonnet S, Zilbovicius M (2006) NeuroImage 30:721–725. 14. Basser PJ, Pierpaoli C (1996) J Magn Reson 111:209–219. 15. Pierpaoli C, Jezzard P, Basser PJ, Barnett A, Di Chiro G (1996) Radiology 201:637–648. 16. Pierpaoli C, Barnett A, Pajevic S, Chen R, Penix LR, Virta A, Basser P (2001) Neuroimage 13:1174–1185. 17. Barkovich AJ (2000) in Pediatric Neuroimaging, ed Barkovich AJ (Lippincott Williams & Wilkins, Philadelphia), pp 258–261. 18. Tovar-Moll F, Moll J, de Oliveira-Souza R, Bramati I, Andreiuolo PA, Lent R (2007) Cereb Cortex 17:531–541. 19. Schmitt JE, Eliez S, Warsofsky IS, Bellugi U, Reiss AL (2001) Dev Med Child Neurol 43:155–159. 20. Tomaiuolo F, Di Paola M, Caravale B, Vicari S, Petrides M, Caltagirone C (2002) NeuroReport 13:2281–2284. 21. Luders E, Di Paola M, Tomaiuolo F, Thompson PM, Toga AW, Vicari S, Petrides M, Caltagirone C (2007) NeuroReport 18:203–207. 22. Makris N, Kennedy DN, McInerney S, Sorensen AG, Wang R, Caviness VS, Jr, Pandya DN (2005) Cereb Cortex 15:854–869. 23. Catani M, Jones DK, Donato R, Ffytche DH (2003) Brain 126:2093–2107.
24. Altman J, Bayer SA (2002) J Neurocytol 31:613–632. 25. Powell HW, Parker GJ, Alexander DC, Symms MR, Boulby PA, WheelerKingshott CA, Barker GJ, Noppeney U, Koepp MJ, Duncan JS (2006) NeuroImage 32:388–399. 26. Park HJ, Westin CF, Kubicki M, Maier SE, Niznikiewicz M, Baer A, Frumin M, Kikinis R, Jolesz FA, McCarley RW, Shenton ME (2004) NeuroImage 23:213–223. 27. Buchel C, Raedler T, Sommer M, Sach M, Weiller C, Koch MA (2004) Cereb Cortex 14:945–951. 28. Song SK, Sun SW, Ju WK, Lin SJ, Cross AH, Neufeld AH (2003) NeuroImage 20:1714–1722. 29. Piercy M, Smyth VOG (1962) Brain 85:775–790. 30. Davidson RJ, Irwin W (1999) Trends Cognit Sci 3:11–21. 31. Eckert MA, Galaburda AM, Karchemskiy A, Liang A, Thompson P, Dutton RA, Lee AD, Bellugi U, Korenberg JR, Mills D, et al. (2006) NeuroImage 33:39–45. 32. Gaser C, Luders E, Thompson PM, Lee AD, Dutton RA, Geaga JA, Hayashi KM, Bellugi U, Galaburda AM, Korenberg JR, et al. (2006) NeuroImage 33:46–54. 33. Mervis CB, Klein-Tasman BP (2000) Ment Retard Dev Disabil Res Rev 6:148–158. 34. Holinger DP, Bellugi U, Mills DL, Korenberg JR, Reiss AL, Sherman GF, Galaburda AM (2005) Brain Res 1037:35–42. 35. Chapman CA, du Plessis A, Pober BR (1996) J Child Neurol 11:63–65. 36. Cherniske EM, Carpenter TO, Klaiman C, Young E, Bregman J, Insogna K, Schultz RT, Pober BR (2004) Am J Med Genet 131:255–264. 37. Galaburda AM, Schmitt JE, Atlas SW, Eliez S, Bellugi U, Reiss AL (2001) Arch Neurol 58:1865–1869. 38. Jackowski AP, Schultz RT (2005) Cortex 41:282–290. 39. Hermoye L, Saint-Martin C, Cosnard G, Lee SK, Kim J, Nassogne MC, Menten R, Clapuyt P, Donohue PK, Hua K, et al. (2006) NeuroImage 29:493–504. 40. Van Essen DC (1997) Nature 385:313–318. 41. Lyuksyutova AI, Lu CC, Milanesio N, King LA, Guo N, Wang Y, Nathans J, Tessier-Lavigne M, Zou Y (2003) Science 302:1984–1988. 42. Wang Y, Thekdi N, Smallwood PM, Macke JP, Nathans J (2002) J Neurosci 22:8563–8573. 43. Wang Y, Zhang J, Mori S, Nathans J (2006) J Neurosci 26:355–364. 44. Morris CA, Mervis CB (2000) Annu Rev Genomics Hum Genet 1:461–484. 45. Rohde GK, Barnett AS, Basser PJ, Marenco S, Pierpaoli C (2004) Magn Reson Med 51:103–114. 46. Pierpaoli C, Basser PJ (1996) Magn Reson Med 36:893–906. 47. Mori S, Crain BJ, Chacko VP, van Zijl PC (1999) Ann Neurol 45:265–269. 48. Pajevic S, Pierpaoli C (1999) Magn Reson Med 42:526–540. 49. Conturo TE, McKinstry RC, Akbudak E, Robinson BH (1996) Magn Reson Med 35:399–412.
15122 兩 www.pnas.org兾cgi兾doi兾10.1073兾pnas.0704311104
Marenco et al.