See discussions, stats, and author profiles for this publication at: https://www.researchgate.net/publication/227326245
Genetic diversity and phylogenetic relationship as revealed by inter simple sequence repeat (ISSR) polymorphism in the... Article in Theoretical and Applied Genetics · June 2000 DOI: 10.1007/s001220051440
CITATIONS
READS
306
323
5 authors, including: Swati. Ranade
Vidya Shrikant Gupta
Pacific Biosciences of California, Inc.
CSIR - National Chemical Laboratory, Pune
48 PUBLICATIONS 2,842 CITATIONS
301 PUBLICATIONS 5,967 CITATIONS
SEE PROFILE
SEE PROFILE
Ramesh K Aggarwal Centre for Cellular and Molecular Biology (Co… 260 PUBLICATIONS 2,554 CITATIONS SEE PROFILE
Some of the authors of this publication are also working on these related projects:
Molecular basis of sex determination in Indian mugger View project
Using high-throughput ‘omics’ approaches to elucidate plant-pathogen interactions View project
All content following this page was uploaded by Vidya Shrikant Gupta on 13 January 2016.
The user has requested enhancement of the downloaded file.
Theor Appl Genet (2000) 100:1311–1320
© Springer-Verlag 2000
O R I G I N A L A RT I C L E S.P. Joshi · V.S. Gupta · R.K. Aggarwal P.K. Ranjekar · D.S.Brar
Genetic diversity and phylogenetic relationship as revealed by inter simple sequence repeat (ISSR) polymorphism in the genus Oryza
Received: 23 August 1999 / Accepted: 10 November 1999
Abstract Inter simple sequence repeat (ISSR) polymorphism was used to determine genetic diversity and phylogenetic relationships in Oryza. Forty two genotypes including 17 wild species, representing AA, BB, CC, EE, FF, GG, BBCC, CCDD, and HHJJ genomes, two cultivated species, Oryza sativa (AA) and Oryza glaberrima (AA), and three related genera, Porteresia coarctata, Leersia and Rhynchoryza subulata, were used in ISSR analysis. A total of 30 ISSR primers were screened representing di-, tri-, tetra- and penta-nucleotide repeats, of which 11 polymorphic and informative patterns were selected to determine the genetic diversity. The consensus tree constructed using binary data from banding patterns generated by ISSR-PCR clustered 42 genotypes according to their respective genomes. ISSR analysis suggests that the genus Oryza may have evolved following a polyphyletic pathway; Oryza brachyantha (FF genome) is the most divergent species in Oryza and Oryza australiensis (EE genome) does not fall under the Officinalis complex. DNA profiles based on ISSR markers have revealed potential diagnostic fingerprints for various species and genomes, and also for individual accessions/cultivars. Additionally ISSR revealed 87 putative genome/species-specific molecular markers for eight of the nine genomes of Oryza. The ISSR markers are thus useful in the fingerprinting of cultivated and wild species germplasm, and in understanding the evolutionary relationships of Oryza. Communicated by P.M.A. Tigerstedt S.P. Joshi · V.S. Gupta (✉) · P.K. Ranjekar Plant Molecular Biology Unit, Division of Biochemical Sciences, National Chemical Laboratory, Pune 411008, India e-mail:
[email protected] Tel.: +91-20-5893034/5893173, Fax: +91-20-5884032 R.K. Aggarwal Center for Cellular and Molecular Biology, Uppal Road, Hyderabad 500 007 India D.S. Brar PBGB division International Rice Research Institute, Manila, Philippines
Key words Genetic diversity · ISSRs · Oryza · Phylogeny
Introduction Rice is one of the agronomically and nutritionally important cereal crops and is the principal staple food in developing countries. There is a remarkably rich diversity in cultivated rice; however, a series of biotic and abiotic stresses continue to limit its productivity. Thus there is an urgent need to identify diverse sources of genes for tolerance to various stresses and broaden the rice gene pool. Wild species of Oryza are an important reservoir of useful genes and can be exploited both to broaden the existing narrow genetic base and enrich the existing varieties with desired agronomically important traits. The genus Oryza has two cultivated species, Oryza sativa (2n=24 AA) is grown world wide and Oryza glaberrima (2n=24 AA) is cultivated in a limited area of western Africa. Oryza has 22 wild species (2n=24 or 48) representing AA, BB, CC, BBCC, CCDD, EE, FF, GG and HHJJ genomes (Vaughan 1989; Aggarwal et al. 1997). The Oryza species have been grouped into four main species complexes, (1) Sativa, (2) Officinalis, (3) Ridleyi and (4) Meyeriama (Vaughan 1989). The species Oryza brachyantha (FF genome) does not fall into any of these complexes. The rice germplasm comprises 76614 accessions of O. sativa, 1255 accessions of O. glaberrima and 2779 accessions of wild-species and their natural hybrids (Jackson 1997). To effectively utilize wild species germplasm, it is essential to determine genetic diversity and identify a subset of alleles from the wild or exotic germplasm and produce elite breeding lines that would contain only specific “wild QTLs” or “genes”. Recently, Oryza rufipogon (2n=24 AA), one of the closest relatives of cultivated rice, despite its overall inferior appearance has been found to contain genes that can substantially increase the yield of rice (Xiao et al. 1996). A number of useful traits such as cytoplasmic male sterility, resistance
1312
to grassy stunt virus, bacterial blight, blast and brown plant hopper, have been introgressed from wild-species into cultivated rice (Brar and Khush 1997). Considering the large number of wild species germplasm available, it is difficult to choose which accession should be used in order to maximize the chances of finding new and useful genes. DNA profiles and genome-specific markers can be generated to determine genetic diversity and alien introgression into elite breeding lines. Morphological, isozyme and molecular markers, such as RFLPs, RAPDs, AFLPs and microsatellites, have been used to determine genetic diversity and phylogenetic relationships in Oryza (Tateoka 1962; Morinaga 1964: Second 1982; Dally and Second 1990; Wang et al. 1992; Aggarwal et al 1999). Our laboratory has been engaged in inter- and intraspecific-relationship analysis studies in the genus Oryza. In our previous studies, we have analyzed genetic diversity in rice germplasm including wild rice species and cultivated indica and japonica rice varieties using various types of molecular markers like microsatellites and minisatellites (Gupta et al 1994; Ramakrishna et al 1994, 1995). Genetic variability at specific loci has also been analyzed in the wild germplasm using Rm 122- and knotted-1 homeobox locus specific markers (Deshpande et al 1998; Ramakrishna et al 1998). The ISSRs (inter simple sequence repeats) are the regions that lie within the microsatellite repeats and offer great potential to determine intra-genomic and inter-genomic diversity compared to other arbitrary primers, since they reveal variation within unique regions of the genome at several loci simultaneously (Zietkicwicz et al 1994). Several properties of microsatellites, such as high variability among taxa, ubiquitous occurrence and high copy number in eukaryotic genomes (Weising et al. 1998), make ISSRs extremely useful markers. They exhibit specificity of sequence-tagged-site markers, but need no sequence information for primer synthesis enjoying the advantage of random markers. In the present study, we have exploited the potential of these markers in genotype profiling of members of the genus Oryza.
Materials and methods Plant material The material comprised 28 accessions of wild species belonging to nine genomes, viz. AA, BB, CC, EE, FF, GG, BBCC, CCDD and HHJJ, ten cultivars (indica and japonica), one landrace (indica) and three related genera (see Table 1). Most of the DNA samples used were obtained from the Plant Breeding, Genetics and Biochemistry Division, IRRI, The Philippines. The DNA was isolated following the method of Dellaporta et al. (1983) and its quality and quantity were estimated both spectrophotometrically, as well as visually, by ethidium bromide staining on agarose gels. PCR-amplification and electrophoresis A set of 100 anchored microsatellite primers was obtained from the University of British Columbia, Canada, while decamer arbitrary RAPD primers were from Operon Technologies, USA.
Amplification of DNA was performed in 10 mM of Tris-HCl pH 9.0, 50 mM of KCl, 1.5 mM of MgCl2, 0.25 mM of dNTPs, 2% formamide, 0.2 µM of primer, 0.5 mM of spermidine, 0.8 U of Taq DNA polymerase enzyme (Banglore Genei, India) and 20 ng of DNA per 25-µl reaction using a Double Engine thermal cycler (MJ Research, USA) for 45 cycles. After initial denaturation for 5 min at 94°C, each cycle comprised 1-min denaturation at 94°C, 45 s annealing at 49°C, 2-min extension at 72°C with a final extension for 5 min at 72°C at the end of 45 cycles. The annealing temperature was usually adjusted according to the Tm of the primer being used in the reaction. Amplified products were mixed with bromophenol blue gelloading dye and were analyzed by electrophoresis on a 2% agarose gel using 1× Tris Acetate EDTA buffer pH 8.0 at room temperature. In general, the quality of patterns generated differed from primer to primer. However, most of the patterns with extremely good polymorphism and useful information were often accompanied with a background smear. To reduce this smear, 2% formamide was used in the reaction. All the patterns generated were repeated at least three times in order to obtain reproducible data. Scoring of ISSR data points and construction of a dendrogram Each fragment that was amplified using ISSR primers, was treated as a unit character and scored in terms of a binary code (1/0=+/−). Only those bands that were reproducible and about 0.5-mm apart were considered for scoring. Table 1 indicates the total number of data points scored for each sample being analyzed. The 0/1 matrix was used to calculate similarity/genetic distance using the Dice coefficient. The resultant distance matrix was employed to construct an unweighted pair-group method with arithmetic means (UPGMA)-phenogram (Sokal and Michener 1958) using software packages NTSYS-PC 1.8 (F.J. Rohlf, State university of New York, Stony Brook, USA) and PHYLIP version 3.57 C′ (J. Felsenstein, University of Washington, Seattle, USA) to infer phylogenetic relationships. Bootstrapping was done using the software program ‘Winboot’ developed at IRRI to determine the confidence limits of the UPGMA-based dendrogram (Nelson and Yap 1996). Molecular weights of each of the potential specific bands were calculated using the software program “Seqid” (Rhoads and Roufa 1989).
Results To investigate the utility of microsatellite-directed DNA fingerprinting, 26 individual 3′-anchored (ISSR) microsatellite primers, two (ISSR+ISSR) primer combinations and two (ISSR+RAPD) primer combinations were used for amplification. The microsatellite primers used included dinucleotide repeats anchored at the 3′ end and a few tri-, tetra- and penta-nucleotide repeats. Of the 30 primers employed, 60% showed amplification, while, only 40% produced polymorphic fingerprints. Mostly dark and prominent bands were scored, although bands of lower intensity but with high reproducibility were also included in analysis (Table 1). The bands amplified using ISSR primers were in the range of 80 bp to 4.5 kb. Table 2 gives a description of the primers and the fingerprint patterns obtained using 30 selected primers. Of all the amplified profiles, the 11 best and highly polymorphic patterns were selected for further analysis. A total of 302 bands were scored from the 11 patterns and 87 were observed to be present in either individual accessions or species/genomes (Table 3).
1313 Table 1 List of plant material used in this study
List of samples used
Accession
Genome
Origin
Total no. of bands
1. O. glaberrima 2. O. glaberrima 3. O. longistaminata 4. O. perennis 5. O. rufipogon 6. O. rufipogon 7. O. punctata (2n) 8. O. punctata (4n) 9. O. minuta 10. O. minuta 11. O. rhizomatis 12. O. officinalis 13. O. officinalis 14. O. alta 15. O. grandiglumis 16. O. latifolia 17. O. latifolia 18. O. australiensis 19. O. australiensis 20. O. brachyantha 21. O. brachyantha 22. O. granulata 23. O. granulata 24. O. longiglumis 25. O. ridleyi 26. O. ridleyi 27. O. nivara 28. O. malampuzhaensis
TOG 6216 TOG 6229 – 104823 106424 105908 105980 100884 101141 101125 105432 100896 101399 105143 105669 100167 100965 100882 T-1434 101232 B98–8025 104986 106448 105148 100821 101453 – –
AA AA AA AA AA AA BB BBCC BBCC BBCC CC CC CC CCDD CCDD CCDD CCDD EE EE FF FF GG GG HHJJ HHJJ HHJJ AA BBCC
Africa Via Warda Africa Via Warda Africa Via CRRI, India Thailand Vietnam Thailand Cameroon India Philippines Philippines Sri Lanka Thailand Vietnam Guyana Brazil Costa Rica Costa Rica Australia via CRRI, India Australia via CRRI, India Sierra Leone Africa via CRRI India Nepal Indonesia Thailand Malaysia India India
55 52 53 58 54 59 57 66 61 57 58 54 50 72 58 70 64 66 62 59 62 52 53 46 49 67 61 51
O. sativa cultivars 29. IR 36 30. IR 64 31. BG 90–2 32. Basmati 370 33. Azucena 34. Indrayani 35. Ambemohr 36. Intan 37. Khadkya 38. Waseasahi 39. Hakkoda 40. Porteresia coarctata 41. Leersia 42. Rhynchoryza subulata
Indica Indica Indica Aromatic rice Japonica Indica Indica Indonesian Landrace Japonica Japonica Related genera Related genera Related genera
AA AA AA AA AA AA AA AA AA AA AA Unknown Unknown Unknown
Cultivated variety Cultivated variety Cultivated variety Cultivated variety Cultivated variety Cultivated variety Cultivated variety Cultivated variety Maharashtra, India Cultivated variety Cultivated variety Bangladesh Madagascar Argentina
62 54 56 69 62 64 61 64 75 67 71 54 48 40
Fingerprint patterns Dinucleotide repeats (AG)8 and (GA)8 with a number of anchors gave the best polymorphic and informative patterns. However, Oryza granulata accession 104986, originating from India, did not show any amplification with (GA)8 T but showed amplification when the (GA) repeat was anchored with C or A, indicating the possibility of a (GA) repeat flanked by C or A, and not by T, in this accession. Other dinucleotides, such as GT, TG, CA and CT, did not generate informative patterns. The AT repeat, irrespective of its anchor, produced smears, which could be attributed to its abundance in the rice genome. Figure 1 depicts fingerprints for various species of Oryza using the dinucleotide repeat (AG)8 YT. The primer revealed four potential individual-accession specific bands, one for Oryza longistaminata (lane 3; 745 bp) and
one each for Oryza alta (105143) (lane 14; 1000 bp), Oryza rhizomatis (105432) (lane 11; 970 bp) and O.ridleyi (101453) (Lane 26; 3600 bp). It also yielded five putative genome-specific bands, for the F genome (lanes 20, 21; 973 bp), the G genome (lanes 22, 23; 324 bp), the BC genome of Oryza minuta (lanes 9, 10, 2200 bp) and the HJ genomes (lanes 24, 25, 26; 769 bp) and one cultivated O. sativa-specific band that occurred in indica, japonica, the indica landrace, and their wild progenitor Oryza nivara (lanes 27, 29–39; 821 bp). Apart from this, the primer also produced a band that was common to the Oryza officinalis complex, which included the B, C, BC, and CD genomes (Lanes 7 to 17; 440 bp). The trinucleotide repeats, in general, produced polymorphism; however, the patterns were often accompanied with bright background smears. The unanchored tetra-nucleotide repeat (GATA)4 detected an extremely polymorphic and informative fingerprinting profile, and
1314 Table 2 Fingerprint patterns generated using the 30 ISSR primers
Primers used
Repeat motif
Amplification pattern
Amplification of specific bands
807 808 810 811 812 813 814 815 816 817 818 819 821 829 834 835 836 841 847 848 850 856 857 868 872 879 834+847 834+807 872+opA15 836+opA15
(AG)8 T (AG)8 C (GA)8 T (GA)8 C (GA)8 A (CT)8 T (CT)8 A (CT)8G (CA)8 T (CA)8 A (CA)8G (GT)8 A (GT)8 T (TG)8 C (AG)8YT (AG)8YC (AG)8YA (GA)8YC (CA)8RC (CA)8RG (GT)8YC (AC)8YA (AC)8YG (GAA)6 (GATA)4 (CTTCA)3 (AG)8Yt+(CA)8RC (AG)8YT+(AG)8T (GATA)4+opA15 (AG)8YA+opA15
Good Good Good Good Smeared with bands Improper amplification Good Smeared Improper amplification Not polymorphic Not polymorphic Not polymorphic Smeared pattern Smeared Good Good Not polymorphic Not very polymorphic Smeared Improper amplification Smeared with bands Smeared Smeared with bands Smeared with bands Good Good Good but with smear Good Good Not reproducible
Good Good Extremely good – – – Average
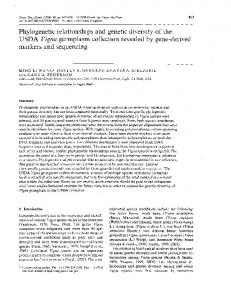
Fig. 1 ISSR PCR fingerprints of 39 samples of Oryza and three related genera using the 3′-anchored (AG)8 YT primer. The lane numbers are same as the sample numbers in Table 1. The lane marked M shows the 1-kb ladder being used as marker. The bands marked with white arrows are the specific bands amplified, which have been detailed in Table 3
yielded six putative accession /genome-specific bands (Table 3). The primer (GATA)4, when used in combination with RAPD primers, produced less bands, although the amplified products were uniquely present in most of the samples being analyzed (data not shown). The penta-nucleotide repeat, (CTTCA)3, when used for amplification as a representative of this group of
Good Average
Good Average Good Extremely good
microsatellite repeats generated informative patterns as depicted in Fig. 2. This primer produced two putative species-specific markers for the related genera Leersia (lane 41; 500 bp) and Rhynchoryza subulata (lane 42; 2600 bp), and two potential genome-specific markers for the E (lanes 18, 19; 2400 bp) and G genomes (lanes 22, 23; 370 bp). It did not give any amplification in both accessions of O. officinalis (CC genome) (lanes 12, 13) and one accession 100821 for O. ridleyi (HHJJ) (lane 25), indicating that these repeats are probably distantly located in these genomes and spaced well beyond the capacity of amplification by Taq DNA polymerase.
1315 Table 3 Putative genome/ species/cultivar specific bands revealed through ISSR fingerprinting
* The numbers in brackets indicate the UBC-anchored microsatellite primer numbers, while the subscripts indicate the molecular weights of the specific bands produced
Number of bandsa
Genome specific bands
Genome
O. officinalis complex O. ridleyi complex
B, C, 1 (834440) BC &CD HHJJ 2 (807+834520, 807247)
Species/genome specific O. nivara+all cultivars O. australiensis O. granulata O. minuta O. brachyantha O. ridleyi O. latifolia O. malampuzhaensis O. glaberrima
AA EE GG BBCC FF HHJJ CCDD BBCC AA
1(834821) 2 (872+opA15194, 8792400) 4 (879370, 834324, 807340, 872+opA151300) 3 (835270, 8342200, 8724400) 7 (834973, 8101195,335, 807+8341100, 872+opA15550, 444,808630) 1 (834769) 3 (8101636, 807696, 872+opA15639) 3 (8721600, 980, 814404) 1 (872+opA15380)
Accession O. glaberrima TOG-6229 O. longistaminata O. perennis 104823 O. minuta 101141 O. rhizomatis 105432 O. officinalis 100896 O. officinalis 101399 O. latifolia 100167 O. lalitolia 100965 O. alta 105143 O. grandiglumis 105669 O. australiensis 100882 O. australiensis T-1434 O. brachyantha B098–8025 O. Longiglumis 105148 O. redleyi 101453
AA AA AA BBCC CC CC CC CCDD CCDD CCDD CCDD EE EE FF HHJJ HHJJ
1(8101700) 4(834745, 8721004,807363,835614) 1 (807+8341300) 1 (872+opA15601) 4 (872+opA152200, 1600, 1400,834970) 3 (8722100,807+8342300, 872+opA151360) 1 (872+opA153000) 1 (810750) 1 (807+8341000) 7 (814523,363, 8341000, 8101366, 1021, 807+8342800, 455) 4 (810880, 785, 872+opA151460, 808662) 6 (808328, 835464, 807+8343000, 80798, 8102090, 666) 1 (807+opA15979) 1 (8352000) 1 (808556) 2 (808528, 8343600)
Cultivars IR-36 IR-64 Intan Waseasahi Hakkoda
AA AA AA AA AA
2 (872647, 807+834436) 1 (8721500) 2 (8071150, 158) 1 (8141600) 1 (807305)
Related genera Porteresia coarctata Leersia Rhynchoryza subulata
– – –
1(872+opA15250) 5 (8141430, 472, 879500, 810511, 835263) 2 (8792600, 872+opA15320)
Fig. 2 ISSR PCR fingerprints of 39 samples of Oryza and three related genera using the penta-nucleotide (CTTCA)3 primer. The lane numbers are same as the sample numbers in Table 1. The lane marked M shows the 1-kb ladder being used as marker. Note the lack of amplification in lane nos. 12, 13 and 25. The bands marked with white arrows are the specific bands amplified, which have been detailed in Table 3
Putative genome/species/cultivar specific markers Using various ISSR primers, 87 bands were identified, which can be converted into accession-, genome- and species-specific markers following further studies based on the present observations (Table 3). In general, the pat-
1316 Fig. 3 Dendrogram for the genus Oryza, obtained using the unweighted pair group method with arithmatic average (UPGMA). The numbers at the forks indicate the confidence limits for the grouping of those species, which are to the right of that fork. This UPGMA tree indicates generic affiliations among members of genus Oryza based on ISSR polymorphism
tern that produced the maximum number of specific bands (19 bands) was the one amplified using (GATA)4 in combination with a RAPD primer OPA 15, thus demonstrating the potential of the primer combination system (microsatellite+RAPD) in producing putative genome specific bands. Although no two amplification patterns were exactly identical, in general the bands that originated from the same species were similar (Figs. 1 and 2). The large number of unique bands obtained in the present analysis signifies the power of ISSR markers in fingerprinting and diversity analysis, especially between closely related species. However, owing to the large number of accessions available for each of the species in the genus Oryza, it is important to screen the specificity of these bands over a large sample size before affirming their diagnostic capacity.
Dendrogram: inter- and intra-species relationship The fingerprint patterns of the 42 samples being analyzed (Table 1) in the current study using various ISSR primers were used for cluster analysis. This analysis, in the form of a dendrogram (Fig. 3), was used as the basis to infer phylogenetic relationships in the genus Oryza. The bootstrap values seen at the nodes indicate that our data support phylogenetic inferences for groupings mostly at intra-specific levels, i.e. samples carrying similar genomes, and to a reasonable extent at inter-specific levels, and for part of the Latifolia group species. However, the bootstrap values are rather low for the rest of the inter-specific levels, indicating weaker inter-specific relationships in the genus Oryza.
1317
The generation of this dendrogram (Fig. 3) has involved the computation of a similarity coefficient matrix, which was used to calculate the genetic distance for all pairs of taxon units, and then the actual cluster analysis was done based on these values by the unweighted pair group method with arithmetic average (UPGMA). The confidence limits for using the Winboot program (Nelson and Yap 1996) to perform UPGMA-based bootstrapping, tested the groupings produced by this method. Two-thousand bootstrap replications were carried out as suggested by Hedges (1992) and the values were obtained in terms of the percentage of the number of times a group would be found in the bootstrap replications. In general, the consensus tree indicates that the species belonging to the same genome type group together with a high bootstrap value (91–100%). Accessions of the same species in most cases except O. rufipogon (70%), show about 98–100% bootstrap values, while within cultivars of O. sativa, the bootstrap values are much lower except for BG90–2 and the IR64 group where the value is as high as 98%. Apart from these observations, three major groups are seen in the dendrogram, a group-I O. sativa complex comprising the A-genome wild species and the cultivated rice varieties, a group-II O. officinalis complex including BB, CC, BBCC, and CCDD genomes, and a group-III which includes rest of the genomes, i.e the diploid genomes EE, FF, GG and the tetraploid HHJJ genome. Each of these four genomes maintains its independent status in the dendrogram. Besides the UPGMA analysis, parsimony analysis using Dollop (Phylip-based program) was also attempted (data not shown). The groupings remained more or less the same and no major shift in the positions of the taxons was noted. Interestingly, in this analysis, all the three related genera (Leersia, Rhynchoryza and Porteresia) grouped outside the Oryza complex without the need to re-root the tree.
Discussion Genome profiling using ISSR markers In view of the large collection (80000 accessions) of genetic resources of rice, and the importance of wild exotic germplasm in future breeding programs, it is essential to determine genetic diversity and phylogenetic relationships in Oryza species. By the use of DNA profiling, employing various molecular markers such as RFLPs, DAFs, RAPDs and microsatellites, the genetic uniqueness of each accession can be determined and quantified (Brown and Kresivich 1996); however, PCR-based markers are more suitable for large-scale analysis. Among the PCR-based markers, microsatellites are becoming more popular, both for genetic diversity and breeding research. Panaud et al. (1996) have established a linkage map in rice using microsatellites. The distribution of microsatellites in the rice genome indicates that there are an estimated 1360 poly (GA) and 1230 poly (GT) microsatellites per rice genome, while the number
of poly (AC) sites has been estimated to be 1000 with a genome size of 0.45×10⁹ bp (Wu and Tanksley 1993; Panaud et al. 1995). The most-frequent tetranucleotide repeat reported to-date in rice is poly (GATA) with about 270 poly (GATA) motifs in the entire rice genome (Panaud et al. 1995). Our finding that the most polymorphic pictures have been obtained using poly (GA) or (AG) microsatellites, irrespective of the anchors at the 3′ end, and that the most useful tetra-nucleotide repeat is (GATA)4, supports this microsatellite distribution. Also earlier studies in our laboratory (Ramakrishna et al. 1994) have demonstrated that (GATA)4 is the most useful tetra-nucleotide repeat for fingerprinting in rice, once again supporting our present observation. However, poly (GT) or (TG) and poly (CA) or (AC) microsatellites have not given good profiles in our analysis (Table 2), which may be due to the distribution of these repeats in the rice genome being beyond the range of amplification by Taq DNA polymerase. The primers used in our analysis are anchored at their 3′ end, to ensure that the annealing of the primer occurs only at the 3′ end of the microsatellite motif, thus obviating internal priming and smear formation. The anchor also allows only a subset of the targeted inter-repeat regions to be amplified, thereby reducing the high number of PCR products expected from the priming of dinucleotide inter-repeat regions to a set of about 10–50 easily resolvable bands. Pattern complexity can be tailored by applying different primer lengths and sequences (Zietkiewicz et al. 1994). Thus, owing to their better specificity and the background information available on the distribution of repetitive DNA in the rice genome (Panaud et al. 1995), 3′-anchored microsatellites, i.e. ISSRs, were exploited in the present study. To the best of our knowledge, this is the first report where the entire range of Oryza genomes and their related genera are compared using ISSR markers. The identification of inter- and intra-species polymorphism, obtained using ISSRs, opens up the possibility of using these as multilocus DNA markers and also for generating species/genome-specific markers. The unique bands can be converted into STS markers. Such specific markers would be of great value to detect alien introgression and to serve as DNA fingerprints for the characterization of the genetic resources of rice. Several duplicates could be eliminated and genetically diverse accessions from each species/genome could be selected for use in a breeding program. Evolutionary implications Apart from establishing the usefulness of ISSR markers for DNA profiling, the similarity/ diversity observed in the patterns of related species has enabled us to infer evolutionary relationships in the genus Oryza. The UPGMA-based dendrogram obtained from the binary data deduced through fingerprints of the 42 samples analyzed adds a new dimension to the perspectives generat-
1318
ed for the evolution of the genus Oryza by other molecular markers such as isozymes, RFLPs, AFLPs and chloroplast DNA probes, as well by different morphological markers. The ISSR analysis has revealed a new understanding about the relationship at inter-species/intra-genomic levels with high bootstrap values, but is weak in respect of the inferences related to higher level intergroup relationships. Evolution of the A genome The genus Oryza consists of nine genomes, amongst which only the A genome has been domesticated over the years. The common rice O.sativa and the African rice O. glaberrima are thought to be an example of parallel evolution in crop plants (Oka 1991). O. rufipogon is considered to be the wild progenitor of Asian rice O. sativa, which shows a range of variation from perennial to annual types, while that of O. glaberrima is Oryza barthii, which is an annual grass endemic to West Africa. In our analysis we find that O. rufipogon and O. glaberrima form two separate clusters. O. longistaminata, which is geographically known to be an African rice, shows more similarity with O. glaberrima than with O. rufipogon. Similar to the earlier observations based on AFLP markers (Aggarwal et al. 1999), among the A genomes the African forms are the most distant and do not align with O. rufipogon/Oryza perennis, but fall in the A-genome group of Asian species. Wild progenitors of cultivars O. rufipogon is distributed from Pakistan to China and Indonesia, and varies between perennial and annual types, which differ markedly in life-history traits (Oka 1988). The variation between perennial and annual types is nearly continuous. It has been suggested that some intermediate perennial-annual populations, which regenerate by both ratoon and seed, are most likely to be the immediate progenitors of cultivated rice, because they have a high evolutionary potential as shown by their rich genetic variability, a moderately high seed productivity and tolerance for habitat disturbance (Sano et al. 1980; Oka 1988). The consensus tree obtained from our data using the ISSR markers, supports this theory, as the cultivars form a clear grouping with O. nivara, the annual form of O. rufipogon, and then cluster with the perennial forms including accessions of O. rufipogon and O. perennis. The clustering of genotypes in the A-genome (O. sativa) complex and the diversity between O. nivara and other accessions of O. rufipogon and O. perennis may support the proposition made by Sastry and Sharma (1965) that O. rufipogon needs to be divided into two categories.
Indica- japonica differentiation from wild progenitors Differentiation of O. sativa into two types, indica and japonica, is an interesting feature in the evolution of rice. There are two schools of thought regarding the evolution of these two plant types, monophyletic evolution and diphyletic evolution. A number of evidences are available in favor of each of these evolutionary paths. The diphyletic path was proposed by Chinese workers (Oka 1988), and was supported by Wang et al. (1992), while monophyletic evolution was supported by a number of lines of evidence (Ting 1957; Oka and Morishima 1982; Wang et al. 1984; Glazmann 1987; Oka 1988, 1991). The indica japonica clusters first join together and then group with O. nivara (the annual form of O. rufipogon) before joining the cluster of O. rufipogon/O. perennis, thus suggesting evolution of indica-japonica rice to be monophyletic. Interestingly Fig. 1 has yielded a single band that was shared by all the cultivars and their wild progenitor O. nivara, which seems to be missing in the other forms of the A genome, supporting the above observation to some extent. Evolution of other genomes O.officinalis complex. This is the second major complex in the genus Oryza and is the most divergent since it includes diploid BB, CC and EE genomes, and tetraploid BBCC and CCDD species (Vaughan et al. 1989). However, the dendrogram (Fig. 3) constructed with ISSRs, suggests that the EE genome may not be a part of the officinalis complex and has its own independent status in the genus Oryza. A putative O. officinalis-complex specific band was observed in one of our fingerprint profiles (Fig. 1), obtained using primer (AG)8 YT, which is present only in the four genome types BB, CC, BBCC and CCDD, and absent in the EE genome of Oryza australiensis. In the officinalis complex, the BB, CC, and BBCC genomes form one cluster while the CCDD genomes form a second cluster (Latifolia group). Within the first cluster, it is observed that Oryza punctata and Oryza malampuzhensis (both BBCC genomes) are closer to the BB genome than to the CC genome. The closer proximity of O. punctata (BBCC) to O. malampuzhensis (BBCC) is in agreement with previous observations made by Wang et al. (1992). The tetraploid species representing the the CCDD genome, viz. Oryza latifolia, O. alta, and Oryza grandiglumis, form two groups within them as suggested by Wang et al. (1992). O. alta and O. grandiglumis (belonging to Guyana and Brazil, respectively) are more closely related to each other than to O. latifolia, while the two accessions of O. latifolia (both from Costa Rica) cluster together. This observation is consistent with that made by Wang et al. (1992) using RFLPs and by Aggarwal et al. (1997, 1999) using whole-genome hybridization and AFLP analysis, respectively. The diverse nature
1319
of the CCDD-genome types may be due to the unique DD-genome component, the origin of which is still a mystery. It has been widely proposed that the D genome originated from other diploid members of the genus Oryza. Our results, however, are unable to provide any clear indication on this proposal, as the CD-genome members are almost equidistant from them. Other genomes. These include the diploid genomes O. granulata (GG genome), O. australiensis (EE genome) and O. brachyantha (FF genome) and tetraploid genome O. ridleyi (HHJJ genome). Our data are not quite in agreement with the previous reports regarding the distribution of these genomes in the phenograms of the genus Oryza. As suggested by Wang et al. (1992), O. brachyantha (FF genome) stands as an independent species but has no affinity with the A genome (O. sativa). However, our results indicate that O. brachyantha is the most-diverse genome and forms a separate group. This is in agreement with the AFLP analysis of Oryza, which also suggests O. brachyantha to be the most divergent species (Aggarwal et al. 1999). Similarly the EE genome has often been grouped with the officinalis complex in a number of previous reports (e.g. Wang et al. 1992) and has always been proposed to be a possible progenitor of the D genome, while Tateoka (1962) proposes the EE genome to have a separate status. Our analysis supports the latter view. The “G genome” maintained its individual status, which is in accordance with Aggarwal et al. (1999) and Wang et al. (1992). The HHJJ genome is one of the newly designated genome like the G genome (Aggarwal et al. 1997). The complex consists of O. ridleyi accessions and O. longiglumis, and shows a clear separate group formation in our cluster analysis, thus supporting its separate biosystematic status in the genus Oryza. The three related genera/species, Porteresia coarctata, R. subulata, and Leersia, align with different Oryza groups in distance-based UPGMA analysis, but with absolutely non-significant bootstrap values; however, in parsimony analysis all three species lie outside the Oryza complex. In summary the ISSR markers provide a powerful tool for the generation of potential fingerprinting diagnostic markers for genomes/species/cultivars. Also phylogenetic analysis on the basis of the ISSR-derived phenogram supports polyphyletic evolution in the genus Oryza, wherein multiple lineages underwent independent divergence after separation from a common ancestor. Acknowledgements S.P.J. acknowledges the Council of Scientific and Industrial Research New Delhi for the grant of Senior Research Fellowship. The Rockefeller Foundation USA is acknowledged for financial support (grant No. RF 99001#751). Finally, Dr. McNallay, Molecular Biologist, PBGB, IRRI, The Philippines, is acknowledged for reviewing the paper and providing critical comments.
References Aggarwal RK, Brar DS, Khush GS (1997) Two new genomes in the Oryza complex identified on the basis of molecular divergence analysis using total genomic DNA hydridization. Mol Gen Genet 254:1–12 Aggarwal RK, Brar DS, Nandi S, Huang N, Khush GS (1999) Phylogenetic relationships among Oryza species revealed by AFLP markers. Theor Appl Genet 98 (1999) 8, 1320–1328 Brar DS, Khush GS (1997) Alien introgressionin rice. Plant Mol Biol 35:35–47 Brown SM, Kresovich S (1996) In: Paterson AH (ed) Genome mapping in plants. Clandes, New York, pp 85–93 Dally AM, Second G (1990) Chloroplast DNA diversity in wild and cultivated species of the rice genus Oryza, section Oryza. Cladistic-mutation and genetic-distance analysis. Theor Appl Genet 80:209–222 Dellaporta SL, Wood J, Hick JB (1983) A plant DNA minipreparation:version II. Plant Mol Biol Rep 1:19–21 Deshpande AD, Ramakrishna W, Mulay GP, Gupta VS, Ranjekar PK (1998) Evolutionary and polymorphic organization of the Knotted-1 homeobox in cereals. Theor Appl Genet 97:135– 140 Felsenstein J (1985) Confidence limits on phylogenies: an approach using the bootstrap. Evolution 39:783–791 Glaszmann (1987) Isozyme classification of asian rice varieties. Theor Appl genet 74:21–30 Gupta VS, Ramakrishna W, Rawat SR, Ranjekar PK (1994) (CAC)5 detects DNA fingerprints and sequences homologous to gene transcripts in rice. Biochem Genet 32:1–8 Hedges SB (1992) The number of replications needed for accurate estimation of the bootstrap value in phylogenetic studies. Mol Biol Evolution 9:366–369 Jackson MT (1997) Conservation of rice genetic resources: the role of international gene bank at IRRI. Plant Mol Biol 35:61– 67 Morinaga T (1964) Cytogenetical investigations on Oryza species. In: IRRI (ed) Rice genetics and cytogenetics. Elsevie, Amsterdam, pp 91–103 Nelson RJ, Yap VI (1996) Win Boot: a program for performing boot-strap analysis of binary data to determine the confidence limits of UPGMA-based dendrograms. IRRI Discussion paper series No. 14. Interational Rice Research Institute, PO Box 933, Manila, The Phillipines Oka HI (1988) Origin of cultivated rice. Japan Scientific Societies Press, Tokyo; Elsevier, Amsterdam Oxford New York Tokyo Oka HI (1991) Genetic diversity of wild and cultivated rice. In: Khush GS, Toenniessen GH (eds) Rice biotechnology. Biotechnology in Agriculture No. 6 Oka HI, Morishima H (1982) Phylogenetic differentiation of cultivated rice. 23. Potentiality of wild progenitors to evolve the indica and joponica types of rice cultivars. Euphytica 31:41– 50 Panaud O, Chen X, McCouch SR (1995) Frequency of microsatellite sequences in rice (Oryza sativa L). Genome 38:1170–1176 Panaud O, Chen X, McCouch SR (1996) Development of microsatellite markers and characterization of simple sequence length polymorphism (SSLP) in rice (Oryza sativa L.). Mol Gen Genet 252:597–607 Ramakrishna W, Lagu MD, Gupta VS, Ranjekar PK (1994) DNA fingerprinting in rice using oligonucleotide probes specific for simple repetitive DNA sequences Theor Appl Genet 88:401– 406 Ramakrishna W, Chowdari KV, Lagu MD, Gupta VS, Ranjekar PK (1995) DNA fingerprinting to detect genetic variation in rice using hypervariable DNA sequences. Theor Appl Genet 90:1000–1006 Ramakrishna W, Davierwala AP, Gupta VS, Ranjekar PK (1998) Expansion of a (GA) dinucleotide at a microsatellite locus associated with domestication in rice. Biochem Genet 36:9/10 323–327
1320 Rhoads DD, Roofa DJ (1989) SEQUID II. Kansas State University Molecular Genetics Laboratory, Manhatten Sano Y (1980) Adaptive strategies compared between diploid and tetraploid forms of O. punctata. Bot Mag Tokyo 93:171–180 Second G (1982) Origin of the genetic diversity of cultivated rice (Oryza ssp.). Study of the polymorphism scored at 40 isozyme loci. Jpn J Genet 57:25–57 Shastry SVS, Sharma SD (1965) Taxonomic studies in the genus Oryza L.III. O. rufipogon Griff sensor strictro O. nivara sharma et shastry nom. nov. Indian J Genet Plant Breed 25: 157–161 Sokal RR, Michener CD (1958) A statistic method for evaluating systematic relationships. Univ Kans Sci Bull 28:1409–1438 Tateoka (1962) Taxonomic studies of Oryza. II. Several species complexes. Bot Mag Tokyo 75:165–173 Ting Y (1957) The origin and evolution of cultivated rice in China (in Chinese). Acta Agron Sinica 8:243–260 Vaughan D (1989) The genus Oryza L. current status of taxonomy. IRRI Research paper Series Number 138
View publication stats
Wang XK, Cheng KS, Lu YX, Luo J, Guang NW, Liu GR (1984) Studies on indigenous rice in Yunnan and their utilization. 3. Glabrous rice in Tunnan and in China. Acta Univ Agric Pekinensis 10:333–344 Wang ZM, Second G, Tanksley SD (1992) Polymorphism and phylogenetic relationships among species in the genus Oryza as determined by analysis of nuclear RFLPs. Theor Appl Genet 83:565–581 Weising K, Winter P, Hutter B, Kahl G (1998) Microsatellite markers for molecular breeding. Crop Sciences: Recent Advances Vol. I, No. I, pp 113–143 Wu KS, Tanksley SD (1993) Abundance, polymorphism and genetic mapping of microsatellites in rice. Mol Gen Genet 241:225–235 Xiao OJ, Grandillo S, Ahn SN, McCouch SR, Tanksley SD (1996) Genes from wild rice improve yield. Nature 384:223–224 Zietkiewicz E Rafalski A, Labuda D (1994) Genome fingerprinting by simple sequence repeat (SSR)-anchored polymerase chain reaction amplification. Genomics 20:176–183