RESEARCH
Genetic Diversity of Turkish Olive Varieties Assessed by Simple Sequence Repeat and Sequence-Related Amplified Polymorphism Markers Neslihan Işık, Sami Doğanlar, and Anne Frary* ABSTRACT Olive (Olea europaea L.) is one of the most important and characteristic fruit crops of the Mediterranean region. This crop has been grown in Turkey for more than 3000 yr and many varieties are currently grown in five geographic regions. In this study, the genetic diversity of 66 olive varieties from these regions was assessed using simple sequence repeat (SSR) and sequencerelated amplified polymorphism (SRAP) markers. The 13 SSR markers yielded 89 alleles with an average polymorphism information content (PIC) of 0.29 and 6.8 alleles per marker while the 13 SRAP primer combinations generated 103 polymorphic alleles with an average PIC of 0.24 and 7.9 alleles per combination. Although SSR markers revealed higher levels of polymorphism than SRAP markers, both systems revealed considerable molecular genetic diversity in Turkish olive varieties. For both marker types, clustering analysis using the Dice similarity coefficient and the unweighted pair group method with arithmetic means (UPGMA) produced dendrograms with similar clustering and some region-specific grouping of varieties. Overall, Southeast Anatolian and Marmara varieties were found to be more genetically different than those from the other regions (Aegean, Mediterranean, and Black Sea) and homonymous varieties were identified: three pairs of varieties (‘Egriburun’, ‘Celebi’, and ‘Tasarasi’) had the same names but were genetically distinct.
Dep. of Molecular Biology and Genetics, Izmir Institute of Technology, Urla, 35430 Izmir, Turkey. Received 1 Nov. 2011.*Corresponding author (
[email protected]). Abbreviations: dNTP, deoxyribonucleotide triphosphate; ORF, open reading frame; PCA, principal component analysis; PCR, polymerase chain reaction; PIC, polymorphism information content; RAPD, random amplified polymorphic DNA; SRAP, sequence-related amplified polymorphism; SSR, simple sequence repeat; UPGMA, unweighted pair group method with arithmetic means.
O
live (Olea europaea L.) is a crop with cultural, nutritional, and economic importance and is evocative of the Mediterranean region (Loumou and Giourga, 2003). Olives are rich in monounsaturated fatty acids (oleic acid) and antioxidants, have recognized health benefits, and are an integral ingredient in Mediterranean cuisine (Grigg, 2001; Visioli et al., 2002). Archeological evidence indicates that olive was fi rst cultivated as a crop plant 5000 yr ago in Palestine (Zohary and Spiegel-Roy, 1975) and that it was introduced to Anatolia sometime before 1000 B.C. (Owen et al., 2005). Today, olive trees are grown on 727,000 ha in Turkey and annually yield approximately 1.3 million t of fruit (FAOSTAT, 2009). Worldwide, approximately 18 million t of olives and 2.9 million t of virgin olive oil are produced yearly on 10 million ha of land (FAOSTAT, 2009). Traditional olive varieties, developed via empirical selection for adaptation to endemic conditions (Besnard et al., 2001; Baldoni et al., 2006), are still grown in most regions. Because olive is widely propagated by vegetative means, individual trees within these traditional varieties are genetically uniform but retain the heterozygosity typical of landraces. Morphological identification of olive is difficult because
Published in Crop Sci. 51:1646–1654 (2011). doi: 10.2135/cropsci2010.11.0625 Published online 27 May 2011. © Crop Science Society of America | 5585 Guilford Rd., Madison, WI 53711 USA All rights reserved. No part of this periodical may be reproduced or transmitted in any form or by any means, electronic or mechanical, including photocopying, recording, or any information storage and retrieval system, without permission in writing from the publisher. Permission for printing and for reprinting the material contained herein has been obtained by the publisher.
1646
WWW.CROPS.ORG
CROP SCIENCE, VOL. 51, JULY– AUGUST 2011
of the tree’s long life cycle. In contrast, molecular genetic characterization has several advantages because molecular markers can be applied to immature plants, are unaffected by environment, are highly informative, and provide accurate variety characterization. Thus, such characterization can simplify germplasm management and preservation. For example, molecular marker analysis can be used to identify homonyms (genetically distinct varieties given the same name) and synonyms in germplasm collections. In recent years, molecular marker systems have been used for variety identification and assessment of genetic diversity in the olive germplasm of various countries (reviewed in Bracci et al., 2010; Doveri and Baldoni, 2007). Many of these studies used simple sequence repeat (SSR) markers (also known as microsatellites). Simple sequence repeats are short tandem repeats of DNA; different numbers of the repeat motif (1–6 bp long) at a given locus result in genetic polymorphism. Simple sequence repeat markers are multiallelic, codominant markers and are preferred for diversity studies because they are simple to detect, highly polymorphic, transferable, and reproducible (Zietkiewicz et al., 1994; Aranzana et al., 2003). Sequencerelated amplified polymorphism (SRAP) markers are also being applied more and more frequently for germplasm characterization. Sequence-related amplified polymorphism technology uses arbitrary primer sets containing a core region with CCGG sequence at the 5′ end of the forward primer and AATT sequence at the 3′ end of the reverse primer to recognize and amplify open reading frames (ORFs) (Li and Quiros, 2001). Like SSR markers, SRAPs are easy to use and highly polymorphic; however, they are dominant markers. In the present study, SSR and SRAP markers were used to analyze the genetic diversity of 66 olive varieties grown in Turkey. Specimens were collected from the major olive-growing regions in Turkey, namely, the Aegean, Black Sea, Marmara, Mediterranean, and Southeast Anatolia regions. The study also allowed a comparison of the usefulness of SSR and SRAP marker systems for diversity characterization and varietal evaluation in olive.
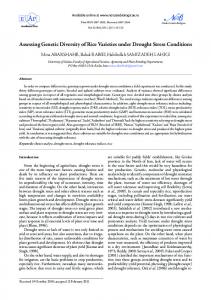
MATERIALS AND METHODS Plant Materials Leaves from 66 Turkish olive accessions were gathered from the Alata and Ataturk Central Horticultural Research Institutes, the Yusufeli, Milas agricultural office, and the Kilis, Hatay city office of agriculture. Six individuals originated from the Black Sea region, nine from the Marmara region, 12 from the Mediterranean region, 16 from the Southeast Anatolia region, and 23 from the Aegean region (Table 1; Fig. 1). Three European olive varieties from Spain (‘Manzanilla’), Italy (‘Ascolana’), and France (‘Lucques’) were chosen as outgroups.
DNA Isolation Genomic DNA was extracted from young leaves of each accession using the method of Saghai Maroof et al. (1984) with CROP SCIENCE, VOL. 51, JULY– AUGUST 2011
some modifications. Young leaves were ground in liquid N and stored in 50 mL polypropylene tubes at –80°C. A total of 20 mL cetyltrimethylammonium bromide (CTAB) extraction buffer with 0.1 mL β-mercaptoethanol was added to 6 g leaf powder and incubated at 65°C for 90 min with mixing every 5 min. Then 10 mL of 24:1 chloroform:isoamyl alcohol were added and the tubes were inverted for 5 min and centrifuged at 14000 × g for 10 min at room temperature. The supernatant was transferred to a clean tube and the choloform:isoamyl alcohol step was repeated. Isopropanol was added at a ratio of 1:1 to the supernatant and samples were stored at –20°C overnight. Precipitated DNA was centrifuged at 4000 × g at 4°C for 10 min and the pellet was washed with ice-cold 70% ethanol. After washing, the DNA was pelleted by centrifugation (4000 × g at 4°C) for 5 min. Then the ethanol was evaporated and the DNA pellet was dissolved in 500 μL Tris-EDTA (ethylenediaminetetraacetic acid) (TE) buffer, pH 8.0.
Simple Sequence Repeat Marker Genotyping Thirteen previously published olive microsatellite primer pairs were used for genotyping the accessions (Table 2). Polymerase chain reactions (PCRs) were performed in a 25 μL reaction volume containing: 40 ng of DNA, 1 pmol of forward and reverse primers, 1x PCR buffer, 3 mM MgCl 2, 0.125 mM deoxyribonucleotide triphosphates (dNTPs), 1 U Taq Polymerase. Polymerase chain reaction conditions were 94°C for 3 min; followed by 36 cycles of 94°C for 30 s, 45 s at the appropriate annealing temperature (Table 2) and 72°C for 45 s, with fi nal extension at 72°C for 7 min. Polymerase chain reactions were performed in an Eppendorf Mastercycler Epgradient S (Eppendorf AG, Hamburg, Germany). Amplification products were separated using the high resolution kit and OL500 method for a Qiagen capillary electrophoresis device (Qiagen, Valencia, CA).
Sequence-Related Amplified Polymorphism Marker Genotyping For SRAP analysis, all combinations of EM forward primers (EM1 to EM17) and ME reverse primers (ME1 to ME14) were surveyed on a subset of accessions (Li and Quiros, 2001). Polymerase chain reactions were performed in a 20 μL reaction volume containing 100 ng of genomic DNA, 2 pmol of forward and reverse primers, 1x PCR buffer, 3 mM Mg 2+, 0.7 μM dNTPs, and 1 U Taq Polymerase. Polymerase chain reaction conditions were 94°C for 5 min for denaturation; followed by 5 cycles at 94°C for 1 min, 35°C for 1 min, and 72°C for 1 min; followed by 35 cycles at 94°C for 1 min, 55°C for 1 min, and 72°C for 1 min; with a fi nal extension at 72°C for 10 min. The 13 most polymorphic SRAP primer combinations (Table 3) were then assayed on all of the Turkish olive varieties. The amplified DNA fragments were separated on 4% agarose gels, stained with ethidium bromide (1:20.000 v:v), and photographed using a ultraviolet (UV) transilluminator.
Data Analysis Simple sequence repeat data were converted to binomial (dominant [in other words, present or absent]) data by Qiaxcel software (Qiagen, Valencia, CA) and checked by visual inspection of gel images and peak signals. Sequence-related amplified
WWW.CROPS.ORG
1647
Table 1. Turkish olive varieties used in the study.
†
Genotype
Variety
Origin†
Genotype
Variety
Origin†
1 2 3 4 5 6 7 8 9 10 11 12 13 14 15 16 17 18
‘TrabzonYaglik’ ‘SamsunYaglik’ ‘Pastos’ ‘Otur’ ‘Sati’ ‘SiyahSalamuralik’ ‘SamsunTuzlamalik’ ‘BeyazYaglik’ ‘Cizmelik’ ‘ErdekYaglik’ ‘Edincik’ ‘EsekZeytini’ ‘Trilya’ ‘Samanli’ ‘Celebi’ ‘BuyukTopakUlak’ ‘SariUlak’ ‘Celebi’
Trabzon, BLS Samsun, BLS Trabzon, BLS Artvin, BLS Artvin, BLS Tekirdag, MAR Samsun, BLS Tekirdag, MAR Tekirdag, MAR Balikesir, MAR Balikesir, MAR Tekirdag, MAR Bursa, MAR Iznik, MAR Iznik, MAR Tarsus, Mersin, MED Tarsus, Mersin, MED Silifke, Mersin, MED
36 37 38 39 40 41 42 43 44 45 46 47 48 49 50 51 52 53
‘IriYuvarlak’ ‘YagCelebi’ ‘Zoncuk’ ‘Halhali’ ‘Hursuki’ ‘Belluti’ ‘Melkabazi’ ‘Mavi’ ‘AyvalikYaglik’ ‘HurmaKaraca’ ‘HurmaKara’ ‘Erkence’ ‘Cilli’ ‘IzmirSofralik’ ‘Cakir’ ‘Memeli’ ‘Dilmit’ ‘GiritZeytini’
Bulaklı, Urfa, SAN Bulaklı, Urfa, SAN Derik, Mardin, SAN Derik, Mardin, SAN Derik, Mardin, SAN Derik, Mardin, SAN Derik, Mardin, SAN Derik, Mardin, SAN Ayvalik, AEG Izmir, AEG Izmir, AEG Izmir, AEG Izmir, AEG Izmir, AEG Izmir, AEG Izmir, AEG Bodrum, Mugla, AEG Bodrum, Mugla, AEG
19 20 21 22 23 24 25’ 26 27 28 29 30 31 32 33 34 35
‘Halhali’ ‘SariHasebi’ ‘Saurani’ ‘Sayfi’ ‘Karamani’ ‘Elmacik’ ‘YaglikSariZeytin’ ‘KilisYaglik’ ‘NizipYaglik’ ‘KanCelebi’ ‘HalhaliCelebi’ ‘HamzaCelebi’ ‘YuvarlakHalhali’ ‘YaglikCelebi’ ‘YunCelebi’ ‘Egriburun’ ‘Egriburun’
Hatay, MED Hatay, MED Hatay, MED Hatay, MED Hatay, MED Hatay, MED K.Maras, MED Kilis, MED Antep, SAN Antep, SAN Hatay, MED Antep, SAN Antep, SAN Antep, SAN Antep, SAN Antep, SAN Bulaklı, Urfa, SAN
54 55 56 57 58 59 60 61 62 63 64 65 66 67 68 69
‘TavsanYuregi’ ‘AkZeytin’ ‘Cekiste’ ‘KaraYaprak’ ‘YagZeytini’ ‘YerliYaglik’ ‘AsiYeli’ ‘Tasarasi’ ‘Tasarasi’ ‘Memecik’ ‘Domat’ ‘Kiraz’ ‘Uslu’ ‘Manzanilla’ ‘Ascolana’ ‘Lucques’
Milas, Mugla, AEG Odemis, Izmir, AEG Odemis, Izmir, AEG Kusadasi, Izmir, AEG Kusadasi, Izmir, AEG Kusadasi, Izmir, AEG Aydin, AEG Kusadasi, Izmir, AEG Aydin, AEG Milas, Mugla, AEG Akhisar, Manisa, AEG Akhisar, Manisa, AEG Akhisar, Manisa, AEG Spain, EUR Italy, EUR France, EUR
Regions: BLS, Black Sea; MAR, Marmara; MED, Mediterranean; SAN, Southeast Anatolia; AEG, Aegean; EUR, Europe.
Figure 1. Map of Turkey showing the regions of origin of olive varieties used in this study. Samples are color-coded by geographical region: Black Sea is red, Marmara is pink, Aegean is green, Mediterranean is blue, and Southeast Anatolian is brown.
1648
WWW.CROPS.ORG
CROP SCIENCE, VOL. 51, JULY– AUGUST 2011
Table 2. Motif and polymorphism information for the simple sequence repeat (SSR) loci used to characterize Turkish olive varieties. Locus
Repeat motif
DCA3 DCA4 DCA7
(GA)19 (GA)16 (AG)19
DCA11 DCA14 DCA18 EMO90 GAPU71B GAPU101 UDO9 UDO24 UDO28 UDO43 † ‡
(GA)26(GGGA)4 (CA)18A6(TAA)7 (CA)4CT(CA)3(GA)19 (CA)10 GA(AG)6(AAG)8 (GA)8(G)3(AG)3 (AG)16 (CA)11(TA)2(CA)4 (CA)23(TA)3 (GT)12
Annealing temperature (°C)
No. of alleles
Average PIC† ± SE
Range of PIC values
Primer references‡
60 55
7 11
0.38 ± 0.06 0.20 ± 0.05
0.06–0.50 0.03–0.49
1 1
60 58 60 55 60 60 60 55 56 68 58
8 6 8 4 8 7 15 1 2 6 6
0.28 ± 0.06 0.22 ± 0.06 0.34 ± 0.05 0.31 ± 0.10 0.38 ± 0.03 0.36 ± 0.05 0.29 ± 0.03 0.09 0.33 ± 0.17 0.26 ± 0.06 0.36 ± 0.06
0.03–0.50 0.06–0.46 0.09–0.50 0.03–0.50 0.29–0.50 0.22–0.50 0.17–0.47 None 0.15–0.50 0.12–0.48 0.11–0.49
1 1 1 1 2 3 3 4 4 4 4
PIC, polymorphism information content. References for primer sequences: 1, Sefc et al., 2000; 2, De la Rosa et al., 2002; 3, Carriero et al., 2002; 4, Cipriani et al. (2002).
Table 3. Average polymorphism information content (PIC) values for simple sequence repeat (SSR) and sequence-related amplified polymorphism (SRAP) markers by origin. SSR Origin
Average PIC ± SE
Southeast Anatolia Marmara Aegean Mediterranean Black Sea
0.28 ± 0.02 a† 0.28 ± 0.02 a 0.26 ± 0.02 ab 0.24 ± 0.02 ab 0.22 ± 0.02 b
†
SRAP Average PIC Origin ± SE Southeast Anatolia 0.23 ± 0.02 a Marmara 0.21 ± 0.02 ab Aegean 0.18 ± 0.02 bc Mediterranean 0.16 ± 0.02 c Black Sea 0.14 ± 0.02 c
Values followed by a different letter are significantly different at p ≤ 0.05 as determined by a Student’s t test.
polymorphism binomial data were generated by visual inspection of gel images. The polymorphism information content (PIC) of each locus was calculated as PICi = 2 f i(1 – f i), in which f i is the frequency of band presence for marker i (Roldan-Ruiz et al., 2000). This formula was used as it is suitable for calculation of PIC for dominant markers. Similarity matrices were calculated using the Dice coefficient (Dice, 1945). These distance data were used to generate dendrograms using the unweighted pair group method with arithmetic means (UPGMA) algorithm as implemented by NTSYS-pc program ver.2.2 (Rohlf, 2004). Goodness of fit was calculated by Mantel test (Mantel, 1967). Principle component analysis was performed using NTSYS.
RESULTS Simple Sequence Repeat Characterization The 13 SSR markers divulged 89 alleles in the Turkish olive varieties with an average of 6.8 alleles per primer combination and an average PIC value of 0.29 (Table 2; Note: PIC values as calculated according to the formula given in the materials and methods range from 0 to 0.50.). Polymorphism information content values for individual SSR markers ranged from 0.09 to 0.38. DCA3, EMO90, and GAPU71B were the most informative markers. When compared among regions, PIC values were highest for the CROP SCIENCE, VOL. 51, JULY– AUGUST 2011
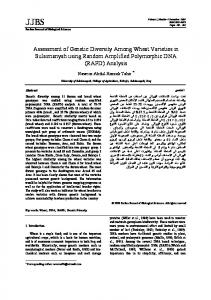
Southeast Anatolian and Marmara varieties (0.28) and significantly lower for the Black Sea varieties (0.22; Table 3). The SSR data for the 66 Turkish olive varieties and three outgroups were used to draw a UPGMA dendrogram (Fig. 2). Based on a Mantel test, the correlation between the dendrogram and distance matrix was r = 0.85 indicating a good fit between the tree and distance data. Genetic similarity coefficients varied from 0.27 to 0.89. The European varieties clustered outside of the Turkish ones with 0.27 similarity between these outgroups and the Turkish olives. The outgroups had a genetic similarity of 0.55 with the Italian (Ascolana [genotype 68]) and French (Lucques [genotype 69]) varieties more closely related to each other than the Spanish one (Manzanilla [genotype 67]). The SSR-based dendrogram revealed a minimum genetic similarity coefficient of 0.45 for the Turkish olive varieties. Most of these varieties fell into six clusters at 0.50 similarity. However, two Turkish varieties, ‘Uslu’ (genotype 66) and ‘Egriburun’ (35), fell outside of these clusters. The largest cluster, B, contained 43 varieties that subdivided into two main and three smaller groups at 0.59 similarity. Cluster B1 contained 13 varieties with ‘Halhali Celebi’ (genotype 29) and ‘Yuvarlak Halhali’ (31) the most similar (0.90). Cluster B2 contained 23 varieties with three pairs of varieties having nearly 0.90 genetic similarity: ‘Celebi’ (genotype 18) and Halhali (19), ‘Hurma Kara’ (46) and ‘Yerli Yaglik’ (59), and ‘Asi Yeli’ (60) and ‘Memecik’ (63). The varieties in cluster B2 fell into two main groups that were consistent with origin. Cluster B2a was nearly exclusively composed of Aegean and Mediterranean varieties (16 varieties) with only one member from Southeast Anatolia. Cluster B2b contained Southeast Anatolian varieties (five varieties) with one Mediterranean accession. The second largest cluster was cluster A with 11 varieties. These varieties were more genetically distinct than those in clusters B1 and B2 with a maximum similarity of 0.80. In addition, this cluster contained varieties from everywhere but the
WWW.CROPS.ORG
1649
1650
WWW.CROPS.ORG
CROP SCIENCE, VOL. 51, JULY– AUGUST 2011
Figure 2. Unweighted pair group method with arithmetic means (UPGMA) dendrogram of the 66 Turkish and three European olive varieties based on 89 simple sequence repeat (SSR) alleles.
Table 4. Polymorphism information for sequence-related amplified polymorphism (SRAP) primer combinations used to characterize Turkish olives. Locus EM1-ME4 EM3-ME13 EM3-ME14 EM6-ME13 EM7-ME1 EM8-ME8 EM9-ME16 EM11-ME2 EM11-ME11 EM12-ME8 EM12-ME9 EM12-ME13 EM13-ME7 †
No. of alleles
Average PIC† ± SE
Range of PIC values
14 9 5 21 10 7 7 4 1 6 9 8 2
0.23 ± 0.04 0.33 ± 0.05 0.24 ± 0.08 0.29 ± 0.03 0.22 ± 0.04 0.33 ± 0.05 0.22 ± 0.07 0.06 ± 0.06 0.20 ± 0 0.40 ± 0.21 0.16 ± 0.06 0.27 ± 0.03 0.24 ± 0.13
0.03–0.43 0.03–0.49 0.08–0.49 0.02–0.49 0.05–0.43 0.02–0.48 0.02–0.47 0.03–0.16 0.20 0.28–0.48 0.26–0.49 0.17–0.45 0.06–0.43
PIC, polymorphism information content.
Mediterranean region. The remaining four clusters (C to F) had two or three varieties each with a maximum similarity of 0.71 in these clusters. Interestingly, cluster F consisted of varieties from the Aegean region and these three varieties (‘Memeli’ [genotype 51], ‘Domat’ [64], and ‘Kiraz’ [65]) had nearly as much genetic diversity (0.57) as the European varieties, which originated from three different countries. Principal component analysis (PCA) of the SSR data indicated that the first Eigen vector explained 49.5% of the genotypic variance while the second and third vectors accounted for only ~3% of the variance each. The PCA plot (Supplementary Fig. S1) showed that the European outgroups clustered away from the Turkish varieties. The Turkish varieties formed a fairly uniform cluster with a few varieties plotted away from the main group. These more diverse varieties included ‘Erdek Yağlık’ (genotype 10), ‘Otur’ (4), ‘Eğriburun’ (35), Domat (64), and Kiraz (65). These last three varieties also clustered away from the main groups in the dendrogram.
Sequence-Related Amplified Polymorphism Characterization The 13 SRAP primer combinations yielded 185 alleles with 55.7% polymorphism (103 alleles). The number of alleles per primer combination ranged from 1 (EM11-ME11) to 21 (EM6-ME13) with an average of 7.9 alleles per primer combination (Table 4). EM12-ME8 had the maximum average PIC value, 0.401, while EM11-ME2 gave the lowest average PIC value, 0.063. Overall, the SRAP markers had an average PIC value of 0.24. When compared by origin, PIC values were highest for the Southeast Anatolian and Marmara olives (0.23 and 0.21, respectively) and significantly lower for the varieties from the other three regions (Table 3). The UPGMA dendrogram based on the SRAP data had a good fit (r = 0.83) with the Dice distance matrix. Overall, genetic similarity coefficients were higher than for the SSR CROP SCIENCE, VOL. 51, JULY– AUGUST 2011
data and ranged between 0.66 and 0.96 for the Turkish varieties (Fig. 3). According to the dendrogram Turkish olive accessions formed seven clusters at a similarity coefficient of 0.82. The largest group, cluster A, contained 43 varieties while the remaining 18 varieties clustered in six groups, each containing two to five individuals. The five remaining varieties did not fall into these clusters at a genetic similarity of 0.82. Cluster A was composed of three subgroups. Cluster A1 had a minimum genetic similarity of 0.85 and included varieties from the Black Sea and Marmara regions in one group (A1a) and Mediterranean and Aegean varieties in two separate clusters (A1b and A1c, respectively). Cluster A1b contained the two most similar varieties based on SRAP analysis: Celebi (genotype 18) and ‘Sari Hasebi’ (20), which were 0.96 genetically similar. Cluster A2 included Aegean varieties and only one Mediterranean variety. The remaining clusters (B to G) also showed some grouping by region. For example, cluster F contained only Aegean varieties while cluster G only had Southeast Anatolian varieties. The most distant variety was ‘Esek Zeytini’ (genotype 12), which did not cluster with any other accessions. Principal component analysis of the SRAP data indicated that the first Eigen vector explained 56.5% of the genotypic variance while the second and third vectors accounted for only ~4% of the variance each. The PCA plot (Supplementary Fig. S2) showed that many of the Turkish varieties formed a fairly tight group. However, several Aegean and Southeast Anatolian varieties plotted away from this main group including ‘Iri Yuvarlak’ (genotype 36), ‘Yun Celebi’ (33), ‘Hursuki’ (40), and Kiraz (65). Esek Zeytini (genotype 12) and ‘Karamani’ (23) were the only Marmara and Mediterranean varieties, respectively, that plotted away from the main group.
DISCUSSION In this study, two types of molecular markers were used to assess genetic diversity in Turkish olive varieties. The selected SSRs had very good polymorphism in the analyzed Turkish germplasm. Other studies with olive have also shown good polymorphism with SSR markers (Belaj et al., 2003; Baldoni et al., 2006; Taamalli et al., 2007; Doveri et al., 2008; Muzzalupo et al., 2008). The SSR markers were more polymorphic than the SRAP markers with PIC values of 0.29 and 0.24, respectively. This was expected as the SSRs were identified in genomic DNA (Sefc et al., 2000; Cipriani et al., 2002; De la Rosa et al., 2002; Carriero et al., 2002) and therefore probably localized in noncoding and repetitive portions of the genome that are rapidly evolving. In contrast, SRAP markers specifically target the junctions between exons and introns or promoters in open reading frames (Li and Quiros, 2001). Although these areas are expected to be more variable than other ORF regions, they are usually not as polymorphic as noncoding DNA. Simple sequence repeats are also reported to have higher polymorphism than amplified fragment length polymorphism (AFLP) and random amplified polymorphic DNA (RAPD) markers in olive (Belaj et al., 2003).
WWW.CROPS.ORG
1651
1652
WWW.CROPS.ORG
CROP SCIENCE, VOL. 51, JULY– AUGUST 2011
Figure 3. Sequence-related amplified polymorphism (SRAP)-based unweighted pair group method with arithmetic means (UPGMA) dendrogram of the 66 Turkish olive varieties based on 103 SRAP alleles.
The variability of SSRs is due to their high mutation frequency (Milbourne et al., 1997). Because SSRs are repetitive DNA, they are highly susceptible to replication slippage and unequal crossover. These mutational mechanisms are thought to be more common than the single nucleotide and indel mutations that are responsible for polymorphism in other marker systems. As a result, SSRs are expected to be more powerful than these other systems for discriminating among varieties. Indeed, because the SSR markers were more polymorphic, they revealed a greater level of genetic diversity in the Turkish olive varieties than the SRAP markers. Thus, minimum genetic similarity among the varieties was 0.45 as determined using SSRs and 0.66 as determined using SRAPs. Despite this difference, which was expected based on marker type, both SSR and SRAP markers indicated substantial genetic diversity in Turkish olives. This is perhaps best exemplified by the fact that the Turkish olives encompassed more genetic diversity than the European outgroup varieties, which originated from three different countries. Although there were differences in polymorphism content and only a low correlation between the SSR- and SRAP-based distances matrices (r = 0.227 as determined by a Mantel test), genetic distance data from both marker types resulted in similar dendrograms. For example, when the SRAP-based dendrogram was compared with the SSR-based dendrogram, 84% (36 of 43) of the varieties that fell in the largest cluster (A) in the SRAP dendrogram had similar placement in the most closely related clusters (A and B) of the SSR dendrogram. Moreover, the most distantly related varieties in the SRAP dendrogram were also the most distant related Turkish varieties in the SSR dendrogram. In the SSR dendrogram, the European varieties clustered outside of the Turkish ones. Turkish accessions also clustered away from Western Mediterranean and Greek germplasm in previous studies (Belaj et al., 2003; Owen et al., 2005; Sarri et al., 2006; Roubos et al., 2010). Our results agree with the diverse genetic character of Turkish germplasm seen in these other studies and indicate that Turkey houses a broad diversity of cultivated olive germplasm. Turkey and the entire Eastern Mediterranean region are believed to be a primary or secondary center of olive domestication (Sarri et al., 2006; Zohary and Spiegel-Roy, 1975). As such, these areas are expected to be rich in both cultivated and wild types. Moreover, because olive varieties are developed by local selection (Rotondi et al., 2003) and olives are grown in several different climatic regions in Turkey, genetic diversity is expected to be high as observed by our molecular marker analyses. According to Owen et al. (2005) the apparent genetic distinctness of Turkish olive varieties indicates that Turkish germplasm should be more thoroughly characterized and carefully preserved. Both SSR and SRAP marker data showed the highest level of molecular genetic diversity in Southeast Anatolian and Marmara varieties. Both marker systems gave the same relative ranking of genetic polymorphism by region with the Black Sea varieties having the least diversity and Aegean and CROP SCIENCE, VOL. 51, JULY– AUGUST 2011
Mediterranean olives having intermediate levels of polymorphism. There was also some origin-specific clustering in the dendrograms suggesting similarity among varieties from the same region. However, each region also had varieties that grouped away the origin-specific clusters indicating that all of the regions had varieties with considerable genetic diversity. As with other crops, local olive varieties are often named based on their morphological appearance. Thus, Kiraz, which means “cherry” in Turkish, was probably named because its fruit is round and cherry-red when ripe. Others are named based on their use and/or location such as ‘Trabzon Yaglik’ and ‘Samsun Yaglik’, both of which are used for their oil and are grown in two different Black Sea provinces. Although these names may reflect morphological or other similarities, our results show that such similarities do not correspond to molecular genetic similarity. For example, two Egriburun (genotypes 34 and 35) varieties were analyzed, both of which are from the South Anatolian region. Despite their identical names and similar geographical origins, these varieties had a genetic similarity value of only 0.45. Similarly, the two Celebi (genotypes 15 and 18) and two ‘Tasarasi’ (61 and 62) varieties had similarity values of 0.54 and 0.52, respectively. Thus, genetically distinct but homonymous (or similarly named) olive varieties are not uncommon in Turkey. Previously, several accessions of ‘Derik Halhali’ olive from Mardin, Turkey, were characterized using RAPD markers and found to be molecularly and morphologically different (Ozkaya et al., 2006). Thus, the results obtained in this research reinforce the importance of thorough morphological and molecular genetic characterization of Turkish olive varieties. In conclusion, Turkish olive varieties were genetically characterized with two different marker systems. Both marker systems gave similar results and were found to be effective for further characterization of Turkish olive germplasm. The results showed that Turkey harbors considerable molecular genetic diversity for olive and suggest that Turkish varieties are distinct from European ones. Moreover, varieties from the same region showed some genetic similarity and certain regions of Turkey were richer in genetic diversity than others. The results of this work should be useful for future germplasm collection and maintenance as well as guide the selection of parents for olive improvement.
Supplemental Information Available Supplemental material is available free of charge at http:// www.crops.org/publications/cs. Acknowledgments We thank the Ministry of Agriculture and Rural Affairs General Directorate of Agricultural Research Institutes for providing olive samples. This research was supported by The Scientific and Technological Research Council of Turkey (TUBITAK TEYDEP project no. 3060450). We are grateful to Dr. Amy Frary for helpful comments on the manuscript.
WWW.CROPS.ORG
1653
References Aranzana, M.J., A. Pineda, P. Cosson, E. Dirlewanger, J. Ascasibar, G. Cipriani, D. Ryder, R. Testolin, A. Abbott, G.J. King, A.F. Iezzoni, and P. Arús. 2003. A set of simple-sequence repeat (SSR) markers covering the Prunus genome. Theor. Appl. Genet. 106:819–825. Baldoni, L., N. Tosti, C. Ricciolini, A. Belaj, S. Arcioni, G. Pannelli, M.A. Germana, M. Mulas, and A. Porceddu. 2006. Genetic structure of wild and cultivated olives in the central Mediterranean basin. Ann. Bot. (London) 98:935–942. doi:10.1093/aob/mcl178 Belaj, A., Z. Satovic, G. Cipriani, L. Baldoni, R. Testolin, L. Rallo, and I. Trujillo. 2003. Comparative study of the discriminating capacity of RAPD, AFLP and SSR markers and of their effectiveness in establishing genetic relationships in olive. Theor. Appl. Genet. 107:736–744. doi:10.1007/s00122-003-1301-5 Besnard, G., P. Baradat, and A. Bervillé. 2001. Genetic relationships in the olive (Olea europaea L.) reflect multilocal selection of cultivars. Theor. Appl. Genet. 102:251–258. doi:10.1007/ s001220051642 Bracci, T., M. Busconi, C. Fogher, and L. Sebastiani. 2010. Molecular studies in olive Olea europaea L.): Overview on DNA marker applications and recent advances in genome analysis. Plant Cell Rep. 10.1007/s00299–010–0991–9. Carriero, F., G. Fontanazza, F. Cellini, and G. Giorio. 2002. Identification of simple sequence repeat (SSRs) in olive (Olea europaea L.). Theor. Appl. Genet. 104:301–307. doi:10.1007/ s001220100691 Cipriani, G., M.T. Marrazzo, R. Marconi, A. Cimato, and R. Testolin. 2002. Microsatellite markers isolated in olive (Olea europaea L.) are suitable for individual fi ngerprinting and reveal polymorphism within ancient cultivars. Theor. Appl. Genet. 104:223–228. doi:10.1007/s001220100685 De la Rosa, R., C.M. James, and K.R. Tobutt. 2002. Isolation and characterization of polymorphic SSRs in olive (Olea europaea L.) and their transferability to other genera in the Oleaceae. Mol. Ecol. Notes 2:265–267. doi:10.1046/j.14718286.2002.00217.x Dice, L.R. 1945. Measures of the amount of ecologic association between species. Ecology 26:297–302. doi:10.2307/1932409 Doveri, S., and L. Baldoni. 2007. Olive. In C. Kole (ed.) Genome mapping and molecular breeding in plants: Fruits and nuts. Springer-Verlag, Berlin, Germany. Doveri, S., F. Sabino Gil, A. Diaz, S. Reale, M. Busconi, A. da Camara Machado, A. Martin, C. Fogher, P. Donini, and D. Lee. 2008. Standardization of a set of microsatellite markers for use in cultivar identification studies in olive (Olea europaea L.). Sci. Hortic. (Amsterdam) 116:367–373. doi:10.1016/j.scienta.2008.02.005 FAOSTAT. 2009. Production of crops. Available at http://faostat. fao.org/site/567/default.aspx#ancor (verified 9 May 2011). FAO, Rome, Italy. Grigg, D. 2001. Olive oil, the Mediterranean and the world. GeoJournal 53:163–172. doi:10.1023/A:1015702327546 Li, G., and C.F. Quiros. 2001. Related amplified polymorphisms (SRAP), a new marker system based on a simple PCR reaction: Its application to mapping and gene tagging in Brassica. Theor. Appl. Genet. 103:455–461. doi:10.1007/ s001220100570 Loumou, A., and C. Giourga. 2003. Olive groves: The life and identity of the Mediterranean. Agric. Human Values 20:87– 95. doi:10.1023/A:1022444005336
1654
Mantel, N. 1967. The detection of disease clustering and a generalized regression approach. Cancer Res. 27:209–220. Milbourne, D., R. Meyer, J.E. Bradshaw, E. Baird, N. Bonar, J. Provan, W. Powell, and R. Waugh. 1997. Comparison of PCR-based marker systems for the analysis of genetic relationships in cultivated potato. Mol. Breed. 3:127–136. doi:10.1023/A:1009633005390 Muzzalupo, I., N. Lombardo, A. Salimonti, M.A. Caravita, M. Pellegrino, and E. Perri. 2008. Molecular characterization of Italian olive cultivars by microsatellite markers. Adv. Hort. Sci. 22:142–148. Owen, C.A., E.C. Bita, G. Banilas, and S.E. Hajjar. 2005. AFLP reveals structural details of genetic diversity within cultivated olive germplasm from the Eastern Mediterranean. Theor. Appl. Genet. 110:1169–1176. doi:10.1007/s00122-004-1861-z Ozkaya, M.T., E. Cakir, Z. Gokbayrak, H. Ercan, and N. Taskin. 2006. Morphological and molecular characterization of Derik Halhali olive (Olea europaea L.) accessions grown in Derik–Mardin province of Turkey. Sci. Hortic. (Amsterdam) 108:205–209. doi:10.1016/j.scienta.2006.01.016 Rohlf, F.J. 2004. NTSYS-pc numerical taxonomy and multivariate analysis system. Version 2.11V. Exeter software, Setauket, NY. Roldan-Ruiz, I., J. Dendaw, E. Van Bockstael, A. Depicker, and M. De Loose. 2000. AFLP markers reveal high polymorphic rates in ryegrasses (Lolium spp.). Mol. Breed. 6:125–134. doi:10.1023/A:1009680614564 Rotondi, A., M. Magli, C. Ricciolini, and L. Baldoni. 2003. Morphological and molecular analyses for the characterization of a group of Italian olive cultivars. Euphytica 132:129–137. doi:10.1023/A:1024670321435 Roubos, K., M. Moustakas, and F.A. Aravanopoulos. 2010. Molecular identification of Greek olive (Olea europaea) cultivars based on microsatellite loci. Genet. Mol. Res. 9:1865– 1876. doi:10.4238/vol9-3gmr916 Saghai-Maroof, M.A., K.M. Soliman, R.A. Jorgensen, and R.W. Allard. 1984. Ribosomal DNA spacer-length polymorphisms in barley: Mendelian inheritance, chromosomal location, and population dynamics. Proc. Natl. Acad. Sci. USA 81:8014– 8018. doi:10.1073/pnas.81.24.8014 Sarri, V., L. Baldoni, A. Porceddu, and N.G. Cultrera. 2006. Microsatellite markers are powerful tools for discriminating among olive cultivars and assigning them to geographically defined populations. Genome 49:1606–1615. doi:10.1139/G06-126 Sefc, K.M., M.S. Lopes, D. Mendonca, S.M. Dos Rodrigues, M.M. Da Camara Laimer, and A. Machado. 2000. Identification of microsatellite loci in olive (Olea europaea) and their characterization in Italian and Iberian olive trees. Mol. Ecol. 9:1171–1193. doi:10.1046/j.1365-294x.2000.00954.x Taamalli, W., F. Geuna, S.B. Temime, D. Bassi, D. Daoud, and M. Zarrouk. 2007. Using microsatellite markers to characterise the main Tunisian olive cultivars Chemlali and Chetoui. J. Hortic. Sci. Biotechnol. 82:25–28. Visioli, F., A. Poli, and C. Galli. 2002. Antioxidant and other biological activities of phenols from olives and olive oil. Med. Res. Rev. 22:65–75. doi:10.1002/med.1028 Zietkiewicz, E., A. Rafalski, and D. Labuda. 1994. Genome fi ngerprinting by simple sequence repeat (SSR)-anchored polymerase chain reaction amplification. Genomics 20:176–178. doi:10.1006/geno.1994.1151 Zohary, D., and P. Spiegel-Roy. 1975. Beginnings of fruit growing in the Old World. Science 187:319–327. doi:10.1126/science.187.4174.319
WWW.CROPS.ORG
CROP SCIENCE, VOL. 51, JULY– AUGUST 2011