Vol. 12(41), pp. 5983-5993, 9 October, 2013 DOI: 10.5897/AJB2013.12916 ISSN 1684-5315 ©2013 Academic Journals http://www.academicjournals.org/AJB
African Journal of Biotechnology
Full Length Research Paper
Genetic stability of mulberry germplasm after cryopreservation by two-step freezing technique Ravish Choudhary*, Rekha Chaudhury, S. K. Malik, Susheel Kumar and Digvender Pal Tissue Culture and Cryopreservation Unit, National Bureau of Plant Genetic Resources (NBPGR), 110 012, New Delhi. Accepted 23 September, 2013
Genetic stability of Morus alba, Morus indica, Morus laevigata (indigenous collection) and Morus species (exotic collection) have been studied in in vitro regenerated plants of mulberry (fresh, before and after cryopreservation) using random amplified polymorphic DNA (RAPD) and inter simple sequence repeat (ISSR) markers. This study examined the genetic stability of cryopreserved dormant buds of Morus germplasm that were stored in liquid nitrogen using two-step freezing, then rewarmed and regrown. Dormant buds of mulberry collected during winter period were found suitable for the cryopreservation in liquid nitrogen. In the present study, the plants were regenerated directly from dormant buds (before and after cryopreservation) without intermediary callus phase. These regenerants thus bear low risk of genetic instability. Both the single primer amplification reaction (SPAR) markers showed reproducible and well resolved banding patterns in mulberry germplasm, in which RAPD marker generated a total of 201 bands based on 15 primers; however, ISSR markers were given 145 bands using 11 primers. Both markers showed monomorphic banding patterns and did not reveal any polymorphism among the mother plant and in vitro regenerants before and after cryopreservation, suggesting that cryopreservation, using two-step freezing, does not affect genetic stability of mulberry germplasm. The transitory nature of these polymorphisms should be carefully considered when monitoring for genetic stability. Key words: Cryopreservation, Genetic stability, in vitro culture, ISSR, mulberry, RAPD.
INTRODUCTION Mulberry (Morus spp.) belongs to the family ‘Moraceae’, a family of deciduous or evergreen trees and shrubs, mostly of pantropical distribution and characterized by milky sap. The origins of most cultivated mulberry varieties are believed to be in the Himalayan foothills by the evidences gathered from fossils (Collinson, 1989), morphology, anatomy (Benavides et al., 1994; Hou, 1994) and molecular biological (Zerega et al., 2005) covering both temperate and sub-tropical regions of Northern hemisphere (Anonymous, 2006) and later spread to major continents including Asia, Europe, North and South America, and Africa (Machii et al., 1999).
Sanjappa (1989) recognized 68 species within the genus Morus, out of which, M. alba, M. indica, M. nigra, M. latifolia, M. multiculis are cultivated for silkworm rearing, M. rubra and M. nigra for fruits (Yaltirik, 1982) and M. laevigata and M. serrata for timber (Tikader and Vijayan, 2010). Cultivation of mulberry and silkworm rearing started in China before 2200 BC (FAO, 1990) and currently mulberry is cultivated in almost all Asian countries (Vijayan et al., 2011). In India, four main species of Morus, namely, M. alba, M. indica, M. laevigata and M. serrata have been reported (Hooker, 1885; Tikader and Dandin, 2005; Vijayan, 2010).
*Corresponding author. E-mail:
[email protected]. Tel: +91-011-25848955. Fax: +91-011-25842495.
5984
Afr. J. Biotechnol.
Table 1. List of samples of Morus species used for genetic stability.
S/N 1 2 3 4 5 6 7 8 9 10
Sample no. M1-A*, M1-B**, M1-C*** M2-A*, M2-B**, M2-C*** M3-A*, M3-B**, M3-C*** M4-A*, M4-B**, M4-C*** M5-A*, M5-B**, M5-C*** M6-A*, M6-B**, M6-C*** M7-A*, M7-B**, M7-C*** M8-A*, M8-B**, M8-C*** M9-A*, M9-B**, M9-C*** M10-A*, M10-B**, M10-C***
Collector no. MI-0583 ME-0051 MI-0622 RC-03 RC-02 ME-0087 MI-0698 RC-01 ME-0099 MI-0678
Species Morus laevigata Morus sp. Morus indica Morus indica Morus laevigata Morus sp. Morus alba Morus alba Morus sp. Morus alba
*Fresh leaf samples, **in vitro regenerated samples before cryopreservation and *** after cryopreservation
Tissue culture with its distinct advantages is used for short-term preservation (Withers and Engelmann, 1997) but it does not serve for long-term preservation. Hence, cryopreservation only economically viable method is adopted for long-term preservation. Under cryopreservation, plant materials are stored at ultra-low temperatures in liquid nitrogen (-196°C). At this temperature, cell division and metabolic activities remain suspended and the material remains unchanged for a long period. Thus, cryopreservation ensures genetic stability of the mulberry germplasm besides requiring only limited space and protecting material from contamination. In mulberry, the most appropriate material for cryopreservation is the winter bud (Fukui et al., 2011; Rao et al., 2009), in vitrogrown shoot apices in Morus species (Gupta, 2011; Padro et al., 2012) and M. bombicys (Yakuwa and Oka, 1988), though embryonic axes, pollen, synthetic seeds can also be used (Niino, 1995). The survival rates of winter buds stored in liquid nitrogen up to three to five years did not change significantly (Rao et al., 2009). Either prefreezing at -10 or -20°C along with rapid thawing at 37°C or pre-freezing at -20 or -30°C along with slow thawing at 0°C was a suitable treatment for high percentages of survival and shoot regeneration (Rao et al., 2007). It is desirable to assess the genetic integrity of the germplasm of micropropagated plantlets with that of field plants and plants regenerated after surviving cryogenic (-196°C) storage to determine if they are true-to-type after cryopreservation. The most commonly used marker systems for genetic stability study are Random Amplified Polymorphic DNA (RAPD) (Srivastava et al., 2004), amplified fragment length polymorphism (AFLP) (Wang and Yu, 2001), and inter-simple sequence repeat (ISSR) (Vijayan et al., 2005, 2006; Zhao et al., 2006). The application of RAPD and ISSR for the characterization of genetic stability has been well documented in Morus species (Rao et al., 2007, 2009; Vijayan, 2004; Vijayan and Chaterjee, 2003; Vijayan et al., 2004, 2005).
In the present study, the genetic stability of the in vitro regenerated plants of mulberry (fresh, before and after cryopreservation) was analysed through the RAPD and ISSR markers using 10 mulberry germplasm. MATERIALS AND METHODS Dormant buds of different Morus species were collected from the field genebank of Central Sericultural Germplasm Resources Centre (CSGRC), Hosur, Tamil Nadu (Table 1). Three accessions were collected from bio-diversity garden of National Bureau of Plant Genetic Resources (NBPGR), New Delhi. Buds attached to twigs wrapped in cotton bags were air lifted to cryolab at NBPGR reaching within 48 h of harvesting. After receipt, the twigs were wrapped in polyethene bags and kept in refrigerator at 10 to 15°C temperature and used for experimentation within 25 days of harvest. Cryopreservation using two-step freezing Descaled buds of mulberry were tied in muslin cloth and put in charged silica gel for 4 to 7 h at room temperature for desiccation. The desiccated buds were packed in 1.0 ml polypropylene cryovials. These vials were shifted sequentially at 5, -5, -10, -15, 20, -25 and -30°C keeping at each of the temperatures for a minimum of 24 h. The cryovials were held at -30°C for 48 h and then directly plunged in the liquid nitrogen at -196°C. Cryopreserved buds were thawed by slow thawing and transferred in sterile moist moss for rehydration. The viability of fresh, desiccated and cryopreserved dormant buds of Morus species was tested in vitro culturing method. For recovery growth of the cryostored dormant buds, 1 to 2 outer scales of the rehydrated buds were further removed followed by washing with Tween 20 for 15 min. Tween 20 was rinsed off with running tap water. These buds were then surface sterilized with 0.1% mercuric chloride for 9 min, rinsed three times with sterile water washes using autoclaved distilled water (5 min each). The sterilized buds were cultured on basal MS medium (Murashige and Skoog, 1962) with 3% sucrose (w/v) and solidified with 0.8% agar. MS medium was supplemented with 1 mgl-1 BAP initially for bud sprouting. The cultures raised from cryopreserved buds were maintained in culture room in dark for seven days. After dark incubation, these cultures were shifted in diffused light for 3 days. After 10 days of culturing, these cultures were exposed
Choudhary et al.
to normal culture room light intensity (3000 lux/ 36 µ mol -1 sec2). The sprouted buds were sub-cultured on the MS medium supplemented with 1.0 mgl-1 BAP and 0.2 mgl-1 GA3 for elongation. The elongated plants were further sub-cultured and transferred to multiplication medium (0.5 mgl-1 BAP + 0.5 mgl-1 Kn + 0.1 mgl-1 IAA) and finally transferred to rooting medium (half MS + 0.5 mgl-1 IBA). Fresh leaf tissues of these mulberry samples were cleaned with water, air dried and stored in -80°C refrigerator for further experiments (Table 1).
DNA isolation Total genomic DNA was isolated from leaf tissues using the cetyl trimethyl ammonium bromide method with few modifications (Doyle and Doyle, 1990). DNA concentration was determined spectrophotometrically at 260 nm. Quality of genomic DNA was determined through electrophoresis on 0.8% agarose gel.
RAPD-PCR amplification The RAPD primers of Operon Technologies Alameda, CA, USA were used for molecular analysis. A total of 40 primers were screened in Morus species, of which 15 primers were selected for final profiling based on banding patterns and reproducibility. The basic protocol of RAPD-PCR reported by William et al. (1990) was followed for PCR amplification in a total reaction volume of 15 ml, containing 10 mM Tris-HCl, 50 mM KCl, 1.5 mM MgCl2, 0.6 U Taq DNA polymerase (Life Tech, India), 0.2 mM of dNTP each, 10 pmoles of RAPD primer and 20 ng of DNA template. DNA amplification was carried out in a PTC-200 TM thermocycler and the thermal cycler conditions for PCR reactions were an initial denaturation cycle for 3 min at 94°C followed by 40 cycles comprising 1 min at 94°C, 1 min at 35°C and 2 min at 72°C. An additional cycle of 5 min at 72°C was used for final extension. Amplification products were separated by electrophoresis in 1.8% agarose gels and stained in ethidium bromide. A photographic record was taken under UV gel doc system (Alpha Innotech, USA). ISSR-PCR amplification A total of hundred primers of University of British Columbia (UBC) procured from Geno Biosciences Pvt. Ltd. were used for ISSR-PCR optimization trials. Eleven primers, which gave the best amplification results with the sample DNA, were selected for final ISSR-PCR analysis. PCR-amplification was carried out in 25 μl reaction volume containing 10 mM Tris HCl (pH 8.3), 50 mM KCl, 1.0 to 2.5 mM MgCl2, 0.2 mM dNTP each, 1.0 U Taq DNA polymerase (Bangalore Genie, India), 0.2 μM primer and 20 ng genomic DNA. The amplification was performed in a PTC-200 thermocycler (MJ Research, Massachusetts, USA), with reaction conditions programmed as initial pre-denaturation at 94°C for 4 min followed by 35 cycles of denaturation at 94°C for 1 min, annealing at 50°C for 1 min, and extension at 72°C for 2 min and final extension at 72°C for 7 min. Amplification products were separated by electrophoresis on 1.5% agarose gel stained with ethidium bromide, and bands were visualized and documented in UV gel doc system (Alpha Innotech Corporation). Data analysis Amplified bands were scored as present (1) or absent (0) homologous bands across all the accessions studied. Molecular weight of the amplified bands was estimated using 1 kb DNA ladder (Gibco BRL Life Technologies, NY, USA) as a standard. A pairwise
5985
similarity matrix of all the accessions was estimated based on Jaccard’s coefficient (Jaccard, 1908) and a dendrogram was generated based on the unweighted pair-group method for arithmetic mean (UPGMA) using the software NTSYS version 2.10e (Rohlf, 2000). Principal component analysis was also carried out to study relationships among accessions using the same software. The test for association was conducted based on two-way Mantel test (Mantel, 1967).
RESULTS The genetic stability of the fresh, in vitro raised plants before and after cryopreservation was studied through the ISSR and RAPD markers using 10 mulberry accessions comprising four different species of Morus (Table 1). The PCR amplification products of control (unfrozen) in vitro and cryopreserved (frozen in liquid nitrogen) samples were plotted together for comparison.
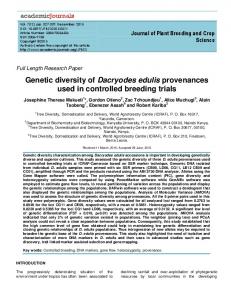
Genetic stability analysis in mulberry RAPD analysis Fifteen (15) primers were selected for the RAPD analysis based on the reproducibility and banding patterns. A total of 201 bands were generated from 15 RAPD primers, of which 169 bands were polymorphic (84.08%) with an average of 11.27 polymorphic bands per primer. The fragment size ranged from 200 to 3000 bp (Table 2). A representative gel profiles generated using primers OPA02 and OPA-04 are shown in Figure 1. Each primer amplified at a range of 4 to 20 bands with an average of 13.40 bands per primer. OPA-02 primer amplified the maximum number of 20 bands, whereas OPA-10 primer generated the minimum of 4 bands. The polymorphism percentage ranged from 53.85 (primer OPE-03) to 100% (OPA-06 and OPA-11) with an average of 84.08% polymorphism (Table 2). Pattern of distribution of amplified bands across all the accessions revealed that some primers generated unique bands, namely OPA-02 in M1 (400 bp in M. laevigata) or M4 (2200 bp in M. indica), OPA-04 in M1 (870 bp in M. laevigata), OPA-06 in M1 (750 bp in M. laevigata), OPA-13 in M4 (650 bp in M. indica), OPA-17 in M1 (250 bp in M. laevigata), OPA18 in M9 (870 bp in Morus sp), and OPE-04 amplified a single fragment in M9 (2000 bp in Morus sp). A pairwise Jaccard’s similarity values ranged from 0.37 to 0.83 (average 0.60) among the 10 accessions of mulberry (Table 3). A maximum similarity value of 0.83 was observed between M1 and M5 samples (both belong to M. laevigata), whereas M2 and M9 (Morus sp) showed least similarity coefficient of 0.37. All the three samples (fresh, in vitro raised before and after cryopreservation) of each Morus species showed 100% similarity among the treatments. A dendrogram generated based on UPGMA method grouped all the 10 accessions into two major clusters
5986
Afr. J. Biotechnol.
Table 2. Details of the RAPD and ISSR primers, their sequence and number of amplified bands used in analysis of Morus species.
a
Primer OPA01 OPA02 OPA04 OPA06 OPA08 OPA09 OPA10 OPA11 OPA13 OPA17 OPA18 OPC02 OPE03 OPE04 OPE20
Sequence (5’-3’) CAGGCCCTTC TGCCGAGCTG AATGGGGCTG GGTCCCTGAC GTGACGTAGG GGGTAACGCC GTGATCGCAG CAAATCGCCGT CAGCACCCAC GACCGCTTGT AGGTGACCGT GTGAGGCGTC CCAGATGCAC GTGACATGCC AACGGTGACC
UBC-807 UBC-808 UBC-810 UBC-811 UBC-812 UBC-825 UBC-827 UBC-841 UBC-855 UBC-858 UBC-864
ISSR AGAGAGAGAGAGAGAGT AGAGAGAGAGAGAGAGG GAGAGAGAGAGAGAGAT GAGAGAGAGAGAGAGAC GAGAGAGAGAGAGAGAA ACACACACACACACACT ACACACACACACACACG GAGAGAGAGAGAGAGAYC ACACACACACACACACYT TGTGTGTGTGTGTGTGRT ATGATGATGATGATGATG
Total no. of bands 12 20 18 08 12 13 04 09 17 13 15 17 13 15 15 201
PBa 10 16 15 08 11 13 03 09 15 12 12 14 07 11 13 169
PPBb 83.33 80.00 83.33 100.00 91.67 100.00 75.00 100.00 88.23 92.31 80.00 82.35 53.85 73.33 86.67 84.08
Unique bands 0 2 1 1 0 0 0 0 1 1 1 0 0 1 0 8
Range of fragment size (bp) 550-1500 400-2500 500-3000 650-920 450-2000 500-2000 450-950 570-1000 250-1400 250-1400 200-2500 300-2500 350-2000 350-2000 350-2500
16 12 14 11 15 12 14 15 15 11 11 146
16 12 11 07 14 11 14 14 14 11 10 134
100.00 100.00 78.57 63.63 93.33 91.67 100.00 93.33 93.33 100.00 90.90 91.78
1 1 1 1 1 0 0 0 1 2 0 8
200-1100 350-990 200-1000 370-960 300-1140 375-2000 400-1100 300-2000 250-1100 300-1000 200-1100
b
Total Polymorphic Bands; Percentage of polymorphic bands
(Figure 2A). First cluster was the largest one and divided into two sub-clusters (II-a and II-b). Sub-cluster II-a, again sub-divided into II-a1 and II-a2 group. II-a1 group comprising 03 samples, namely, M1 (M. laevigata), M5 (M. laevigata) and M6 (Morus sp.). Within this cluster, the M1 and M5 showed 83% genetic similarity. Group II-a2 comprised of three samples naming M2 (Morus sp.), M3 (M. indica) and M4 (M. indica) in which, M3 and M4 were closely related with similarity value of 0.81. Sub-cluster IIb comprised of three samples namely, M7, M8 and M10 (all belong to M. alba) in which, M7 and M8 were closely related with similarity value of 0.75. Second cluster consisted only one sample M9 (Morus sp.) which was distinct from all other samples with similarity value of 0.46. Based on Mantel Z-statistics (Mantel, 1967), the correlation coefficient (r) was estimated to be 0.77. 2-D (Figure 2B) generated from PCOA of RAPD data was also in coherence with the clustering pattern of UPGMA
dendrogram. First and second principal components accounted for 27.93 and 17.26%, respectively of the total variation.
ISSR analysis Eleven primers were selected for the ISSR analysis based on the reproducibility and banding patterns. A total of 146 bands were generated, of which 134 bands were polymorphic (91.78%). Each primer amplified 7 to 16 polymorphic bands with an average of 12.18 bands per primer (Table 2). UBC-807 primer amplified the maximum number of 16 bands, whereas UBC-811 amplified the lowest number of polymorphic bands 7. The polymerphism percentage ranged from 63.63 (primer UBC-811) to 100% (UBC-807, UBC-808, UBC-827 and UBC-858). Average polymorphism across all the 10 accessions was
Choudhary et al.
5987
Figure 1. Gel profiles of the 10 mulberry accessions (ten control and ten in vitro regenerated samples before and after cryopreservation) generated with the RAPD primers: [A] OPA-2 and [B] OPA-4. M is the λ DNA marker. Arrows shows the unique band in red circle.
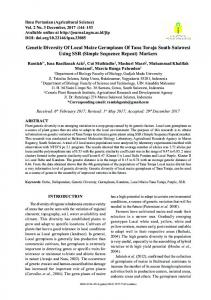
91.78%. Overall size of the PCR amplified fragments ranged from 200 to 2000 bp (Table 2). Pattern of distribution of bands across all accessions of mulberry revealed that the primer UBC-807 (1100 bp for M. alba), UBC-808 (990 bp for M. laevigata), UBC-810 (1000 bp M. alba), UBC-811 (960 bp for M. laevigata), UBC-812 (1000 bp for M. laevigata), UBC-855 (1100 bp for M. alba) and UBC-858 (300 bp for M. laevigata and 1000 bp for Morus sp.) amplified a unique DNA fragment which distinguished one species from the others (Figure 3). All cryopreserved and fresh samples showed 100% similarity among the treatments (fresh, in vitro raised before and after cryopreservation). A pairwise similarity values among all the 10 accessions of mulberry ranged from 0.41 to 0.97 (Table 4). The maximum similarity of 0.97 was observed between M3 (M. indica) and M4 (M. indica) accessions and showed close genetic similarity, whereas M9 (Morus sp.) showed least similarity coefficient of 0.41 with M1 and M5 (M. laevigata). Average similarity across all the cultivars was 0.69. In the dendrogram, all the 10 accessions were grouped into three major clusters (Figure 4A). First cluster comprised of two accessions, namely M1 and M5 (both are M. laevigata) which were closely related with similarity value of 0.95. Second cluster was again divided into two sub-clusters (II-a and II-b). Sub-cluster II-a was the biggest comprising of the 4 accessions namely M2,
M3, M4 and M6, in which M3 and M4 (both M. indica) were genetically most similar showing 97% similarity. The sub-cluster II-b comprised of three accessions that is, M7, M8 and M10 (all M. alba), in which, M7 and M10 were showing 98% genetic similarity to each other. In the third cluster, while M9 (Morus sp.) was diverse from other samples of this cluster with similarity value of 0.49. Based on Mantel Z-statistics (Mantel, 1967), the correlation coefficient (r) was estimated to be 0.93. 2-D plot generated from PCOA of ISSR data also in coherence with the clustering pattern of UPGMA dendrogram. The first five principal components accounted for 91.14% of the total variation and the first three accounted for 70.74% of the variation, in which maximum variation was contri-buted by first component (30.86%) followed by second component (23.91%), and third component (15.97%). 2-D plot generated through PCOA also showed the same grouping pattern as the UPGMA dendrogram (Figure 4B).
DISCUSSION The aim of this study was to develop a simple and rapid technique to assist post-cryo assessment of genetic stability in vegetatively propagated germplasm. The results clearly demonstrate the application of molecular
5988
Afr. J. Biotechnol.
Figure 2. Mulberry [A] UPGMA dendrogram and [B] 2-D plot of 10 mulberry cultivars (ten control and 10 in vitro regenerated samples before and after cryopreservation) generated based on RAPD data.
Choudhary et al.
5989
M1-A
1.00
M1-B
1.00
1.00
M1-C
1.00
1.00
1.00
M2-A
0.65
0.65
0.65
1.00
M2-B
0.65
0.65
0.65
1.00
1.00
M2-C
0.65
0.65
0.65
1.00
1.00
1.00
M3-A
0.66
0.66
0.66
0.70
0.70
0.70
1.00
M3-B
0.66
0.66
0.66
0.70
0.70
0.70
1.00
1.00
M3-C
0.66
0.66
0.66
0.70
0.70
0.70
1.00
1.00
1.00
M4-A
0.62
0.62
0.62
0.69
0.69
0.69
0.81
0.81
0.81
1.00
M4-B
0.62
0.62
0.62
0.69
0.69
0.69
0.81
0.81
0.81
1.00
1.00
M4-C
0.62
0.62
0.62
0.69
0.69
0.69
0.81
0.81
0.81
1.00
1.00
1.00
M5-A
0.83
0.83
0.83
0.62
0.62
0.62
0.70
0.70
0.70
0.71
0.71
0.71
1.00
M5-B
0.83
0.83
0.83
0.62
0.62
0.62
0.70
0.70
0.70
0.71
0.71
0.71
1.00
1.00
M5-C
0.83
0.83
0.83
0.62
0.62
0.62
0.70
0.70
0.70
0.71
0.71
0.71
1.00
1.00
1.00
M6-A
0.69
0.69
0.69
0.61
0.61
0.61
0.69
0.69
0.69
0.72
0.72
0.72
0.76
0.76
0.76
1.00
M6-B
0.69
0.69
0.69
0.61
0.61
0.61
0.69
0.69
0.69
0.72
0.72
0.72
0.76
0.76
0.76
1.00
1.00
M6-C
0.69
0.69
0.69
0.61
0.61
0.61
0.69
0.69
0.69
0.72
0.72
0.72
0.76
0.76
0.76
1.00
1.00
1.00
M7-A
0.52
0.52
0.52
0.50
0.50
0.50
0.65
0.65
0.65
0.63
0.63
0.63
0.58
0.58
0.58
0.68
0.68
0.68
1.00
M7-B
0.52
0.52
0.52
0.50
0.50
0.50
0.65
0.65
0.65
0.63
0.63
0.63
0.58
0.58
0.58
0.68
0.68
0.68
1.00
1.00
M7-C
0.52
0.52
0.52
0.50
0.50
0.50
0.65
0.65
0.65
0.63
0.63
0.63
0.58
0.58
0.58
0.68
0.68
0.68
1.00
1.00
1.00
M8-A
0.56
0.56
0.56
0.62
0.62
0.62
0.63
0.63
0.63
0.68
0.68
0.68
0.65
0.65
0.65
0.73
0.73
0.73
0.75
0.75
0.75
1.00
M8-B
0.56
0.56
0.56
0.62
0.62
0.62
0.63
0.63
0.63
0.68
0.68
0.68
0.65
0.65
0.65
0.73
0.73
0.73
0.75
0.75
0.75
1.00
1.00
M8-C
0.56
0.56
0.56
0.62
0.62
0.62
0.63
0.63
0.63
0.68
0.68
0.68
0.65
0.65
0.65
0.73
0.73
0.73
0.75
0.75
0.75
1.00
1.00
1.00
M9-A
0.42
0.42
0.42
0.37
0.37
0.37
0.47
0.47
0.47
0.45
0.45
0.45
0.42
0.42
0.42
0.47
0.47
0.47
0.52
0.52
0.52
0.50
0.50
0.50
1.00
M9-B
0.42
0.42
0.42
0.37
0.37
0.37
0.47
0.47
0.47
0.45
0.45
0.45
0.42
0.42
0.42
0.47
0.47
0.47
0.52
0.52
0.52
0.50
0.50
0.50
1.00
1.00
M9-C
0.42
0.42
0.42
0.37
0.37
0.37
0.47
0.47
0.47
0.45
0.45
0.45
0.42
0.42
0.42
0.47
0.47
0.47
0.52
0.52
0.52
0.50
0.50
0.50
1.00
1.00
1.00
M10-A
0.59
0.59
0.59
0.54
0.54
0.54
0.63
0.63
0.63
0.62
0.62
0.62
0.62
0.62
0.62
0.67
0.67
0.67
0.69
0.69
0.69
0.68
0.68
0.68
0.51
0.51
0.51
1.00
M10-B
0.59
0.59
0.59
0.54
0.54
0.54
0.63
0.63
0.63
0.62
0.62
0.62
0.62
0.62
0.62
0.67
0.67
0.67
0.69
0.69
0.69
0.68
0.68
0.68
0.51
0.51
0.51
1.00
1.00
M10-C
0.59
0.59
0.59
0.54
0.54
0.54
0.63
0.63
0.63
0.62
0.62
0.62
0.62
0.62
0.62
0.67
0.67
0.67
0.69
0.69
0.69
0.68
0.68
0.68
0.51
0.51
0.51
1.00
1.00
M10-C
M10-B
M10-A
M9-C
M9-B
M9-A
M8-C
M8-B
M8-A
M7-C
M7-B
M7-A
M6-C
M6-B
M6-A
M5-C
M5-B
M5-A
M4-C
M4-B
M4-A
M3-C
M3-B
M3-A
M2-C
M2-B
M2-A
M1-C
M1-B
M1-A
Table 3. A pairwise similarity matrix of 10 samples (fresh, in vitro raised before and after cryopreservation) of different Morus species based on RAPD data.
1.00
5990
Afr. J. Biotechnol.
M1-A
1.00
M1-B
1.00
1.00
M1-C
1.00
1.00
1.00
M2-A
0.52
0.52
0.52
1.00
M2-B
0.52
0.52
0.52
1.00
1.00
M2-C
0.52
0.52
0.52
1.00
1.00
1.00
M3-A
0.58
0.58
0.58
0.67
0.67
0.67
1.00
M3-B
0.58
0.58
0.58
0.67
0.67
0.67
1.00
1.00
M3-C
0.58
0.58
0.58
0.67
0.67
0.67
1.00
1.00
1.00
M4-A
0.59
0.59
0.59
0.66
0.66
0.66
0.97
0.97
0.97
1.00
M4-B
0.59
0.59
0.59
0.66
0.66
0.66
0.97
0.97
0.97
1.00
1.00
M4-C
0.59
0.59
0.59
0.66
0.66
0.66
0.97
0.97
0.97
1.00
1.00
1.00
M5-A
0.95
0.95
0.95
0.51
0.51
0.51
0.59
0.59
0.59
0.60
0.60
0.60
1.00
M5-B
0.95
0.95
0.95
0.51
0.51
0.51
0.59
0.59
0.59
0.60
0.60
0.60
1.00
1.00
M5-C
0.95
0.95
0.95
0.51
0.51
0.51
0.59
0.59
0.59
0.60
0.60
0.60
1.00
1.00
1.00
M6-A
0.52
0.52
0.52
0.73
0.73
0.73
0.76
0.76
0.76
0.76
0.76
0.76
0.51
0.51
0.51
1.00
M6-B
0.52
0.52
0.52
0.73
0.73
0.73
0.76
0.76
0.76
0.76
0.76
0.76
0.51
0.51
0.51
1.00
1.00
M6-C
0.52
0.52
0.52
0.73
0.73
0.73
0.76
0.76
0.76
0.76
0.76
0.76
0.51
0.51
0.51
1.00
1.00
1.00
M7-A
0.60
0.60
0.60
0.62
0.62
0.62
0.65
0.65
0.65
0.67
0.67
0.67
0.58
0.58
0.58
0.58
0.58
0.58
1.00
M7-B
0.60
0.60
0.60
0.62
0.62
0.62
0.65
0.65
0.65
0.67
0.67
0.67
0.58
0.58
0.58
0.58
0.58
0.58
1.00
1.00
M7-C
0.60
0.60
0.60
0.62
0.62
0.62
0.65
0.65
0.65
0.67
0.67
0.67
0.58
0.58
0.58
0.58
0.58
0.58
1.00
1.00
1.00
M8-A
0.56
0.56
0.56
0.60
0.60
0.60
0.64
0.64
0.64
0.63
0.63
0.63
0.54
0.54
0.54
0.57
0.57
0.57
0.89
0.89
0.89
1.00
M8-B
0.56
0.56
0.56
0.60
0.60
0.60
0.64
0.64
0.64
0.63
0.63
0.63
0.54
0.54
0.54
0.57
0.57
0.57
0.89
0.89
0.89
1.00
1.00
M8-C
0.56
0.56
0.56
0.60
0.60
0.60
0.64
0.64
0.64
0.63
0.63
0.63
0.54
0.54
0.54
0.57
0.57
0.57
0.89
0.89
0.89
1.00
1.00
1.00
M9-A
0.41
0.41
0.41
0.66
0.66
0.66
0.63
0.63
0.63
0.64
0.64
0.64
0.41
0.41
0.41
0.61
0.61
0.61
0.61
0.61
0.61
0.57
0.57
0.57
1.00
M9-B
0.41
0.41
0.41
0.66
0.66
0.66
0.63
0.63
0.63
0.64
0.64
0.64
0.41
0.41
0.41
0.61
0.61
0.61
0.61
0.61
0.61
0.57
0.57
0.57
1.00
1.00
M9-C
0.41
0.41
0.41
0.66
0.66
0.66
0.63
0.63
0.63
0.64
0.64
0.64
0.41
0.41
0.41
0.61
0.61
0.61
0.61
0.61
0.61
0.57
0.57
0.57
1.00
1.00
1.00
M10-A
0.60
0.60
0.60
0.61
0.61
0.61
0.65
0.65
0.65
0.67
0.67
0.67
0.58
0.58
0.58
0.56
0.56
0.56
0.99
0.99
0.99
0.89
0.89
0.89
0.62
0.62
0.62
1.00
M10-B
0.60
0.60
0.60
0.61
0.61
0.61
0.65
0.65
0.65
0.67
0.67
0.67
0.58
0.58
0.58
0.56
0.56
0.56
0.99
0.99
0.99
0.89
0.89
0.89
0.62
0.62
0.62
1.00
1.00
M10-C
0.60
0.60
0.60
0.61
0.61
0.61
0.65
0.65
0.65
0.67
0.67
0.67
0.58
0.58
0.58
0.56
0.56
0.56
0.99
0.99
0.99
0.89
0.89
0.89
0.62
0.62
0.62
1.00
1.00
M10-C
M10-B
M10-A
M9-C
M9-B
M9-A
M8-C
M8-B
M8-A
M7-C
M7-B
M7-A
M6-C
M6-B
M6-A
M5-C
M5-B
M5-A
M4-C
M4-B
M4-A
M3-C
M3-B
M3-A
M2-C
M2-B
M2-A
M1-C
M1-B
M1-A
Table 4. A pairwise similarity matrix of 10 samples (fresh, in vitro raised before and after cryopreservation) of different Morus species based on ISSR data.
1.00
Choudhary et al.
5991
Figure 3. Gel profile of 10 mulberry accessions (ten controls, ten in vitro regenerated samples before and after cryopreservation) generated by ISSR primers: [A] UBC- 808 and [E] UBC-858. M is the λ DNA marker. Red circles showing the unique bands.
techniques to examine genetic stability in plants regenerated from cryopreserved dormant buds of mulberry germplasm. Genetic stability is the norm in most studies of possible plant genetic variation following cryopreservation (Harding, 2004). In the present studies, no differences were observed in mulberry between mother plants and in vitro regenerated before and after cryopreserved plants using RAPD and ISSR primers. This lack of variation suggests that there were no changes in the genetic fidelity of the plants due to cryopreservation. Cryopreserved yam (Dioscorea) shoots were genetically stable when compared to the original in vitro cultures (Mandal et al., 2008), and similar results were seen for apple shoot cultures (Liu et al., 2008). In the present study, the RAPD method of assessing genetic stability appeared simple and the reproducible results. However, there is little documentation on the effects of cryopreservation on the genetic stability and agronomic and/genetic stability of plants regenerated from frozen explants. RAPD analyses of cryopreserved in vitro grown shoot tips of Prunus and potato have shown no polymorphism between different amplified DNA patterns (Helliot, 1998; Hirai and Sakai, 2000). Similar results were found in the present study with mulberry dormant buds. The RAPD profiles were reproducible and no differences were found between the DNA patterns obtained with plantlets regenerated from control and cryopreserved plantlets. The RAPD technique therefore appears to be a fast, simple and efficient method for evaluating genetic stability of cryopreserved material, which can be used rapidly after the completion of a freezing experiment and
will efficiently complement other genetic stability evaluation methods. Similar results were observed by Zhai et al. (2003) in grape and kiwi cryopreserved plants and found highly reproducible DNA pattern obtained with plantlets regenerated from control and cryopreserved plantlets. Condello et al. (2009) also found similar results after cryopreservation of pear germplasm using RAPD. ISSR markers were successfully applied for detection of genetic similarities or dissimilarities (Vijayan et al., 2006; Lakshmanan et al., 2007). The eleven ISSR primers generated high level of genetic diversity (91.78% polymorphism) in mulberry. Similar results were found in their studies by several researchers (Vijayan, 2004; Vijayan and Chatteerjee, 2003; Naik and Dandin, 2005; Vijayan et al., 2006; Rao et al., 2007, 2009). Maintenance of genetic stability of cryopreserved germplasm has been reported in Melia (Scocchi et al., 2004); Dioscorea (Dixit et al., 2003); Grape and Kiwi (Zhai et al., 2003). Similarly in our study, plants regenerated from cryopreserved dormant buds were 100% genetically similar. Any accumulative DNA polymorphism may not be induced by cryopreservation (Harding, 2004). Maintenance of true-to-type clonal fidelity is one of the important aspects to be looked into in conservation activities of vegetatively propagated species. ACKNOWLEDGEMENT Authors are very thankful to Director, National Bureau of Plant Genetic Resources (NBPGR), New Delhi for encouragement and financial support.
5992
Afr. J. Biotechnol.
Figure 4. Mulberry [A] UPGMA dendrogram and [B] 2-D plot of 10 mulberry cultivars (ten control and ten in vitro regenerated samples before and after cryopreservation) generated based on ISSR data.
REFERENCES Benavides JE, Lachaux M, Fuentes M (1994). Effect of goat manure application in soil on biomass production and quality of mulberry
(Morus sp.). In: Benavides, J.E. (Ed.), Trees and Shrubs in Central America, Volume II. CATIE, Turrialba, pp. 495-514. Collinson ME (1989). The fossil history of the Moraceae, Urticaceae (including Cecropiaceae), and Cannabaceae. In: Crane PR.,
Choudhary et al.
Blackmore, S. (Eds), Evolution, Systematics, and Fossil History of the Hamamelidae, Vol 2: ‘Higher’ Hamamelidae. Clarendon Press, Oxford. pp. 319-339. Condello E, Palombi MA, Tonelli MG, Damiano C, Caboni E (2009). Genetic stability of wild pear (Pyrus pyraster, Burgsd) after cryopreservation by encapsulation dehydration. Agri. Food Sci.18:136-143. Dixit S, Mandal BB, Ahuja S, Srivastav PS (2003).Genetic stability assessment of plants regenerated from cryopreserved embryogenic tissue of Dioscorea bulbifera L. using RAPD, biochemical and morphological analysis. CryoLett. 24:77-84. Doyle JJ, Doyle JL (1990). A rapid total DNA preparation procedure for fresh plant tissue. Focus 12:13-15. FAO (1990). Sericulture training manual. Agricultural Services Bulletin No. 80. FAO, Rome. Fukui K, Shirata K, Niino T (2011). Cryopreservation of Mulberry Winter Buds in Japan. (International Symposium; 1st, Cryopreservation in horticultural species; Proceedings) Acta Hort. 908:483-488. Gupta S (2011).Cryopreservation of in vitro-grown shoot tips of Morus spp. and Pyrus cossonii Rehder by encapsulation-dehydration. Acta Hort. 908: 309-318. Harding K (2004). Genetic integrity of cryopreserved plant cells: A review. CryoLett.25:3-22. Helliot B (1998). Croissance et Stabilite genetique des Vitroplants de Prunier Ferlenain Plumina (R) apres cryoconservation des meristemes. PhD thesis, no. 2014, University of Bordeaux 1, France. Hirai D, Sakai A (2000). Cryopreservation techniques. Cryopreservation of in vitro-grown meristems of potato (Solanum tuberosum L.) by encapsulation-vitrification. Japan Int. Res. Cent. Agri. Sci. 8: 205-211. Hooker JD (1885). The flora of British India, vol. IV, Secretary of State for India Council, London. p. 185. Hou YJ (1994). Mulberry Breeding. Sericulture Department, Zhejiang Agriculture University, Hangzhou, p. 4. Jaccard P (1908). Nouvelles recherches sur la distribution florale. Bulletin de la Societe Vaudoise des Sciences Naturelles 44: 223-270. Lakshmanan V, Venkataramareddy SR, Neelwarne B (2007). Molecular analysis of genetic stability in long-term micropropagated shoots of banana using RAPD and ISSR markers. Electronic J. Biotech.10: 1-8. Liu YG, Liu LX, Wang L, Gao AY (2008). Determination of genetic stability in surviving apple shoots following cryopreservation by vitrification. CryoLett. 29: 7-14. Machii H, Koyama A, Yamanouchi H (1999): A list of genetic mulberry resources maintained at National Institute of Sericultural and Entomological Science. Miscellaneous Publication Nat. Seri. Entomol. Sci. 26:1-77. (in Japanese) Mandal BB, Ahuja-Ghosh S, Srivastava PS (2008). Cryopreservation of Discorea rotundata Poir. A comparative study with two cryogenic procedures and assessment of true-to-type of regenerants by RAPD analysis. CryoLett. 29: 399-408. Mantel NA (1967). The detection of disease clustering and a generalized regression approach. Cancer Res. 27: 209-220. Murashige T, Skoog F (1962). A revised medium for rapid growth and bioassay with tobacco cultures. Physiol. Plant. 15: 473-497. Naik GV, Dandin SB (2005). Molecular characterization of some improved and promising mulberry varieties (Morus spp.) of India by RAPD and ISSR Markers. Ind. J. Seri. 441:59-68. Niino T (1995).Cryopreservation of germplasm of mulberry (Morus spp.). In: Bajaj,Y.P.S.(Ed.):Biotechnology in Agriculture and Forestry. Springer-Verlag, Berlin, pp. 102-113. Padró MDA, Frattarelli A, Agueglia A, Condello E, Damiano C, Caboni E (2012). Cryopreservation of white mulberry (Morus alba L.) by encapsulation-dehydration and vitrification. Plant Cell, Tiss Org. Cult. 108: 167-172. Rao AA, Chaudhury R, Kumar S, Velu D, Saraswat RP, Kamble CK (2007). Cryopreservation of mulberry germplasm core collection and assessment of genetic stability through ISSR markers. Int. J. Indust. Entomo. 15: 23-33. Rao AA, Chaudhury R, Malik S, Kumar S, Ramachandran R, Qadri SMH (2009). Mulberry biodiversity conservation through cryopreservation. In Vitro Cell. Develop. Biol.- Pl. 45:639-649.
5993
Rohlf FJ (2000). NTSYS-pc: numerical taxonomy and multivariate analysis system, ver. 2.1. Exeter software, Setauket. Sanjappa M (1989). Genetic resources of mulberry and utilization. In: Sengupta, K., Dandin, S.B. (Eds.) Geographical distribution and exploration of the genus Morus L. (Moraceae), CSRTI, Mysore, India, pp. 4-7. Scocchi A, Faloci M, Medina R, Olmos S, Mroginski L (2004). Plant recovery of cryopreserved apical meristems-tips of Melia azedarach L. using encapsulation/dehydration and assessment of their genetic stability. Euphytica 135: 29-38. Srivastava P, Vijayan K, Awasthi AK, Saratechandra B (2004). Genetic analysis of Morus alba through RAPD and ISSR markers. Ind. J. Biotech. 3: 527-532. Tikader A, Dandin SB (2005). Biodiversity, geographical distribution, utilization and conservation of wild mulberry Morus serrata Roxb. Caspian J. Environ. Sci. 3:177-184. Tikader A, Vijayan K (2010). Assessment of biodiversity and strategies for conservation of genetic resources in mulberry (Morus spp.). In: Nageswara-Rao, M., Soneji, J.R. (Eds), Tree and Forest Biodiversity. Bioremed. Biodiv. Bioavail. 4 (Special Issue 1): 15-27. Vijayan K (2004). Genetic relationships of Japanese and Indian mulberry (Morus spp.) revealed by DNA fingerprinting. Plant Systemat. Evol. 243:221-232. Vijayan K (2010). The emerging role of genomics tools in mulberry (Morus) genetic .improvement. Tree Genet. Genom. 6: 613-625. Vijayan K, Chatterjee SN (2003). ISSR proofing of Indian cultivars of mulberry (Morus spp.) and its relevance to breeding programs. Euphytica 131:53-63. Vijayan K, Kar PK, Tikader A, Srivastava PP, Awasthi AK, Thangavelu K, Saratchandra B (2004). Molecular evaluation of genetic variability in wild populations of mulberry (Morus serrata Roxb.). Plant Breed. 123: 568-572. Vijayan K, Nair CV, Chatterjee SN (2005). Molecular characterization of mulberry genetic resources indigenous to India. Genet. Resour. Crop Evol. 52:77-86. Vijayan K, Srivastava PP, Raghunath MK, Sarat-chandra B (2011). Enhancement of stress tolerance in mulberry. Sci. Hort. 129:511-519. Vijayan K, Tikader A, Kar PK, Srivastava PP, Awasthi AK, Thangavelu K (2006). Assessment of genetic relationships between wild and cultivated mulberry (Morus) species using PCR based markers. Genet. Resour. Crop Evol. 53: 873-882. Wang ZW, Yu MD (2001). AFLP analysis of genetic background of polyploid breeding materials of mulberry. Acta Sericol. Sinica 27:170176. Williams JGK, Kubelil AR, Livak KJ, Rafalski JA, Tingey VS (1990). DNA polymorphisms amplified by arbitrary primers are useful as genetic masters. Nucleic Acid Res. 18: 6531-6535. Withers LA, Engelmann F (1997). In vitro conservation of plant genetic resources. In: Altman, A. (Ed.): Biotechnology in Agriculture. Marcel Dekker, New York. pp. 57-88. Yakuwa H, Oka S (1988). Plant regeneration through meristem culture from vegetative buds of mulberry (Morus bombycis Koidz.) stored in liquid nitrogen. Ann. Bot. 62:79-82. Yaltirik F (1982). Morus. In: Davis, P.H. (Ed.), Flora of Turkey. Edinburgh University Press, Edinburgh. Zerega NJ, Clement WL, Datwyler SL, Weiblen GD (2005). Biogeography and divergence times in the mulberry family (Moraceae). Mol. Phylogene. Evol. 37: 402-416Y, Huang Y (2006). Genetic relatedness among cultivated and wild mulberry (Moraceae: Morus) as revealed by inter-simple sequence repeat (ISSR) analysis in China. Canadian J. Plant Sci. 86:251-257. Zhai Z, Wu Y, Engelmann F, Chen R, Zhao Y (2003). Genetic stability assessments of plantlets regenerated from cryopreserved in vitro cultured grape and kiwi shoot tips using RAPD. CryoLett. 24:315-322. Zhao W, Zhou Z, Miao X, Wang S, Zhang L, Pan Anonymous (2006). The Wealth of India- A Dictionary of Indian Raw Materials and Industrial products. Second supplement series. (Raw materials) Vol.1; A-F; NISCAIR, CSIR, Dr. K S Krishnan Marg N D--12, pp.188201.