Population Biology
e -Xtra*
Genetic Structure of Colletotrichum gloeosporioides sensu lato Isolates Infecting Papaya Inferred by Multilocus ISSR Markers Sephra N. Rampersad The University of the West Indies, Department of Life Sciences, St. Augustine, Trinidad and Tobago. Accepted for publication 4 October 2012.
ABSTRACT Rampersad, S. N. 2013. Genetic structure of Colletotrichum gloeosporioides sensu lato isolates infecting papaya inferred by multilocus ISSR markers. Phytopathology 103:182-189. Colletotrichum gloeosporioides sensu lato is widely distributed throughout temperate and tropical regions and causes anthracnose disease in numerous plant species. Development of effective disease management strategies is dependent on, among other factors, an understanding of pathogen genetic diversity and population stratification at the intraspecific level. For 132 isolates of C. gloeosporioides sensu lato collected from papaya in Trinidad, inter-simple-sequence repeat-polymerase chain reaction (ISSRPCR) generated 121 polymorphic loci from five ISSR primers selected from an initial screen of 22 ISSR primers. The mean percentage of polymorphic loci was 99.18%. Bayesian cluster analysis inferred three genetic subpopulations, where group 1 consisted exclusively of isolates collected in the southern part of Trinidad whereas groups 2 and 3, although genetically distinct, were mixtures of isolates collected from both the northern and southern parts of Trinidad. Principal coordinates analysis and un-
Colletotrichum is a large, diverse genus of haploid Ascomycete fungi. There are 40 to 45 Colletotrichum spp. that are now accepted; however, Colletotrichum gloeosporioides is one of the most ubiquitous fungal species worldwide and has a diverse host range (7,8,40). The fungus is responsible for anthracnose disease in a number of economically important plants species in temperate, tropical, and subtropical regions (3). C. gloeosporioides is considered to be an aggregate or species complex (8,20) whose members include several putative and as-yet-undefined subspecies or intermediate forms (10). Within the taxa, subgroups show overlap in morphology, pathogenicity, and host specificity and display varying levels of genetic homogeneity (7,10,18). According to the phylogenetic species concept, sublineages that cannot be diagnostically separated by phenotype should not be considered to be distinct species (16). C. gloeosporioides sensu lato can exist in latent infections as a facultative parasite or endophyte and is capable of causing infections in >470 host genera, including tropical fruit species such as papaya (Carica papaya L.) (43). Papaya is cultivated in tropical and subtropical countries and is an economically important fruit tree crop that accounts for a substantial share of tropical fruit production in developing countries (46). Globally, Asia and countries of the Pacific region are the major papaya producers Corresponding author: S. N. Rampersad E-mail address:
[email protected] * The e-Xtra logo stands for “electronic extra” and indicates that the online version contains one supplemental figure. Figures 2 and 3 appear in color online. http://dx.doi.org/10.1094 / PHYTO-07-12-0160-R © 2013 The American Phytopathological Society
182
PHYTOPATHOLOGY
weighted pair-group method with arithmetic mean phylogeny were concordant with Bayesian cluster analysis and supported subdivision into the three subpopulations. Overall, the total mean gene diversity was 0.279, the mean within-population gene diversity was 0.2161, and genetic differentiation for the Trinidad population was 0.225. Regionally, northern isolates had a lower gene diversity compared with southern isolates. Nei’s gene diversity was highest for group 1 (h = 0.231), followed by group 2 (h = 0.215) and group 3 (h = 0.202). Genotypic diversity was at or near maximum for all three subpopulations after clone correction. Pairwise estimates of differentiation indicated high and significant genetic differentiation among the inferred subpopulations (Weir’s θ of 0.212 to 0.325). Pairwise comparisons among subpopulations suggested restricted gene flow between groups 1 and 2 and groups 1 and 3 but not between groups 2 and 3. The null hypothesis of random mating was rejected for all three inferred subpopulations. These results suggest that pathogen biology and epidemiology as well as certain evolutionary factors may play an important role in population substructuring of C. gloeosporioides sensu lato isolates infecting papaya in Trinidad.
followed by South and Central America and Africa (46). In Trinidad, production areas are concentrated in the south (87% of production), with scattered cultivations in the north (38). Disease pressure is expected to be higher in cultivations located in the south, with a concomitant increase in fungicide use compared with cultivations in the north. A study conducted by Rampersad (38) concluded that two species, Colletotrichum gloeosporioides sensu lato and C. truncatum, are responsible for anthracnose disease of papaya in Trinidad; however, infection is more commonly caused by C. gloeosporioides sensu lato. There are no known commercially available papaya cultivars that are resistant to C. gloeosporioides sensu lato and disease management depends on chemical use. Symptoms of infection are usually seen as circular sunken lesions with a gelatinous effect on mature to ripe fruit; pinkish to salmon-colored spores may or may not be present (38). A molecular approach to characterizing the species complex has been recommended due to limited use of taxonomic characters and because genetic diversity can be more objectively defined using molecular approaches (6,10). However, earlier approaches may have underestimated genetic diversity due to reliance on data from a single gene region that may have lacked sufficient polymorphisms for exploiting genetic variability at the subspecies level. The use of multilocus comparative sequence analysis has been recommended as part of a polyphasic approach to studying genetic diversity of the species complex; however, there is no agreement on which genes would be the most informative for estimating intraspecific genetic diversity as different genes are subject to different rates of substitution and evolution (6,10). Other molecular techniques such as random amplified polymorphic DNA (RAPD), restriction fragment length polymorphism (RFLP),
and amplified fragment length polymorphism (AFLP) fingerprinting; analysis of A-T-rich DNA sequences in mitochondrial DNA; internal transcribed spacer RFLP polymerase chain reaction (PCR); arbitrarily primed (AP)-PCR; and sequence comparisons of certain nuclear, structural, and metabolic genes have been used to characterize the C. gloeosporioides species complex with variable success (15,18). Multilocus molecular marker technology has been applied for the identification and authentication of a number of plant and animal species and is highly suited to assessing the genetic structure of plant-pathogenic fungi (9,19,27,29,30,31,39,54). One approach, inter-simple-sequence repeat (ISSR)-PCR, is a discriminatory, genome-wide DNA fingerprinting method that involves amplification of a DNA segment flanked by two identical microsatellite repeats but oriented in opposite directions (5). These simple-sequence repeats (SSRs) or microsatellites are hypervariable and are randomly distributed throughout the genome; the number of these repeating motifs will vary according to individual. The evolutionary rate of change within microsatellite regions is significantly higher than for other regions, and it is the hypervariable nature of ISSR markers that enables detection of a higher level of polymorphism compared with other molecular markers (51,54). The main advantages of ISSR-PCR also include low cost, simple operation, high stability and reproducibility, and rapid turnover (51). ISSR markers distinguished C. acutatum isolates infecting almond from Australia from isolates in California and Israel (26,28) and allowed subspecific variation among Colletotrichum isolates in Guyana and Brazil (19,32). Understanding the genetic diversity and population structure of this species complex is important because it will assist in the understanding of pathogen population dynamics, which is useful when breeding for resistance or monitoring the sensitivity of fungicides across a collection of isolates. Genetic structure and gene flow influence the generation and distribution of new genotypes which affect the evolutionary and adaptive potential of the pathogen under changing selection pressures and contribute to population viability and persistence (22–25). Knowledge of the genetic structure of the pathogen will also reveal the relative impact of certain evolutionary forces (e.g., selection, migration, and recombination) on epidemiology which, ultimately, will assist in developing improved integrated pest management strategies. The objectives of this work were to (i) develop appropriate ISSR genetic markers for intraspecific demarcation of C. gloeosporioides sensu lato isolates from papaya from Trinidad and (ii) use these ISSR markers to estimate the genetic diversity and population structure of these C. gloeosporioides sensu lato isolates based on measures of gene diversity, genetic differentiation, linkage disequilibrium, gene flow, and cluster analysis. MATERIALS AND METHODS Isolate collection. A country-wide collection from the main papaya production areas in Trinidad was carried out (Table 1) in 2010 and 2011. In total, 132 C. gloeosporioides sensu lato isolates were collected and their identity was confirmed by molecular analysis (38). There were no a priori assumptions about the number of populations or subpopulations; the entire Trinidad sample set was considered in the operational sense (i.e., a TABLE 1. Colletotrichum gloeosporioides sensu lato isolates from papaya used to determine population structure Number of isolates 57 20 12 16 27
Year
County
Region
2010, 2011 2011 2011 2010 2010
Victoria St. Patrick Mayaro St. Andrew St. George
South South South North North
collection of isolates from a specific country). For some comparisons, isolates were grouped according to region of origin (i.e., north and south). The north is considered to consist of locations at the base of the northern range landmark; similarly, the south is considered to consist of locations at the base of the southern range landmark. ISSR profiling. Total DNA was extracted from monosporic cultures of C. gloeosporioides isolates grown in potato dextrose broth for 9 days in the dark using the E.Z.N.A. SP fungal DNA extraction kit (Omega Bio-tek Inc., GA), in accordance with the manufacturer’s instructions. Four C. gloeosporioides isolates were used in a preliminary screen to determine those ISSR primers that enabled generation of polymorphic, reproducible markers that could be used to generate polymorphic DNA fingerprints for all C. gloeosporioides isolates. This screen tested 22 ISSR primers (Integrated DNA Technologies, IA) (Table 2) which were previously reported to produce polymorphic and reproducible DNA fingerprint patterns from other fungi or plant species. In addition to primer screening, optimization of PCR conditions included titration of MgCl2 and DNA concentration and assessment of optimal primer annealing temperature by gradient annealing temperature analysis. For a single 25-µl reaction, PCR components (Invitrogen by Life Technologies, CA) were 1× PCR buffer, 1.5 mM MgCl2, 0.2 mM dNTP, 0.5% Tween-20, bovine serum albumen (Sigma-Aldrich, St. Louis) at 0.4 mg/ml, 1 U of Taq DNA Polymerase, and 10 µM each primer. Standard PCR amplification conditions were an initial denaturation of 5 min at 95°C; followed by 35 cycles of 30 s at 95°C, 30 s at 41 to 60°C, and 90 s at 72°C; with a final extension of 5 min at 72°C. The PCR reactions were run on a Techne thermocycler (BioRad Laboratories Ltd., Ontario, Canada). PCR products were separated on 1.4% agarose gels stained with ethidium bromide. A 1-kb and a 100-bp DNA ladder (Invitrogen by Life Technologies) were used as molecular weight markers. PCR reactions were conducted twice to confirm reproducibility of the fingerprints. Those primers that generated reproducible, clearly discernible, polymorphic bands in repeated experiments were selected to subsequently amplify genomic DNA from all isolates. Bands were scored computationally using the GelAnalyzer 2010a software (http://www.gelanalyzer.com). Only bands (size: 100 to 2,500 bases) that could be scored consistently for all samples TABLE 2. Characteristics of inter-simple-sequence repeat (ISSR) primers screened ISSR primera *P1: (AG)8 *P2: (AC)8 P3:(CAG)5 P4: (CAA)5 P5: (GTG)5 P6: (CAC)5 P7: (ACA)5 P8: (AAC)5 P9: (CCA)5 P10: (AAG)6 P11: (GTC)6 *P12: (GACA)4 P13: (GGAT)4 P14: (GACAC)3 *P15: (AG)8TG P16: (AG)8CG P17: (CT)8G P18: (CA)8GT P19: CTC(GT)8 *P20: CT(GA)8 P21: BDB(ACA)5 P22: GAG(CAA)5
Ta (°C)b 43.4 47.4 47.4 33.7 47.4 47.4 33.7 33.7 54.9 41.2 54.9 43.4 44.7 44.7 48.0 48.0 48.0 48.0 48.0 48.0 48.0 48.0
Primer description Anchorless di-nucleotide Anchorless di-nucleotide Anchorless tri-nucleotide Anchorless tri-nucleotide Anchorless tri-nucleotide Anchorless tri-nucleotide Anchorless tri-nucleotide Anchorless tri-nucleotide Anchorless tri-nucleotide Anchorless tri-nucleotide Anchorless tri-nucleotide Anchorless tetra-nucleotide Anchorless tetra-nucleotide Anchorless penta-nucleotide Di-nucleotide, 3′ anchor present Di-nucleotide, 3′ anchor present Di-nucleotide, 3′ anchor present Di-nucleotide, 3′ anchor present Di-nucleotide, 5′ anchor present Di-nucleotide, 5′ anchor present Tri-nucleotide, 5′ anchor present Tri-nucleotide, 5′ anchor present
a
Asterisk (*) indicates the five ISSR primers that were selected and ultimately used in repeated experiments. b Annealing temperature. Vol. 103, No. 2, 2013
183
were used, with the assumption that each band represented a distinct locus and amplicons sharing the same molecular weight were considered to be the same locus. Data analysis. Amplified DNA fragments were transformed into a binary character matrix (1 = presence, 0 = absence). Bayesian clustering implemented by STRUCTURE 2.3 was first used to determine the probability that each isolate belonged to a distinct subpopulation or genetic cluster assuming admixture and correlated allele frequency (13,14,37). The model was run for 50,000 Markov chain Monte Carlo iterations after an initial burnin period of 10,000 generations from K = 1 to K = 10 for all 132 isolates. The models implemented in this version of STRUCTURE can resolve genetic structure at lower levels of divergence with less data than other models, and they are not prone to inferring structure when it is absent (false signals) (12). The ad hoc K statistic (ΔK) (12) was used to predict the most likely number of populations (K) in the data after 20 runs. The modal value of ΔK is a quantity based on the second-order rate of change with respect to K. After determining the number of inferred subpopulations or clusters, GenAlEx version 6.3, Genetic Analysis in Excel (36) was used to produce a genetic distance matrix; calculation of pairwise genetic distances for binary data followed the method of Huff et al. (17). Principal coordinates analysis (PCoA) was also carried out for separation of the isolates. Nei’s gene diversity (h) (33) allele frequencies and pairwise comparisons of genetic diversity for each inferred subpopulation were calculated using POPGENE version 1.32 (53) with 1,000 permutations. Genetic diversity was estimated according to McDonald (24); for haploid fungi that are assessed with dominant markers, the theoretical threshold of genetic diversity would be 0.50, assuming that both alleles are present with the same frequency. Weir and Cockerham’s θ (49,50), which is comparable with Wright’s FST, was calculated using MULTILOCUS version 1.32b (Department of Biology, Imperial College at Silwood Park, UK). The θ statistic ranges from 0 (for no population differentiation) to 1 (complete differentiation where populations are fixed for different alleles). Pairwise gene flow (Nm) was estimated for all subpopulations, where Nm < 1 is indicative of low levels of gene flow; Nm = 1 means that effects of drift are exactly counterbalanced by the effects of gene flow, so that populations neither diverge nor converge; and Nm > 1 suggests high levels of gene flow (22).
Linkage disequilibrium as an indication of random mating was calculated and tested for significance with 1,000 randomizations using MULTILOCUS; measures of gametic disequilibrium tested were (i) the proportion of compatible pairs of loci, (ii) the index of association (IA), and (iii) a standardized alternative of the IA (2). The null hypothesis for this test is that there is random association among alleles at different loci and IA = 0; the null hypothesis for random mating is rejected where IA > 0. For phylogenetic assignments, candidate isolates from each of the three inferred clusters were selected and the final data set for analysis consisted of 44 isolates (isolates 1 to 28 were from the south and isolates 29 to 44 were from the north). An unweighted pair group method with arithmetic mean (UPGMA) (42) phylogram was generated using Molecular Evolutionary Genetic Analysis software, version 5 for Windows (44). Bootstrapping was performed with WinBoot software using Dice’s coefficient with 10,000 bootstrap (BS) resamplings (52). RESULTS ISSR markers. Only those individuals that produced a polymorphic banding pattern for the five primers (Supplemental Figure S1) and for which the interpretation of the banding pattern was unequivocal were retained in the final data set. Fragments with the same molecular weight were considered to be the same locus. In total, 121 polymorphic loci were generated from ISSRPCR using the five ISSR primers selected from a screen of 22 ISSR primers (Table 2). The highest number of polymorphic bands (PBs) was produced for P2 (an anchorless di-nucleotide, 35 PBs), followed by P15 (a 3′-anchored di-nucleotide, 23 PBs), P1 (an anchorless di-nucleotide, 22 PBs), P12 (a tetra-nucleotide, 22 PBs), and P20 (a 5′-anchored di-nucleotide, 20 PBs). A high level of genetic variation was obtained using ISSR markers; the mean percentage of polymorphic loci was 99.18%. Isolates from the north (57.4%) had a lower level of polymorphism than those from the south (92.6%) (Table 3). Population stratification. Assignment of isolates was carried out by Bayesian clustering implemented by STRUCTURE software. Posterior probabilities calculated by STRUCTURE show population structure at K = 3 genetic groups or clusters (Fig. 1). The overall estimated proportion of membership of the samples to each of the three inferred genetic groups was 19.2, 40.4, and
TABLE 3. Band characteristics and genetic diversity overall for the Trinidad population and according to region (north and south) and according to subpopulations Index
Overall
Number of Isolates Different bands Bands (frequency ≥5%)a Private bandsb Local bands (≤25%)c Local bands (≤50%)d Alleles Number different (Na) SE of mean Nae Number effective (Ne)f SE of mean Ne Mean hg SE of mean h Mean uhh SE of mean uh Polymorphism (%) a
132 121 97 121 0 0 1.984 0.016 1.431 0.028 0.270 0.013 0.276 0.014 99.18
Northern region 48 71 71 71 0 0 1.156 0.089 1.332 0.302 0.200 0.017 0.213 0.019 57.38
Southern region 84 113 98 113 0 0 1.852 0.048 1.435 0.029 0.268 0.015 0.278 0.015 92.62
Group 1
184
PHYTOPATHOLOGY
Group 3
30 83 83 19 0 0
51 88 88 15 0 0
51 79 79 2 0 0
1.352 0.085 1.385 0.032 0.231 0.017 0.257 0.019 67.21
1.443 0.082 1.348 0.030 0.016 0.202 0.017 0.214 72.13
1.270 0.086 1.332 0.031 0.202 0.017 0.214 0.018 62.30
Number of different bands with a frequency >5%. Number of bands unique to a single population. c Number of locally common bands (frequency >5%) found in ≤25% populations. d Number of locally common bands (frequency >5%) found in ≤50% populations. e Standard error (SE) of mean number of different alleles. f Number of effective alleles = 1/(p^2 + q^2) (where, for haploid binary data, p = band frequency and q = 1 – p). g Gene diversity = 1 – (p^2 + q^2). h Unbiased gene diversity, where [N/(N – 1)] × h. b
Group 2
40.4% (Table 3) and the assignment of isolates to putative clusters is shown in Figure 2. The inferred genetic structure where K = 3 is shown in Figure 2 according to an ad hoc K statistic. Group 1 consisted exclusively of southern isolates whereas groups 2 and 3 were mixtures of southern and northern isolates (Fig. 3). Band statistics and polymorphisms are presented in Table 3 for the three inferred subpopulations. PCoA was carried out to estimate genetic similarity between individuals to further represent inter-individual and inter-group relationships. The two-dimensional PCoA plot (Fig. 2) indicated that the first and second principal coordinates accounted for 32.68 and 20.41%, respectively, of the total variation. Individuals were positioned into discrete groups; two of these groups consisted of both northern and southern isolates but the third group consisted exclusively of southern isolates. Isolate placement was independent of region (i.e., north and south). Therefore, PCoA results were concordant with Bayesian cluster analysis implemented by STRUCTURE. Data from the genetic distance matrices were analyzed using an UPGMA algorithm; only the optimal UPGMA tree is presented
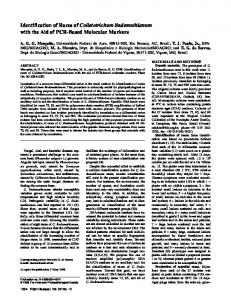
Fig. 1. ΔK plot to determine most probable K.
(Fig. 4). Population stratification was reflected in the tree topology, which consisted of three main subdivisions among the isolates. Robust BS support was indicated for separation of group 1 isolates (BS > 70%); however, strong BS support (BS >70%) for division of isolates into groups 2 and 3 was absent. Overall, the main groups produced were group 1, which consisted exclusively of southern isolates; group 2 and group 3 consisted of a mixture of both northern and southern isolates but these appeared to be distinct subdivisions. Strict clustering of isolates based on region (i.e., north and south) was not observed. Genotypic and gene diversity. The overall mean gene diversity (HT) was 0.279 and the mean within-population gene diversity (HS) was 0.2161. The overall genetic differentiation for the Trinidad population (GST) was 0.225, which suggests that 22.5% of the total variation among all isolates in the dataset was within subpopulations and 77.5% was among subpopulations. Regionally, northern isolates had a lower gene diversity (h = 0.200) compared with southern isolates (h = 0.268). Group 1 had the highest gene diversity (h = 0.231), followed by group 3 (h = 0.202), and group 2 (h = 0.016) had the lowest gene diversity. Pairwise comparisons of Nei’s unbiased measures of genetic identity and genetic distance estimated for three inferred subpopulations are given in Table 4. Pairwise estimates of differentiation (θ; below the diagonal in Table 5) indicate high and significant genetic differentiation among the inferred subpopulations. In total, 36 unique multilocus genotypes were identified among all three inferred subpopulations. Within each group, genotypic diversity was 1.000 for group 1, 0.991 for group 2, and 0.961 for group 3. Gene flow. Estimates of gene flow (Nm) among three subpopulations of C. gloeosporioides sensu lato isolates based on 121 polymorphic loci are presented in Table 5 (above the diagonal). Pairwise comparisons among subpopulations suggested that there was neither divergence nor convergence between groups 1 and 2 and between groups 1 and 3, where Nm ≈ 1. Between groups 2 and 3, Nm was 1.858, even though these two subpopulations were significantly and highly differentiated from each other. Linkage disequilibrium. For the IA test, the null hypothesis of random mating (IA = 0) was rejected for all three inferred sub-
Fig. 2. Two-dimensional plot of the principal coordinates analysis showing patterns of subspecific clustering of Colletotrichum gloeosporioides sensu lato isolates from papaya from Trinidad; three genetic groups were identified. Vol. 103, No. 2, 2013
185
populations. The IA was significantly different from zero (IA > 0) after 1,000 randomizations for each subpopulation (Table 6). In determining the proportion of phylogenetically compatibly loci pairs, the null hypothesis of random mating was also rejected because significantly more compatible pairs of loci were observed than expected under random mating for each subpopulation. Clonal genotypes were distributed within each subpopulation; to account for over-representation of clonal types, clone-censored data were used to retest the null hypothesis of random mating. The number of individuals in each subpopulation was considerably lower after clone correction; the IA values were also reduced but were still significantly different from zero (IA > 0) after 1,000 randomizations for each subpopulation (Table 6). DISCUSSION This is the first study to characterize partitioning of genetic diversity and population structure of C. gloeosporioides sensu lato isolates infecting papaya based on a genome-wide multilocus ISSR fingerprinting approach. Population genetic analysis supported subdivision of the Trinidad population into three inferred subpopulations characterized by high levels of gene and genotypic diversity, significant and high levels of genetic differentiation among subpopulations, the possibility of gene flow between two subpopulations (undetermined whether past or present events), no strict regional clustering of isolates, and rejection of the null hypothesis of random mating within the three subpopulations. Intraspecific variation based on ISSR fingerprinting has been shown to be high in some fungal species and low in others (39). The mechanisms responsible for presence or absence of ISSR markers include absence of a primer-binding site due to mutation in the priming site, strand slippage during DNA polymerization due to template instability, insertions or deletions that might increase or decrease amplified fragment length sufficiently for it to be scored as a separate locus, and structural rearrangements of the
chromosome that prevent polymerization. Further, the resolving power of ISSR fingerprinting is also dependent on the distribution and availability of complementary primer-binding sites in the target genome, in addition to the size of the fragments flanked by these ISSR primers which must be within amplifiable distance of each other. The base composition of the ISSR primers affects fingerprint quality because primers with high GC content (>50%) result in background noise and nonhomologous co-migrating fragments whereas pure A or T primers will result in smears of amplification products (54). Optimizing primer annealing temperature and other reaction conditions may serve to mitigate these effects. Microsatellite loci evolve at different rates and the variation in repeat number increases as a result of multi-step mutations (11). Regardless of the type of mutational process that led to differential primer binding in ISSR fingerprinting, there may be some bias in the mutation rate. Repeat length and base composition affect mutation rate (i.e., di-nucleotide repeats mutate faster than tri-nucleotide repeats, and sequences with a high AT content mutate faster than those with a high GC content) (40). There may also be a restriction on the number of repeats which may be related to maintaining genome size and chromosomal stability (9). Many Ascomycete fungi engage mixed reproduction strategies of clonal propagation (mitosporic spore production) and recombination (meiosporic spore production) (45). The reproductive mode affects pathogen fitness in terms of spread and persistence and ultimately affects the genetic structure, which may vary in time and space for a given species (28,45). C. gloeosporioides sensu lato has a sexual or perfect stage (teleomorph: Glomerella cingulata) but it is not always present in culture or under natural conditions. This study rejected the null hypothesis of random mating; however, perithecia were observed in most colonies (82.3%) grown in vitro and which were used in the analysis. Milgroom (28) recommended a direct assessment of the potential for recombination based on the presence of sexual structures in
Fig. 3. Relative proportion of the genome of an individual originating from each inferred population (quantitative clustering method) and assignation to clusters. Different shadings represent different genetic groups; each column represents an individual isolate, and the height of the column segments shows the probability of assignment of this isolate to a particular genetic group. The height of each shaded region within an individual bar is the measure of proportional affiliation. Individuals with membership coefficients of qi ≥ 0.7 were assigned to a specific genetic cluster. 186
PHYTOPATHOLOGY
culture and under natural conditions. There was also evidence of high genotypic diversity (at or near maximum for the three inferred subpopulations), typical of recombining populations (28). A departure from random mating can only be proposed if all other causes of deviations from random mating (i.e., selection, genetic drift, mutation, epigenetic effects, and physical linkage between loci) have been discounted (22–25,28,29). It is also difficult to determine how often recombination occurs, or whether the identified genetic structure was influenced by past, present, or parasexual recombination events (45). Strict regional separation of isolates into distinctly isolated subpopulations was not observed because there was evidence of admixture between northern and southern isolates. There was also evidence of gene flow between groups 2 and 3 but whether this was due to recent or past migration events cannot be determined. Mechanisms that enable gene flow may act randomly and may be a result of a combination of (i) anthropogenic activities, including movement and exchange of infected seed and planting material; (ii) the process of extinction and recolonization (which is common to most agroecosystems because of seasonal cropping regimes), which means that most fungal pathosystems are not in evolutionary equilibrium (i.e., a balance between genetic drift and migration); and (iii) alternate hosts outside of the growing season that may allow certain genotypes to persist and undergo expansion in the field (22–25,28,29). Results indicated that group 1, which consisted exclusively of southern isolates, exhibited higher
significant differentiation and restricted gene flow than the other two subpopulations. Group 1 may contain individual members that were recently introduced to Trinidad or may constitute a unique or specially adapted ecological group. These southern isolates may possess novel genotypes with biologically important character combinations. Tracking marked isolates, in an effort to (i) determine the potential risk these genotypes might pose to management strategies and (ii) evaluate differences in cultural or management strategies in the south that may have selected for such isolates in the first place, might prove useful to further understanding the epidemiology of this disease in papaya in Trinidad. With respect to ISSR polymorphisms between northern and southern isolates, the relative differences observed strictly for ISSR profiles may be due to differences in the number of isolates used for each region (89 southern isolates and 43 northern isolates). These differences, however, were not statistically adequate to separate the isolates into northern and southern subpopulations when more advanced analyses were applied. This underlines the importance of treating the data set without any assumption of substructuring or admixture prior to analysis. STRUCTURE analysis, PCoA, and, to a lesser degree of robustness, the UPGMA algorithm all indicated admixture between northern and southern isolates because there was no distinct northern population. In this study, there were high levels of genetic differentiation among the inferred subpopulations. In fungal pathogens with mixed reproductive strategies, as for C. gloeosporioides sensu lato, recombination and selection can work together to sustain a particular genotype that offers a positive selective advantage, which can allow for a high level of genetic differentiation among subpopulations (22,28,29). An intermediate model of population structure, referred to as an “epidemic” model by Smith et al. (41), is characterized by initial recombination events followed by clonal expansion of one or a few highly successful individuals through multiple successive asexual cycles that may lead to linkage disequilibrium. Although the model was initially suggested for bacteria, it is applicable to many plant fungal pathosystems (28). It is likely that the genetic structure of C. gloeosporioides sensu lato isolates infecting papaya is consistent with this model, based on the results of this study. Additionally, genetic differentiation may have progressed to subdivision of the Trinidad population into three inferred subpopulations; however, no locus was TABLE 4. Measures of pairwise comparisons of Nei’s unbiased measures of genetic identity and genetic distance estimated for three inferred subpopulations of Colletotrichum gloeosporioides sensu lato isolates from papaya from Trinidada Subpopulation Group 1 Group 2 Group 3 a
Group 1
Group 2
Group 3
… 0.148 0.148
0.862 … 0.078
0.863 0.925 …
Nei’s genetic identity (above diagonal) and genetic distance (below diagonal).
TABLE 5. Pairwise estimates of differentiation (θ) and gene flow (Nm) among three subpopulations of Colletotrichum gloeosporioides sensu lato isolates based on 121 polymorphic locia Subpopulation
Group 1
Group 2
Group 3
Group 1 Group 2 Group 3
... 0.314* 0.325**
1.097 ... 0.212**
1.043 1.858 ...
a
Fig. 4. Unweighted pair group method with arithmetic mean phylogram showing the optimal tree. The tree is drawn to scale, with branch lengths in the same units as those of the evolutionary distances used to infer the phylogenetic tree. Only bootstrap scores ≥60.0% are shown.
Weir’s θ (49) is comparable with Wright’s FST statistic and was estimated ∑ according to for all 121 loci and averaged, where Plu is the frequency of the alleles u at the lth locus, and n is the number of individuals sampled. P values were estimated with 1,000 randomizations; values calculated were significantly different from zero at P < 0.001 (*) and P < 0.0001 (**), which indicated high and significant subpopulation differentiation. Weir’s θ (below diagonal) and Nm (above diagonal). Vol. 103, No. 2, 2013
187
TABLE 6. Estimates of linkage disequilibrium for three inferred subpopulations of Colletotrichum gloeosporioides sensu lato isolates from papaya from Trinidad Subpopulation
Na
Genotypic diversityb
PrCLc
IAd
̅
Group 1 Group 2 Group 3 Group 1ccg Group 2cc Group 3cc
30 51 51 10 15 18
0.931 0.946 0.925 1.000 0.991 0.961
0.900 0.856 0.915 0.900 0.874 0.916
6.052 4.577 4.628 2.642 2.615 3.024
0.075 0.054 0.063 0.033 0.034 0.041
a b
e
Number of samples. Genotypic diversity was determined as the probability that two individuals taken at random have different genotypes and was estimated by
Pf