Journal of Stored Products and Postharvest Research Vol. 2(4) pp. 79 – 92, April 2011 Available online http://www.academicjournals.org/JSPPR ISSI 2141 - 6567 ©2011 Academic Journals
Full Length Research Paper
Genetic variability studies between released varieties of cassava and central Kerala cassava collections using SSR markers Sree S. Lekha1, Jaime A. Teixeira da Silva2 and Santha V. Pillai1* 1
Central Tuber Crops Research Institute, Sreekariyam, Trivandrum 695017, Kerala, India. Faculty of Agriculture and Graduate School of Agriculture, Kagawa University, Miki-cho, Ikenobe 2393, Kagawa-ken, 761-0795, Japan.
2
Accepted 8 March, 2011
Twelve released varieties of cassava and 24 central Kerala collections were assessed at the genomic DNA level with 36 SSR primers for genetic diversity study. The minimum number of SSR primers that could readily be used for identification of the 36 cassava genotypes was also determined. For the genetic diversity study, the similarity coefficients generated between released varieties and central Kerala varieties ranged from 40 to 95% and two separate DNA cluster groups were formed at 0.60 coefficients using “numerical taxonomy” and “multivariate analysis system software package”. The similarity index for released varieties ranged from 60 to 93% and in the case of central Kerala varieties it ranged from 70 to 98%. The mean fixation index (F) for released varieties was 0.0688 and that for central Kerala collections was 0.1337, indicating an overall conformance to Hardy-Weinberg equilibrium. Principal component analysis helped in identifying primers which contributed much to the variation present in the population and reduce the cost and time of research for genetic diversity and genotype identification studies for cassava genetic improvement programs. Key words: Cassava, genetic diversity, genotypes, microsatellites, principal component analysis, similarity index, simple sequence repeats primers. INTRODUCTION The genus Manihot originates from Latin America where 98 species are found (Rogers and Appan, 1973). Manihot esculenta Crantz (cassava) was initially introduced to Africa 400 years ago, where its cultivation for food spread throughout tropical and subtropical regions. The second Manihot species present in Africa, M. glaziovii Mueller Von Argau, was introduced 200 years ago as a source of rubber, although its distribution was less extensive (Jones, 1959). Cassava, which is generally propagated vegetatively, is one of the major sources of food in Africa (Cock, 1982). The roots, which are an excellent source of carbohydrates, have a very low protein content. In
*Corresponding author. E-mail:
[email protected]. Fax: 91471-2590063.
addition, the roots have a high content of cyanogenic glucosides (de Bruijn, 1971) which often necessitates extensive processing before cassava is edible. Cassava has the advantage of being well adapted to a wide range of environmental stresses. It grows very well in less fertile soil in contrast to many other crops that are highly vulnerable to environmental stresses during critical stages of plant development (Ugorji, 1998). Current economy advancement has also turned cassava into a cash crop, since several items are processed from it, which find various end uses. One of the best methods to increase cassava production to serve as the main food security and cash crop in Africa and developing countries is by the development of better varieties that are resistant to diseases, pests, and drought (Ugorji, 1998). Genetic improvement of cassava is to a certain extent limited by a poor knowledge of genetic diversity within the
80
J. Stored Prod. Postharvest Res.
Table 1a. Morphological characters of CTCRI released varieties of cassava.
Characteristics Plant type Stem colour Leaf colour Leaf type Petiole colour Flowering Tuber shape Tuber skin colour Tuber rind colour Tuber flesh colour Tuber neck
RV1 E.B D.G L.S B D.G F C L.B Cr W A
RV2 E.B L.G L.B B L.G F Fu G.B Cr W A
RV3 E.B G Gr B G F C Cr L.P W A
RV4 E.B D.S L.B B D.G F Fu Br Cr L.Y A
RV5 E.B D.G S B P F C L.B Cr W L.N
RV6 E.B R.B L.S D.G P SF C Br Cr W S.N
RV7 E.B G L.P B L.P SF C L.B Cr W A
RV8 E.B RB S B LP F Co B P W A
RV9 E.B GB LP B LG F Co B Cr LY A
RV10 EB BW LS B P SF Co LB Cr Cr A
RV11 MH LG LS M P F Co B LY LY A
RV12 T GG LG M DG F C SW W W A
EB-Erect branching, DG-dark green, LS- light sepia, B- brown, F- flowering, Co-conical, C- cylindrical, LB- light brown, Cr-cream, W-white, A-absent, lglight green, Fu- fusiform, GB- greyish brown, Gr- grey, G-green, LP-light pink, DS-dark sepia, S-sepia, P-pink, LY-light yellow, LN-long neck, SN-small neck, SF- shy flowering, RB-reddish brown, M-medium, MH-medium height, T-tall, GG-grayish green and SW- silvery white.
species. Isoenzymes have been used as a method to estimate genetic diversity within cassava, but low polymorphism was detected and the technique was not reproducible (Hussain et al., 1987; Ramírez et al., 1987; Lefèvre and Charrier, 1993). Studies have been conducted earlier to assess the variability based on biometrical characters as well as RAPD (randomly amplified polymorphic DNA) markers (Pillai, 2002; Pillai et al., 2004). Studies were conducted earlier to study the variability of cassava in Kerala using simple sequence repeats (SSR) markers (Sree Lekha and Pillai., 2008, 2010). DNA-based molecular markers such as RAPDs, nuclear RFLPs (restriction fragment length polymorphism) and microsatellites (= SSR markers) were used to develop the cassava molecular genetic map (Fregene et al., 1997). There is a wide range of molecular techniques available to assess genetic variability of a species. Due to their co-dominant inheritance, robustness and amenability to high throughput, SSRs or microsatellites have become a tool of choice for investigating important crop germplasm (Hokanson et al., 1998). SSR markers have been confirmed to be the most informative and appropriate for cassava (Mba et al., 2000). Perera et al. (2001) also supported SSR markers as the most informative for plants. Valuable attributes of all SSR markers are codominance (many alleles are found among closely related individuals), technical simplicity, sensitivity, analytical simplicity (data are unambiguously scored, and highly reproducible) and are high abundance (markers are uniformly dispersed throughout genome as frequently as every 10 kb and therefore are ideal tools for many genetic applications. Microsatellites are short stretches of tandemly repeated, 1 to 5 nucleotide sequences, such as (G-A) n. They are ubiquitously present in eukaryotic genomes and are highly polymorphic (Tautz 1989).
Conservation of microsatellite flanking sequences allows the design of primers for PCR amplification. In cassava, SSR markers have been used to search for duplicates in the CIAT (International Centre for Tropical Agriculture, Cali, Colombia) core collection (Chavarriaga-Aguirre et al., 1999) and to analyze variation in natural populations of putative progenitors of cassava (Olsen and Schaal, 2001). At present more than 500 SSR markers are available in cassava which will provide genetic tags for various phenotypes in cassava. The objective of the present study was to: 1) quantify the genetic variability and diversity available in the land races of central Kerala and released varieties and 2) to assess the minimum number of SSR primers that could readily be used for the identification of 36 cassava genotypes in order to reduce the time and cost of research studies. MATERIALS AND METHODS Plant material Twelve varieties of cassava which were released from our institute CTCRI to the farmers and twenty four cassava cultivars that were collected from central part of kerala were selected for this study. The varieties were planted at the CTCRI farm and were evaluated for plant type; stem colour, leaf colour, leaf type, petiole colour, flowering, tuber shape, skin colour, rind colour and flesh colour (Table 1a and b). DNA extraction DNA was extracted according to Dellaporta et al. (1983). Plants 3 to 4 weeks old were selected and approximately 2 g of fresh and young leaf tissue was used for DNA extraction. After crushing the fresh leaf tissue in a porcelain pestle using liquid nitrogen, 5 ml of extraction buffer was added then incubated for 30 min at 60°C.
Sreelekha
et
CK10 EB W P B LP F C LB C C A
CK11 EB LB G B P SF C LB P W A
al
81
Table 1b. Morphological characters of Central Kerala varieties of cassava.
Characteristics Plant type Stem colour Leaf colour Leaf type Petiole colour Flowering Tuber shape Tuber skin colour Tuber rind colour Tuber flesh colour Tuber neck
CK1 EB W LP B R F C LB C W A
CK2 EB W LP B R F C LB C W A
CK3 EB LP LP M G F C B C W A
CK4 EB W LP B R F C L C W A
CK5 EB D LP M R F C B C C A
CK6 EB W P B P F C B C W A
CK7 EB W LP B G F C LB C W A
CK8 EB LB P B G F Co LB P W A
CK9 EB LB G B P F C LB LP C A
CK12 EB W G M P SF C LB C W A
Table 1b. Contd.
Characteristics Plant type Stem colour Leaf colour Leaf type Petiole colour Flowering Tuber shape Tuber skin colour Tuber rind colour Tuber flesh colour Tuber neck
CK13 EB W G B P F Co LB LP W A
CK14 EB W LP B P SF Fu LB C W A
CK15 EB W P B P SF Fu LB C C A
CK16 EB W G B P F C LB C W A
CK17 EB W G B P F C LB C W A
CK18 EB DB G B P F C LB C W A
CK19 EB W LP B P F C B C C L
CK20 EB W G B P F C LB LP W MN
CK21 EB LB LP M G F C LB C W LN
CK22 EB D P B P F Fu LB P W MN
CK23 EB LB G B P F C LB C W LN
CK24 EB W G B P SF C B C W LN
EB-Erect branching, W-white, G-green, B-broad, P-pink, F-flowering, Co-conical, LB- light brown, LP- light pink, MN- medium neck, P-pink, G-green, DBdark brown, SF-small flower, Fu-fusiform, C-cylindrical, B-brown, A-absent and LN-long neck.
After incubation, 2.5 ml of 5 M potassium acetate was added and mixed well by inversion and incubated on ice for 20 min. The sample was centrifuged at 10,000 rpm for 10 min at 4°C. After centrifugation the supernatant was recovered and isopropanol was added to 2/3 of the previous volume by inverting slowly until the DNA precipitated. The precipitated DNA was centrifuged for 10 min at 10,000 rpm at 4°C. The supernatant was discarded and 1 ml of TE (10 mM Tris HCl and 1 mM EDTA; pH 8) was added and the nucleic acid was gently resuspended. Then 10 µl of RNase (Bangalore Genie, Bangalore, India) was added at 10 mg/ml per sample and incubated at 37°C for 1 h. Thereafter, 100 µl of 3 M sodium acetate and 2 ml of 95% ethanol was added to precipitate DNA and mixed by inversion, then centrifuged for 10 min at 10,000 rpm at 4°C. To the DNA pellet, 500 µl of 70% ethanol was added. After centrifugation, the DNA was resuspended in 1 ml TE. Between 500 µg and 1 mg of high quality DNA was obtained from each extraction and quantified by UV absorption at 260 nm using a Shimadzu UV260 spectrophotometer. DNA was also quantified by 0.8% agarose gel electrophoresis after staining with ethidium bromide (EtBr).
PCR assay and gel analysis A set of 36 SSR markers developed at CIAT (Chavariagga-Aguirre et al., 1998; Mba et al., 2001) were used for the genetic variability study. The SSR markers used in the present study are listed in Table 2. The reaction mixture (25 µl) consisted of 10X buffer, 100 mM each of dNTPs, 600 mM MgCl2, 600 pM of each forward and reverse primer (all from Banglore Genei), 0.5 U Taq polymerase (Finnzymes, Finland) and 25 ng of template DNA. PCR was carried out in a thermal cycler (MJ Research PTC-100, USA), under the following conditions: an initial denaturation at 94°C for 4 min followed by 40 cycles of 94°C for 1 min each, 35°C for 1 min and 72°C for 2 min and a final extension at 72°C for 5 min. The amplified DNA fragments were separated by agarose gel electrophoresis. Approximately 10 µl of the amplified products and a 1-kb molecular ruler were run for 2 h at 80 V on a 3% (w/v) agarose gel. PCR products from DNA bulks of the different accessions were each loaded into one lane. The different accessions were adjacent on each gel to enable the identification of different alleles, even in closely related accessions.
82
J. Stored Prod. Postharvest Res.
Table 2. Sequence of SSR primers used for amplification.
No 1 2 3 4 5 6 7 8 9 10 11 12 13 14 15 16 17 18 19 20 21 22 23 24 25 26 27 28 29 30 31 32 33 34 35 36
Left primers sequence GGTAGATCTGGATCGAGGAGG CGACAAGTCGTATATGTAGTATTCACG ACTGTGCCAAAATAGCCAAATAGT AGTGGAAATAAGCCATGTGATG AACTGTCAAACCATTCTACTTGC TGTCCAATGTCTTCCTTTCCTT TGTGACAATTTTCAGATAGCTTCA CAACAATTGGACTAAGCAGCA AGGTTGGATGCTTGAAGGAA CATTGGACTTCCTACAAATATGAAT GGAAACTGCTTGCACAAAGA AGTGCCACCTTGAAAGAGCA CGTTGATAAAGTGGAAAGAGCA CAGGCTCAGGTGAAGTAAAGG AAGGAACACCTCTCCTAGAATCA GTACATCACCACCAACGGGC AAGACAATCATTTTGTGCTCCA ACCACAAACATAGGCACGAG AACGTAGGCCCTAACTAACCC TCGAGTGGCTTCTGGTCTTC TCAAACAAGAATTAGCAGAACTGG GCAATGCAGTGAACCATCTTT GGCTGTTCGTGATCCTTATTAAC ATAGAGCAGAAGTGCAGGCG TCTCCTGTGAAAAGTGCATGA CATGCCACATAGTTCGTGCT ACAATTCATCATGAGTCATCAACT TTCCAGACCTGTTCCACCAT CGATCTCAGTCGATACCCAAG CCAGAAACTGAAATGCATCG GCTGAACTGCTTTGCCAACT TGAGAAGGAAACTGCTTGCAC TTGGCTGCTTTCACTAATGC CCTTGGCAGAGATGAATTAGAG ATCCTTGCCTGACATTTTGC ACAATGTCCCAATTGGAGGA
Right primers sequence CAATCGAAACCGACGATACA GCAGAGGTGGCTAACGAGAC TCATGAGTGTGGGATGTTTTTATG CCCATAATTGATGCCAGGTT GCCAGCAAGGTTTGCTACAT CTTTTTGCCAGTCTTCCTGC CACCATCGGCATTAAACTTTG CCTGCCACAATATTGAAATGG GGATGCAGGAGTGCTCAACT TGATGGAAAGTGGTTATGTCCTT CAGCAAGACCATCACCAGTTT TTGAGTGGTGAATGCGAAAG ACTCCACTCCCGATGCTCGC GCGAAAGTAAGTCTACAACTTTTCTAA CCAGCTGTATGTTGAGTGAGC AGAGCGGTGGGGCGAAGAGC TCAGAATCATCTACCTTGGCA CACCCAATTCACCAATTACCA ACAGCTCTAAAAACTGCAGCC CAAACATCTGCACTTTTGGC TGAGATTTCGTAATATTCATTTCACTT CGTTTGTCCTTTCTGATGTTC GTAGTTGAGAAAACTTTGCATGAG CTAACGCACACGACTACGGA TGTAAGGCATTCCAAGAATTATCA ACGCTATGATGTCCAAAGGC CCGTTATTGTTCCTGGTCCT ATTGCAGGGATTATTGCTCG CACTCCGTTGCAGGCATTA AACATGTGCGACAGTGATTG CTTCGGCCTCTACAAAAGGA CAGCAAGACCATCACCAGTTT TTGAACACGTTGAACAACCA GGGGCATTCTACATGATCAATAA TTCGCAGAGTCCAATTGTTG ACCATGGATAGAGCTCACCG
Product size NA 194 291 182 266 196 211 192 298 143 270 247 158 226 220 113 290 268 100 225 187 158 122 287 214 203 278 279 239 253 130 272 179 163 210 NA
NA- Not available.
The gels were stained in an EtBr solution (1 mg/L) for 15 min, rinsed in double distilled water for 15 min and observed under a Gel Doc System for DNA fragment analysis (Syngene).
scored for the presence (1), absence (0) or ambiguous (9) for each accession by visual inspection. To ensure accurate scoring, all markers were scored twice from two different gels. Loci were considered to be polymorphic if more than one allele was detected. Wright’s fixation index (F) was estimated using the formula:
Genetic diversity study F = 1-(Ho/He) Allelic frequencies of SSR markers were used to estimate the percentage of polymorphic loci (P), mean number of alleles per locus (A), effective number of alleles (AE), and observed heterozygosity (HE) (Hedrick, 2004) using the computational program POPGENE 32 (Yeh and Yang, 1999). DNA bands were
To quantify the lack of or excess heterozygosity, out-crossing rate (t) was estimated using t = (1-F)/ (1+F) (Weir, 1996). The portioning of genetic diversity within and among cassava cultivars was analyzed using F-statistics (Nei, 1973) according to the equations
Sreelekha
et
al
83
(A)
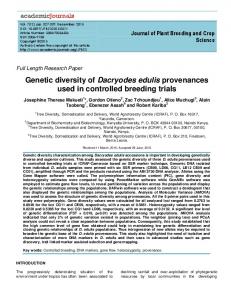
(B) Figure 1. Representative gels showing SSR marker profile of 17 (Lanes 1 to 17) released varieties (A) or central Kerala accessions (B). Lane M: 1-kb molecular weight marker.
of Weir and Cockerham (1984). Cluster analysis of the SSR data was performed separately with the assistance of the SIMQUAL programme of NTSYS software, version 2.10 (Applied Biostatistics Inc., Setauket, NY, USA). Similarity matrices were generated using DICE and simple matching coefficients. An unweighted pair grouping by mathematical averaging (UPGMA) cluster analysis was produced from similarity matrices constructed for SSR data and resulting dendrograms were compared. Principal component analysis (PCA) was applied to identify groups of primers which contributed to the variation among the genotypes and to identify groups of lines which showed a similar response to primers. PCA removes any intercorrelation that may exist between genotypes by transforming the original variables into a few hypothetical components. New PCAs are orthogonal to each other (Smith, 1991). Statistical analysis was done using SAS v. 8 (1999). A scatter diagram was plotted for the 36 primers using the scores obtained from first two principle components in the case of both released varieties and the
central Kerala cassava collections.
RESULTS Genetic diversity in cassava was evaluated using 12 released varieties and 24 central Kerala varieties of cassava with SSR primers. The primers utilized were highly informative. Each band produced by the primers was distinct and reproducible. The polymorphic bands produced were efficient in assessing genetic diversity among the cultivars. Band size ranged from 0.2 to 0.3 kb and the number of scorable bands per primer ranged from 1 to 2. SSR primers used in DNA amplifications resulted in scorable PCR bands or loci (Figure 1a and b).
84
J. Stored Prod. Postharvest Res.
Figure 2. Unweighed Pair Group Method with Arithmatic Average (UPGMA) dendrogram of 12 accessions of released variety of cassava collections based on SSR data. The dendrogram was constructed from the matrix of Dice’s similarity coefficients.
Based on SSR bands amplified by 36 primers, a total of 282 clear and scorable bands were detected for both released varieties and central Kerala collections using the 36 SSR primers and used for analysis using NTSYS software. The similarity matrix coefficient generated by the 282 SSR loci based on the NTSYS analysis ranged from 0.75 to 1.00 coefficients; the dendrogram obtained using UPGMA analysis in NTSYS software package revealed 6 distinct DNA cluster groups at 0.82 similarity coefficient units (Figure 2). Both released varieties of cassava and central Kerala varieties formed a distinct group and there was no overlapping of these two varieties. When the binary data from the 12 released varieties were treated alone in NTSYS, 10 DNA cluster groups were generated among the 12 released varieties (Figure 3) at 0.82 similarity coefficient units based on these morphological characters. Similarity index based on presence or absence of a specific band showed that the genetic similarity between varieties in this region varied from 60 to 93%. In cluster 1 vars. RV1 and RV2 were present: they have a dark green stem and light sepia leaf colour.
Cluster II includes var. RV3, which has special characters such as grey leaves. Cluster III included vars. RV4 and RV7. RV4 has a dark sepia stem colour and a fusiform-shaped tuber. RV7 has particular character such as light pink petioles and leaves. Only var. RV5 formed cluster IV; it has a long neck which is absent from accessions in other clusters. Cluster V consists of vars. RV6, RV8, RV9 and RV10, all of which have a reddishbrown stem and common characters such as a conical tuber. Var. RV12 was present in cluster VI. It is resistant to cassava mosaic disease (CMD) unlike all other varieties which are susceptible to CMD (Figure 4). Cluster VII consists of var. RV11 which is a medium height plant. Twenty four varieties collected from central Kerala were grouped into 6 clusters (Figure 5) at 0.82 similarity coefficient units based on there morphological characters; the genetic similarity between varieties in this region varied from 70 to 98%. Cluster I consisted of the major varieties, none of which had a neck. CK13 is the only variety in cluster II; it has special characters like narrow leaves. Cluster III consists of vars. CK19, CK20, CK21, CK22, CK23 and CK24, all of which have a small
Sreelekha
et
Figure 3. Unweighed Pair Group Method with Arithmatic Average (UPGMA) dendrogram of 24 accessions of cetral kerala collections based on the SSR data. The dendrogram was constructed from the matrix of Dice’s similarity coefficients.
Figure 4. Representative gel showing CMD-resistant variety (Lane 15).
al
85
86
J. Stored Prod. Postharvest Res.
Figure 5. Unweighed Pair Group Method with Arithmetic Average (UPGMA) dendrogram of 24 accessions of central Kerala collections based on the SSR data. The dendrogram was constructed from the matrix of Dice’s similarity coefficients.
or long neck. CK8 is the only variety present in cluster IV and it is an early cooking variety. CK15 and CK16 are grouped in cluster V and both have the same place of origin. Cluster VI consist of CK14 and it is an early maturing variety which matures in six months. The binary data generated from the 36 cassava cultivars were also subjected to PCA using SAS. The first three principal components contributed 28.16, 16.76 and 8.11%, respectively of the total variation present in the data. A scatter diagram of the first two principal components (Figure 6) shows the relationship between the primers. PCA helped to identify primers which contributed much to the variation present in the population. Population genetic analysis Population genetic analysis in different cassava accessions was done using POPGENE software. Each band produced was treated as a locus and variations among the alleles were calculated. The SSR markers used in the study could differentiate the genetic diversity in the cassava accessions. The genetic diversity of
cassava was revealed by the percentage of polymorphic loci (P), mean number of alleles per locus (AO), effective number of alleles (AE), observed heterozygosity (HO), and expected mean heterozygosity (HE). Each band obtained by SSR was treated as a gene locus and the homozygosity and heterozygosity for each loci was determined (Table 3a and b). The genetic analysis of released varieties of cassava accessions revealed that 100% heterozygosity was present in different accessions. The number of polymorphic loci and the percentage of polymorphic loci was 39 and 100%, respectively. The AO, AE, HO and HE were 2.000, 1.3486, 0.2407 and 0.2584, respectively (Table 4a). On the other hand, the collection of central Kerala cassava accessions revealed low percentage heterozygosity in different accessions except for the homozygous gene locus which expressed only in one allele at a time. The AO, AE, HO and HE were 1.7838, 1.5120, 0.2934 and 0.3386, respectively (Table 4b). The aforementioned data shows that new alleles are formed in a cassava population by random and natural processes of mutation and recombination while the frequency of occurrence of an allele changes regularly as a result of mutation, genetic drift and selection in released varieties of cassava.
Sreelekha
et
al
87
Figure 6. PCA of the studies varieties and accessions.
DISCUSSION Understanding genetic diversity in tuber crops is important as it is the first step in harnessing their phenotypic variability for crop improvement. Morphological traits are useful tools for preliminary evaluation because they offer a fast and useful approach for assessing the extent of diversity. The estimation of descriptive statistics of 11 different morphological traits studied in the present study revealed the existence of a high level of morphological diversity among the cassava accessions, providing scope for improvement through hybridization and selection. Morphological traits have commonly been used to express genetic diversity in cassava (Lefevre and Charrier, 1993; Haysom et al., 1994; Raghu et al., 2007; Sree Lekha and Pillai., 2008, 2010), although a number of genetic marker systems have also been used for the assessment of genetic
diversity of cassava germplasm. These include isozyme markers (Sarria et al., 1992), RFLP (Angel et al., 1992), RAPD (Tonukari et al., 1997; Ugorji, 1998) and SSR (Fregene et al., 2001; Sree Lekha and Pillai., 2008, 2010) markers and low or medium genetic diversity has always been observed. In the present study there was generally high genetic diversity between released varieties and the central Kerala collections, as shown by the dendrogram. There is no relationship between these two varieties even though they are collected from same place. The released varieties and the central Kerala varieties both form a distinct group and there is no overlapping of these two varieties observed in the dendrogram generated by NTSYS. The high differentiation between released varieties and central Kerala varieties suggests limited germplasm exchange between these two collections. SSR variation found within the released varieties of cassava was measured in terms of
88
J. Stored Prod. Postharvest Res.
Table 3a. Allelic frequencies of polymorphic loci studied in 12 cultivars of released cassava.
Locus
Allele
SSR1-A
0 1
Allelic frequency 0.9167 0.0833
Locus
Allele
SSR12-A
0 1
Allelic frequency 0.8333 0.1667
Locus
Allele
SSR24A
0 1
Allelic frequency 0.9167 0.0833
SSR2-A
0 1
0.7500 0.2500
SSR12-B
0 1
0.9167 0.0833
SSR25A
0 1
0.7500 0.2500
SSR3-A
0 1
0.9167 0.0833
SSR13-A
0 1
0.8333 0.1667
SSR26A
0 1
0.7500 0.2500
SSR4-A
0 1
0.8333 0.1667
SSR14-A
0 1
0.7500 0.2500
SSR27A
0 1
0.9167 0.0833
SSR4-B
0 1
0.7500 0.2500
SSR15-A
0 1
0.9167 0.0833
SSR28A
0 1
0.9167 0.0833
SSR5-A
0 1
0.8333 0.1667
SSR16-A
0 1
0.9167 0.0833
SSR29A
0 1
0.8333 0.1667
SSR5-B
0 1
0.5833 0.4167
SSR17-A
0 1
0.8333 0.1667
SSR30A
0 1
0.9167 0.0833
SSR6-A
0 1
0.9167 0.0833
SSR18A
0 1
0.3333 0.6667
SSR31A
0 1
0.9167 0.0833
SSR7-A
0 1
0.9167 0.0833
SSR19A
0 1
0.9167 0.0833
SSR32A
0 1
0.9167 0.0833
SSR8-A
0 1
0.9167 0.0833
SSR20A
0 1
0.9167 0.0833
SSR33A
0 1
0.8333 0.1667
SSR9-A
0 1
0.9167 0.0833
SSR21A
0 1
0.9167 0.0833
SSR34A
0 1
0.8333 0.1667
SSR10-A
0 1
0.9167 0.0833
SSR22A
0 1
0.8333 0.1667
SSR35A
0 1
0.5000 0.5000
SSR11-A
0 1
0.9167 0.0833
SSR23A
0 1
0.9167 0.0833
SSR36A
0 1
0.7500 0.2500
percentage of polymorphic loci, alleles per locus, or genetic diversity. They are indicative of high genetic differentiation within populations. The results showed that the level of polymorphism P (78.38%) in the central Kerala collections of cassava were lower than those from released varieties of cassava (100%). These results shows high level of polymorphism when compared to studies conducted by Okogbenin et al. (2006) and
Sreelekha et al. (2010) in old and new collections of cassava collected from India. The distribution of species observed in the dendrograms (Figures 2, 3 and 5) is coherent and clearly shows that the SSR and analytical methods used in this study are powerful tools for studying the genetic diversity of Manihot species. In this study the dendrograms clearly separate the released varieties from the accessions of the central
Sreelekha
et
al
89
Table 3b. Allelic frequencies of polymorphic loci studied in 24 cultivars of central Kerala cassava.
Locus
Allele
SSR1-A
0 1
Allelic frequency 0.3913 0.6087
Locus
Allele
SSR12-A
0 1
Allelic frequency 0.4167 0.5833
Locus
Allele
SSR24-A
0 1
Allelic frequency 0.8333 0.1667
SSR2-A
0 1
0.1667 0.8333
SSR13-A
0 1
**** 1.0000
SSR25-A
0 1
0.0417 0.9583
SSR3-A
0 1
0.7083 0.2917
SSR14-A
0 1
0.7917 0.2083
SSR26-A
0 1
0.7917 0.2083
SSR4-A
0 1
0.4583 0.5417
SSR15-A
0 1
0.4583 0.5417
SSR27-A
0 1
0.1667 0.8333
SSR5-A
0 1
0.2500 0.7500
SSR16-A
0 1
**** 1.0000
SSR28-A
0 1
**** 1.0000
SSR6-A
0 1
**** 1.0000
SSR17-A
0 1
0.9167 0.0833
SSR29-A
0 1
0.6250 0.3750
SSR7-A
0 1
0.6522 0.3478
SSR18-A
0 1
**** 1.0000
SSR30-A
0 1
0.3750 0.6250
SSR7-B
0 1
0.5833 0.4167
SSR19-A
0 1
0.4167 0.5833
SSR31-A
0 1
**** 1..0000
SSR8-A
0 1
0.3750 0.6250
SSR20-A
0 1
**** 1.0000
SSR32-A
0 1
0.1250 0.8750
SSR9-A
0 1
0.5417 0.4583
SSR21-A
0 1
0.7917 0.2083
SSR33-A
0 1
0.2917 0.7083
SSR10-A
0 1
0.5000 0.5000
SSR22-A
0 1
0.7917 0.2083
SSR34-A
0 1
0.3333 0. 6667
0
0.2917
1
0.7083
SSR11-A
SSR23-A
0
****
1
1.0000
SSR35-A
SSR36-A
Kerala collections. This clear partition into two groups is consistent with the concept that the two set of collections represent two different genetic entities. In a previous study in cassava with EST-SSR markers there was a marked separation between cultivated cassava accessions from their wild varieties (Raji et al., 2009). Studies conducted by Moyib et al. (2007) showed no
0
0.2083
1
0.7917
0 1
0.9583 0.0417
differentiation between the improved varieties and Nigerian collections while Kizito (2006) showed no differentiation between the cassavas collected from different districts of Uganda. The clustering pattern shown by released varieties showed much higher diversity than the central Kerala collections. The mean fixation index (F) for released varieties was 0.0688 and
90
J. Stored Prod. Postharvest Res.
Table 4. Genetic variation parameters of both old accessions and new accessions.
P Ao AE HO HE F t
Released varieties 100 2.00 1.35 0.24 0.26 0.068 0.396
Central Kerala varieties 78.38 1.78 1.51 0.29 0.34 0.13 0.43
P - Percentage of polymorphic loci, AO - mean number of allele per locus, AE mean effective number of alleles, HO - mean observed heterozygosity, HE mean expected heterozygosity, F - Wright’s fixation index, t - out crossing rate
that for central Kerala collection was 0.1337, indicating an overall conformance to Hardy-Weinberg equilibrium. The estimated F value, used to quantify an excess or deficiency of heterozygotes, was substantially higher than the mean value expected (0.05 or 5%), and positive, indicating an excess of homozygotic individuals. The excess of heterozygotes in released varieties may be the result of farmer selection during the domestication process, but an accumulation of somatic mutations can also contribute to the number of heterozygous genotypes (Birky, 1996). The out-crossing rate (t) based on fixation indices for released varieties was 0.3964 and that for the central Kerala collection was 0.4332, which is higher than the value in released varieties. da Silva et al. (2001) reported an out crossing rate of 0.69 to 1.00 among 8 ethnovarieties of cassava from Brazil. The population genetic analysis data further provides ample evidence for the fact that recombination events that have occurred in the central Kerala accessions could be due to natural selection. Apart from maintaining a high level of genetic diversity, the formation of new varieties also serves as an insurance against crop failure due to biotic and abiotic stresses. The unique diversity suggests that the germplasm might have genes, in high frequencies, for adaptation to the area, while the high genetic diversity implies a high amount of additive genetic variance, upon which progress in plant breeding depends. The differences in allele frequencies seen among landraces in this study are probably due to genetic drift effects subsequent to mutation. The unique and broad diversity of cassava landraces found in both collections reveals an invaluable germplasm resource for cassava improvement targeted to the region. The high level of differentiation between land races from both released varieties and central Kerala collections may represent a heterotic pool and provide an opportunity for the systematic exploitation of hybrid vigor in cassava. The two collections in the
present study gave different views of the amount of genetic variation and genetic relationships. The study of population genetics is increasingly important as we struggle to maintain healthy, wild and domestic populations and ecosystems, not only for cassava. Moreover, information on the population’s effective population size, heterozygosity levels and inbreeding coefficients for particular individuals can be used to design relocation or planned breeding programs which will help to maximize the genetic variation in successive generations. The current study provides a data-base for cassava breeders informed about choices in selection of parental accessions for use in a breeding program based on genetic diversity. The hierarchical clustering illustrated in a dendrogam is usually reflected in a PCA scatter plot. PCA analysis provides information about associations of accessions, which are useful to formulate better breeding strategies. It also helps to identify primers which contributed much to the variation present in the population. The results of this study, thereby, established a collection of 9 highly polymorphic SSR primers (SSRY26, SSRY11, SSRY12, SSRY10, SSRY30, SSRY16, SSRY31, SSRY22 and SSRY32) that could be readily used for genotype identification and genetic diversity studies in both released varieties and collections from the central part of Kerala. Therefore, application of few highly polymorphic SSR markers is possible for genetic variation studies in cassava and has thus great application for genetic studies on cassava in collections from around the world. This reduces the stress of applying many SSR primers for the identification of cassava cultivars in Kerala (and elsewhere) and hence, saves time and also cuts the cost of research studies for genetic diversity studies. Cluster analysis and PCA-based scatter plots showed great similarity among Brazilian cassava landraces (Siqueira et al., 2009). Lokko et al. (2009) also reported significant diversity within clusters among African land
Sreelekha
races of cassava through PCA analysis. ACKNOWLEDGEMENTS A grant provided by Kerala State Council for Science, Technology and Environment, Trivandrum to carry out this research is gratefully acknowledged. The authors express deep gratitude to the Director and Head of the Division (Crop Improvement), Central Tuber Crops Research Institute, Trivandrum for providing necessary facilities. The authors are also grateful to M. Fregene, CIAT, Cali, Colombia for scientific advice. The authors also express sincere gratitude to Ajay Kumar Mishra, Kamal Sharma and Sree Kumar for their support. REFERENCES Angel F, Giralde F, Gomez R, Iglesias C, Tohme J, Roca WM (1992). Use of RFLPs and RAPDs in cassava Genome. In: Roca WM, Thro AM (Eds) Cassava Biotechnology Network. Proceedings of the first international scientific meeting of cassava biotechnology network held at Centro Internacional de Agriculture Tropical (CIAT) Cartagena de Indias, Colombia. 25-28 August, 1992. CIAT Working Dec., pp. 62-64. Birky Jr. CW (1996). Heterozygosity, heteromorphy, and phylogenetic trees in asexual eukaryotes. Genetics, 144: 427-437. Chavarriaga-Aguirre P, Maya MM, Tohme J, Duque MC, Iglesias C, Bonierbale S, Kresovich MW, Kochert G (1999). Using microsatellites, isozymes and AFLPs to evaluate genetic diversity and redundancy in the cassava core collection and to assess the usefulness of DNA-based markers to maintain germplasm collections. Mol. Breed., 5: 263-273. Cock JH (1982). Cassava: A basic energy source in the tropics. Science, 218: 755-762. da Silva MR, Bandel G, Martins SP (2001). Mating system in an experimental garden composed of cassava (Manihot esculenta Cranz) ethnovarieties. Euphytica, 134: 127-135. Dellaporta SL, Word J, Hicks JB (1983). A plant DNA preparation. Plant Mol. Biol., 4: 19-21. Fregene M, Angel F, Gómez R, Rodríguez F, Chavarriaga P, Roca WM, Tohme J, Hokanson SC, Szewe-McFadden AK, Lamboy WF, McFerson JR (1997). Microsatellite (SSR) markers reveal genetic identities, genetic diversity and relationships in a Malusx domestica Borkh, core subset collection. Theor. Appl. Genet., 97: 671-683. Fregene M, Okogbenin E, Mba C, Angel F, Suárez MC, Janneth G, Chavarriaga P, Roca W, Bonierbale M, Tohme J (2001). Genome mapping in cassava improvement: Challenges, achievements and opportunities. Euphytica, 120(1): 159-165. Haysom HR, Chan TLC, Hughes MA (1994). Phylogenetic relationships of Manihot species revealed by restriction fragment length polymorphism. Euphytica, 76: 227-234. nd Hedrick PW (2004). Genetics of Populations (2 Edn), Jones and Bartlett Publishers, Sudbury, MA, USA, p. 382. Hokanson SC, Szewc-McFadden AK, Lambey WF, McFerson JR (1998). Microsatellite (SSR) markers reveal genetic identities, Genetic diversity and relationships in a Malus x domestica Borkh. Core subset collection. Theor. Appl. Genet., 97: 671-683. Hussain AW, Bushuk H, Ramírez F, Roca WM (1987). Identification of cassava (Manihot esculenta Crantz) cultivars by electrophoretic patterns of esterases enzymes. Seed Sci. Technol., 15: 19-21. Jones WO (1959). Manioc in Africa, Stanford University Press, p. 315. Kizito EB (2006). Genetic and root growth studies in cassava (Manihot esculenta Crantz): Implications for breeding. PhD Thesis, Swedish University of Agricultural Sciences, Sweden, p. 127. Online:
et
al
91
http://dissepsilon.slu.se:8080/archive/00001220/01/E.B._Kizito's_thes is.pdf. Lefèvre FA, Charrier S (1993). Isozyme diversity within African Manihot germplasm. Euphytica, 66: 73-80. Lokko Y, Dixon A, Offei S, Danquah E, Fregene M (2009). Assessment of genetic diversity among African cassava Manihot esculenta Grantz accessions resistant to the cassava mosaic virus disease using SSR markers. Genet. Resour. Crop Evol., 53: 1441-1453. Mba REC, Stephenson P, Edwards K, Melzer S, Nkumbira J, Gullberg J, Apel K, Gale M, Tohme J, Fregene M (2001). Simple sequence repeat (SSR) markers survey of the cassava (Manihot esculenta Crantz) genome: Towards an SSR- based molecular genetic map of cassava. Theor. Appl. Genet., 102: 21-31. Moyib OK, Odunola OA, Dixon AGO (2007). SSR markers reveal genetic variation between improved cassava cultivars and landraces within a collection of Nigerian cassava germplasm. Afr. J. Biotechnol., 6(23): 2666-2674. Nei M (1973). Analysis of gene diversity in subdivided populations. Proc. Nat. Acad. Sci. USA, 70: 3321-3323. Okogbenin E, Marin J, Fregene M (2006). An SSR based molecular genetic map of cassava. Euphytica 147(3): 433-440. Olsen K, Schaal B (2001). Microsatellite variation in cassava (Manihot esculenta), Euphorbiaceae and its wild relatives: Evidence for a southern Amazonian origin of domestication. Am. J. Bot., 88: 131142. Perera L, Rusell JR, Provan J, Powell W (2000). Use of microsatellite DNA markers to investigate the level of genetic diversity and population genetic structure of coconut (Cocos nucifera L.). Genome, 43(1): 15-21. Pillai SV (2002). Variability and genetic diversity in cassava. Indian J. Genet., 62: 242-244. Pillai SV, Manjusha SP, Sundaresan S (2004). Molecular diversity in the land races of cassava in India based on RAPD markers. Paper presented in the Sixth International Scientific meeting of the Cassava Biotechnology Network. CIAT, Cali, Colombia, March 8-14. p. 45 (Abstract). Raghu D, Senthil N, Saraswathi T, Raveendran M, Gnanam R, Venkadachalam R, Shanmughasundaram P, Mohan C (2007). Morphological and simple sequence repeats (SSR)-based fingerprinting of South Indian cassava germplasm. Int. J. Integ. Biol., 1(2): 142-148. Raji AAJ, Anderson JV, Kolade OA, Ugwu CD, Dixon AGO, Ingelbrecht IL (2009). Gene-based microsatellites for cassava (Manihot esculenta Crantz): Prevalence, polymorphisms, and cross-taxa utility. BMC Plant Biol., 9: 118. Rogers DJ, Appan SG (1973). Manihot manihotoides (Euphorbiaceae). Flora Neotropica. Hafner Press, New York, Monograph 13: 272. Sarria R, Ocampo C, Rodríguez H, Hershey C, Roca WM (1992). Genetics of esterase and glutamate oxaloacetate transaminases isozymes in Cassava. In: Roca WM, Thro AM (Eds) Proceedings of the First International Scientific Meeting of Cassava Biotechnology Network held at Centro Internacional de Agriculture Tropical (CIAT). Cassava Biotechnology Network, Cartagena de Indias Colombia 2528 August, CIAT Working Doc., pp. 62-64. Siqueira MVBM, Queiroz-Silva JR, Bressan EA, Borges A, Pereira KJC, Pinto JG, Veasey EA (2009). Genetic characterization of cassava (Manihot esculenta) landraces in Brazil assesses with simple sequence repeats. Genet. Mol. Biol., 32: 104-110. Smith GL (1991). Principal component analysis: An introduction. Anal. Proc., 28: 150-151. Sree Lekha S, Pillai SV (2008). SSR marker variability in a set of Indian cultivars from a typical cassava growing area. Asian Austral. J. Plant Sci. Biotechnol., 2 (2): 92-96. Sreelekha S, Kumar S, Pillai SV (2010). Assessing genetic diversity of Indian cassava: Acomparison of old and new collection using microsatellite markers. Asian Austral. J. Plant Sci. Biotechnol., 4(1): 43-52. Tautz D (1989). Hypervariability of simple sequences as a general source of polymorphic DNA markers. Nucl. Acid Res., 17: 6463-6471. Tonukari NJ, Thottapilly G, Ng NQ, Mignouna HD (1997). Genetic poly-
92
J. Stored Prod. Postharvest Res.
morphism of cassava within the Republic of Benin detected with RAPD markers. Afr. J. Crop Sci., 5(93): 219-228. Ugorji N (1998). Genetic characterization of cassava cultivars in Nigeria: Morphological and molecular markers. MSc Dissertation, University of Ibadan, Ibadan, Nigeria. Weir BS, Cockerham CC (1984). Estimating F-statistics for the analysis of population structure. Evolution, 38: 1358-1370.
Weir BS (1996). Genetic Data Analysis II, Sinauer Associates, Sunderland, MA, p. 445. Yeh FC, Yang R (1999). Microsoft Window-based Freeware for Population Genetic Analysis (POPGENE Ver. 1.31). University of Alberta, AB, Canada.
.