The Journal of Nutrition Nutritional Epidemiology
Genetic Variation in Stearoyl-CoA Desaturase 1 Is Associated with Metabolic Syndrome Prevalence in Costa Rican Adults1–3 Jian Gong,4 Hannia Campos,5 Stephen McGarvey,4 Zhijin Wu,4 Robert Goldberg,6 and Ana Baylin4,7* 4 Department of Community Health, Brown University, Providence, RI; 5Department of Nutrition, Harvard School of Public Health, Boston, MA; 6Department of Quantitative Health Sciences, University of Massachusetts Medical School, Worcester, MA; and 7 Department of Epidemiology, School of Public Health, University of Michigan, Ann Arbor, MI
Abstract Stearoyl-CoA desaturase 1 (SCD1) activity, a key regulator of lipid metabolism, may be associated with the development of metabolic syndrome (MetS). We examined the association of genetic variation in the SCD1 gene with the occurrence of MetS and its five components in a population of Costa Rican adults (n = 2152; mean age, 58 y; range, 18–86 y). Associations of tag single nucleotide polymorphisms (tagSNP) of the SCD1 gene with prevalence of MetS and its five components were analyzed by use of log-Poisson models with robust variance estimates and linear regression models, respectively. The likelihood ratio was used to test potential gene-fatty acid interactive effects with adipose tissue a-linolenic acid. One tagSNP (rs1502593) was significantly associated with an increased prevalence of MetS in the total study sample. Compared with the common homozygous CC genotype, the CT and TT genotypes for rs1502593 were associated with higher prevalence ratios (PR) of MetS for CT vs. CC: [PR = 1.22 (95% CI = 1.03, 1.44)] and for TT vs. CC [PR = 1.24 (95% CI = 1.01, 1.52)]. Among women, we observed borderline positive associations between systolic blood pressure and fasting blood sugar levels and rs1502593 (P = 0.05 and 0.06). Compared to the common haplotype (frequency $ 5%) with no minor alleles of SCD1 tagSNP, the other two observed common haplotypes carrying the rs1502593 minor allele were significantly associated with elevated prevalence of MetS. No gene-fatty acid interactive effects were observed. Our results suggest that genetic variation in the SCD1 gene may play a role in the development of MetS. J. Nutr. 141: 2211–2218, 2011.
Introduction SCD18, mainly found in adipose and liver tissue, is a key regulator of lipid metabolism. It converts SFA substrates (palmitic acid and stearic acid) to MUFA (palmitoleic acid and oleic acid) (1). MUFA generated by SCD1 are key substrates for the formation of TG and phospholipids that play important roles in cellular and metabolic functions (1–3). Animal studies suggest that SCD1 activity plays an important role in metabolic changes (3,4). SCD1 activity influences plasma HDL and LDL levels in mice (5) and SCD1-null mice have low levels of plasma TG (6). SCD1 knockout mice are protected from diet-induced
1
Supported by the NIH (HL49086, HL60692, and HL081549). Author disclosures: J. Gong, H. Campos, S. McGarvey, Z. Wu, R. Goldberg, and A. Baylin, no conflicts of interest. 3 Supplemental Table 1 is available from the “Online Supporting Material” link in the online posting of the article and from the same link in the online table of contents at jn.nutrition.org. 8 Abbreviations used: ALA, a-linolenic acid; BP, blood pressure; FBS, fasting blood sugar; FDR, false discovery rate; GWAS, genome-wide–association study; MetS, metabolic syndrome; PR, prevalence ratio; SCD1, stearoyl-CoA desaturase 1; SNP, single nucleotide polymorphism; tagSNP, tag single nucleotide polymorphism. * To whom correspondence should be addressed. E-mail:
[email protected]. 2
obesity and insulin resistance even under overfeeding conditions (1,7,8). If these patterns can be extrapolated to humans, then SCD1 might be a potential target to treat metabolic disorders, including obesity and MetS. However, other study results have shown that SCD1 may provide protection against lipotoxicity (i.e., inflammation and insulin resistance) from SFA through converting them into less toxic MUFA (9–11). Upregulated SCD1 expression is also inversely correlated with inflammation and insulin resistance in vivo (12). An inverse relation between elevated SCD1 mRNA levels and insulin resistance was observed among obese and diabetic/insulin-resistant patients treated with Rosiglitazone (13,14). In addition, SCD1 may play a role in lowering BP through its effect on cell membrane fluidity on sodiumpotassium transports by modifying the proportion of unsaturated fatty acids in cell membrane (15–17). Obesity, insulin sensitivity, BP, HDL cholesterol, and plasma TG are the five major components of MetS and all of them are correlated with SCD1. Previous studies in diverse populations such as Caucasian, Hispanics, African American, and Asian have showed that composite and individual MetS traits are heritable (h2 between 0.24 and 0.63) (18–23). Costa Rica has a high prevalence of MetS (24). The objective of the present study
ã 2011 American Society for Nutrition. Manuscript received April 25, 2011. Initial review completed June 19, 2011. Revision accepted September 15, 2011. First published online November 2, 2011; doi:10.3945/jn.111.143503.
2211
was to examine the association between genetic variation in the SCD1 gene and prevalence of MetS using data from a large population-based study in Costa Rica. Further, SCD1 expression can be suppressed by ALA [18:3(n-3)] (17,25–27) and low levels of ALA are associated with increased risk of MetS (28). A secondary study goal was to explore potential gene-fatty acid interactive effects between SCD1 and adipose tissue ALA on the occurrence of MetS.
Methods Study population. The participants in this study were 2274 controls who were included in a case-control study of nonfatal myocardial infarction conducted in the Central Valley of Costa Rica between 1994 and 2004 (29,30). Population-based controls were randomly selected by matching initial cases of nonfatal myocardial infarction for age (65 y), sex, and area of residence (county) according to the information available from the National Census and Statistics Bureau of Costa Rica. Therefore, controls are representative of the general population within matching strata. The participation rate for controls was 88%. All participants gave written informed consent and the study was approved by the Human Subjects Committee of the Harvard School of Public Health and the University of Costa Rica. Data collection. Trained personnel visited all study participants at their homes to collect data by using a questionnaire with closed-ended questions, biological specimens, and anthropometric measurements (height, weight, BP, waist/hip diameter, and skinfold thickness). Biological specimens were collected in the morning at the participant’s home after an overnight fast as described in detail elsewhere (30). A s.c. adipose tissue biopsy was collected from the upper buttock with a 16gauge needle and disposable syringe following procedures previously described (31). Blood samples (20 mL) were drawn during the same visit in tubes containing 0.1% EDTA after a 12- to 14-h fast. Tubes of blood were immediately stored at 48C and protected from light. Within 36 h, they were centrifuged at 1430 3 g for 20 min at 48C to isolate and divide the plasma and white blood cells into aliquots. Blood samples were sealed and stored in liquid nitrogen at 2808C until analysis in the laboratory. BP was collected in the morning after participants had voided urine and rested for 10 min, while the participant seated and by using mercury sphygmomanometers. Standardization for BP measurements was based on the procedures described in the Dietary Approaches to Stop Hypertension (DASH), National Heart Lung and Blood Institute (NHLBI). Anthropometric measurements were collected by fieldworkers with participants wearing light clothing and without shoes. All measurements were performed in duplicate and the mean was used for analyses (29,30). TagSNP selection and genotyping. SCD1 gene is on chr10q24.31. The tagging approach of Carlson et al. (32) (i.e. linkage disequilibrium selection) was implemented to select SNP over a region including the SCD1 gene and ;10 kb upstream and 4 kb downstream of the gene, using the Caucasian HapMap database. Ten SNP were selected as tagSNP based on a pairwise r2 ($0.8) and minor allele frequency ($0.05). DNA samples were extracted from frozen buffy coats using the Qiagen QIAamp DNA Blood kit. Genotyping was performed using the SNPlex Genotyping System from Applied Biosystems (33,34) with an ABI PRISM 3130XL DNA Analyzer (Applied Biosystems). Data were collected, formatted, processed, and analyzed using the GeneMapper Analysis software (V 4.0, Applied Biosystems), which assigned individual genotypes. Three of the 10 tagSNP (rs2060792, rs17559878, and rs3829160) had poor genotyping results, i.e., ,80% of the samples were able to be genotyped or violated the Hardy-Weinberg equilibrium (P , 0.001). These SNP were excluded from further analysis. The genetic characteristics of the remaining seven tagSNP (rs735877, rs1502593, rs11190483, rs3071, rs11557927, rs508384, and rs1393491) are shown in Supplemental Table 1. 2212
Gong et al.
Haplotype analysis. The seven tagSNP (Supplemental Table 1) were used for haplotype analysis. Haplotypes were analyzed using a SAS macro (35) that uses the SAS HAPLOTYPE procedure to estimate haplotype frequencies and possibilities of each haplotype pair and to calculate expected haplotype scores (under additive models) conditional on observed genotypes. Only common haplotypes (i.e., haplotype frequency $5%) were included for further association analyses. The expected haplotype scores under additive models (36,37) were used in the evaluation of the association between SCD1 haplotypes and prevalence of MetS. Laboratory analysis. ALA from adipose tissue was quantified by GLC as previously described (38). Peak retention times and area percentages of total fatty acids were identified by injecting known standards (NuCheck Prep) and analyzed with Agilent Technologies ChemStationA.08.03 software. Twelve duplicate samples, indistinguishable from the others, were analyzed throughout the study. The CV for ALA is 3.9%. Plasma cholesterol, TG, and HDL cholesterol levels were measured with an Abbott Diagnostics ABA-200 bichromatic analyzer and Abbott A-Gent enzymatic reagents (39). Cholesterol measurements were standardized according to the program specified by the CDC and the National Heart, Lung and Blood Institute. Blood glucose was analyzed by using an Accu-Check II Blood Glucose Monitor with Chemstrip bG Test Strips (Boehringer-Mannheim Diagnostics) as previously described (39). Inference of population admixture. The population of Central Valley of Costa Rica derived from the recent admixture of a relatively small number of founders of Spanish, Amerindian, and West African origin (40). Its expansion has occurred mostly by reproduction (40). We genotyped 39 ancestry informative markers and used the ADMIXMAP software (41,42) to estimate individual admixture proportions (i.e. the probability of belonging to West African, American Indian, and European). Details of selecting ancestry informative markers and calculating individual admixture proportions were previously described (40). These individual admixture proportions were used to adjust for confounding due to ancestry. MetS. According to the definition used in the National Cholesterol Education Program’s Adult Treatment Panel III report (43), participants having three or more of the following criteria were classified as having MetS: abdominal obesity (waist circumference .102 cm for men and .88 cm for women), hypertriglyceridemia (plasma TG $1.7 mmol/L), low HDL cholesterol (,1.0 mmol/L for men and ,1.3 mmol/L for women), high BP ($130/85 mm Hg), and high glucose (fasting blood glucose $5.5 mmol/L). Statistical analysis. After eliminating participants with missing values for the individual components of MetS and the SNP that were used to assess the individual admixture proportions, there were 2152 participants included in our analysis. Based on the study sample size, the prevalence of MetS in our study population (36%), and a significance level of 0.01, with a minor allele frequency of 25%, we would have 80% power to detect a RR .1.16 under additive genetic models. t tests for continuous variables and chi-square tests for categorical variables were applied to test the differences in means or distributions of lifestyle and other variables for participants with and without MetS. PR and 95% CI were estimated to analyze the association of MetS with SCD1 SNP and haplotypes using log-Poisson models with robust variances (44). Codominant and additive genetic models for SNP and additive genetic models for haplotypes were used. Linear regression models combined with additive genetic models were also implemented to examine the relationship between tagSNP of the SCD1 gene and 1) each component of MetS and 2) desaturation index of SCD1 (measured by 16:1/16:0 or 18:1/18:0 in adipose tissue, which indirectly reflects SCD1 activity). Each component of MetS and SCD1 desaturation index were treated as continuous variables and skewed variables were log-transformed before analysis. Because there were substantial differences between men and women in the development of MetS in previous studies (45–47), we also performed stratification analysis on the association between SCD1 genetic variants and MetS according to sex. Models were adjusted for individual admixture proportions and age.
To address the problem of multiple comparisons, the FDR was calculated (48). The FDR controls the expected proportion of incorrectly rejected null hypotheses in terms of the type I error (a). So far, no conventional FDR significant threshold for significance has been defined. We used 0.20 as the threshold for significance, i.e., 20% of significant discoveries based on an a = 0.05 should be expectedly false (49,50). Gene-fatty acid multiplicative interactive effects on MetS were assessed using continuous ALA levels and genotypes of SCD1 tagSNP through likelihood ratio tests of log-Poisson regression models with 2 terms (i.e. SCD1 SNP and ALA) compared to the log-Poisson regression model with three terms (i.e., SCD1 SNP, ALA, and the interaction term between the two). Gene-fatty acid additive interactive effects on MetS were examined, due to the model restriction, using dichotomized ALA levels in adipose tissue and assuming minor allele dominant/recessive through likelihood ratio tests for the constrained log-Poisson regression model (i.e., constrained on PRG*E = PRG only+ PRE only 21, G: genetic variation in SCD1; E: ALA) compared to the unconstrained log-Poisson regression model with three terms: genetic variation of SCD1, ALA, and interaction term. The cut point for dichotomizing ALA levels in adipose
TABLE 1
tissue was defined as the 80th percentile of its levels in our study population. This decision was based on our previous study results regarding ALA. We found that in our study population, participants in the highest quintile of ALA in adipose tissue had a lower risk of MetS and nonfatal acute myocardial infarction compared to those in the lowest quintile (28,29). All analyses were carried out with SAS (version 9.1; SAS Institute).
Results A total of 770 participants (36% of the sample) met the National Cholesterol Education Program’s Adult Treatment Panel III report definition of MetS (Table 1). Among individual components of MetS, hypertriglyceridemia (70%), low HDL cholesterol (64%), and high BP (43%) were most common in our sample. The mean age of participants with and without MetS was 61 and 57 y, respectively. Participants with MetS were more
Characteristics of the Costa Rican adult population according to MetS status (n = 2152)1 MetS
Variables Age Sex, % female Individual admixture proportion, % European American Indian West African Urban residence, % Income, US $/mo Waist:hip ratio Current smoker, % EE on daily activity, MET/d Dietary variables Total energy intake, Mcal/d Total fat, % energy Saturated fat, % energy Monounsaturated fat, % energy Polyunsaturated fat, % energy Trans fat, % energy Carbohydrate, % energy Protein, % energy Cholesterol, g/d Fatty acids in adipose tissue: g/100 g total fatty acid Stearic acid, 18:0 Oleic acid, 18:1(n-9) Palmitic acid, 16:0 Palmitoleic acid, 16:1(n-7) ALA, 18:3(n-3) EPA, 20:5(n-3) DHA, 22:6(n-3) Linoleic acid, 18:2(n-6) Arachidonic acid, 20:4(n-6) Components of MetS, % Abdominal obesity Hypertriglyceridemia Low HDL cholesterol High BP High fasting glucose
Yes (n = 770)
No (n = 1382)
P
61 6 102 39.4
57 6 12 19.6
,0.001 ,0.001
57.4 38.6 3.96 38.7 567 6 423 0.97 6 0.08 15.1 33.4 6 13.1
58.0 38.2 3.84 40.2 570 6 428 0.94 6 0.07 25.1 36.7 6 17.4
0.14 0.21 0.45 0.51 0.92 ,0.001 ,0.001 ,0.001
2.37 32.0 10.4 11.8 6.38 1.35 55.2 13.3 0.29
6 0.772 6 5.41 6 2.61 6 3.51 6 2.08 6 0.65 6 6.96 6 2.20 6 0.17
2.50 31.8 10.4 11.9 6.10 1.30 55.5 12.8 0.30
6 0.763 6 6.10 6 2.73 6 4.11 6 1.98 6 0.64 6 7.54 6 2.07 6 0.17
,0.001 0.29 0.68 0.45 0.002 0.10 0.38 ,0.001 0.20
2.45 42.3 21.0 7.18 0.62 0.042 0.152 15.3 0.52
6 0.85 6 2.96 6 2.75 6 2.28 6 0.20 6 0.022 6 0.053 6 3.70 6 0.13
2.92 42.1 21.5 6.30 0.67 0.038 0.139 15.7 0.44
6 1.02 6 3.18 6 2.74 6 2.11 6 0.21 6 0.021 6 0.052 6 3.87 6 0.14
,0.001 0.14 ,0.001 ,0.001 ,0.001 ,0.001 ,0.001 0.05 ,0.001
5 58 51 23 5
,0.001 ,0.001 ,0.001 ,0.001 ,0.001
53 91 86 80 36
Values are mean 6 SD. Using the definition from the National Cholesterol Education Program’s Adult treatment Panel III report. ALA, a-linolenic acid; BP, blood pressure; EE, energy expenditure; MetS, metabolic syndrome; MET, metabolic equivalent.
1
SCD1 genetic variant and metabolic syndrome
2213
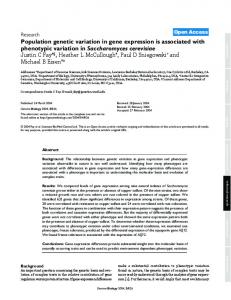
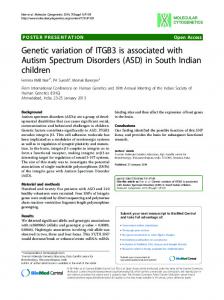
likely to be women, less likely to be physically active, and had a higher waist:hip ratio than did participants without MetS. Participants with MetS had lower ALA in adipose tissue (P , 0.01), whereas adipose tissue arachidonic acid was higher (P , 0.01). We did not observe significant differences in the mean admixture proportions between participants with and without MetS (Table 1). Among the seven tagSNP of the SCD1 gene, rs1502593 was significantly associated with MetS. Under the co-dominant model adjusted for individual admixture proportion and age, compared with the common homozygous CC genotype, the CT and TT genotypes for rs1502593 were associated with an increased prevalence of MetS for CT compared to CC: [PR = 1.22 (95% CI = 1.03, 1.44)] and for TT compared to CC [PR = 1.24 (95% CI = 1.01, 1.52)] (Table 2). Under additive models adjusted for individual admixture proportion and age, we observed a similar association between MetS and rs1502593 (P = 0.02; FDR = 0.17) (Fig. 1). In the stratification analysis according to sex, we observed significant associations between rs1502593 and the prevalence of MetS only among women (Table 3). Among women, under additive models the PR of MetS for CT compared to CC and for TT compared to CC were 1.25 (95% CI = 1.09, 1.43) and 1.56 (95% CI = 1.19, 2.04), respectively; under co-dominant models, the PR of MetS for CT compared to CC and for TT compared to CC were 1.34 (95% CI = 1.05, 1.71) and 1.56 (95% CI = 1.18, 2.06), respectively (Table 3). Because the association between MetS and rs1502593 was significant only among women, we restricted further detailed analyses for components of MetS, desaturation indexes, and fatty acid interactions to women. In the analysis of the relation between components of MetS and rs1502593 among women, we observed significant associations of rs1502593 only with systolic BP (P-trend = 0.02; FDR = 0.11) and FBS (P-trend = 0.04; FDR = 0.11) after adjusting for individual admixture proportion. When we additionally adjusted for age, these associations became borderline significant (P-trend = 0.05, FDR = 0.12 for systolic BP; P-trend = 0.06, FDR = 0.12 for
TABLE 2
Risk of MetS and SCD1 tagSNP in the Costa Rican adult sample (n = 2152)1
SNP
Genotype
PR
rs735877
AG vs. GG AA vs. GG CT vs. CC TT vs. CC CT vs. CC TT vs. CC GT vs. TT GG vs. TT GT vs. TT GG vs. TT AC vs. CC AA vs. CC CT vs. TT CC vs. TT
1.10 1.05 1.22 1.24 0.94 1.11 1.00 1.14 1.00 0.56 0.96 1.06 0.94 1.03
rs1502593 rs11190483 rs3071 rs11557927 rs508384 rs1393491
1
95% CI 0.96 0.87 1.03 1.01 0.83 0.90 0.88 0.91 0.86 0.21 0.84 0.77 0.83 0.74
1.27 1.27 1.44 1.52 1.07 1.36 1.14 1.43 1.17 1.53 1.10 1.47 1.07 1.44
P2 0.16 0.60 0.02 0.04 0.38 0.34 0.98 0.24 0.98 0.26 0.57 0.71 0.37 0.85
Global P3 0.37
Gong et al.
FBS) (Fig. 2). Women homozygous for the minor allele of rs1502593 (i.e., TT genotype) tended to have higher systolic BP (P-trend = 0.05) and fasting blood glucose (P-trend = 0.06). The 2 desaturation indexes of SCD1 (16:1/16:0 and 18:1/18:0) in adipose tissue tended to be lower in carriers of the minor allele (P-trend = 0.09 and 0.12, respectively) (Table 4). Next, we estimated haplotypes with a frequency $0.05 (Table 5). After adjustment for individual admixture proportion and age, compared to the most common haplotype, G-C-C-T-TC-T (a combination of wild alleles of the 7 SCD1 tagSNP), the haplotypes A-T-T-G-T-C-T (minor alleles in rs735877, rs1502593, rs11190483, and rs3071) and A-T-C-T-T-C-T (minor alleles in rs735877 and rs1502593) were associated with higher prevalence of MetS but were not significant (Table 5). Consistent with the SNP analysis, after stratification by sex, only women had a significant positive association between MetS prevalence and haplotypes A-T-T-G-T-C-T [PR = 1.37 (95% CI = 1.14, 1.66)] and A-T-C-T-T-C-T [PR = 1.37 (95% CI = 1.07, 1.76)] (Table 5).
0.03 0.33 0.51 0.36 0.77 0.63
PR, prevalence ratio; MetS, metabolic syndrome; SNP, single nucleotide polymorphism. Co-dominant genetic models were carried out; adjusted for individual admixture proportion and age. 2 P was 2-sided. 3 Global P is from score test.
2214
FIGURE 1 Association between SCD1 tagSNP and prevalence of MetS under additive genetic models in the Costa Rican adult sample (n = 2152). Log P-trend is shown in the y axis. Horizontal line: P = 0.05. MetS, metabolic syndrome; SNP, single nucleotide polymorphism.
TABLE 3
Association of rs1502593 and risk of MetS by sex in the Costa Rican adult sample (n = 2152)1
Gender
Model
Male
Additive
Female
Additive
Male
Co-dominant
Female
Co-dominant
Genotype
PR2
CT vs. CC TT vs. CC CT vs. CC TT vs. CC CT vs. CC TT vs. CC CT vs. CC TT vs. CC
1.06 1.12 1.25 1.56 1.17 1.10 1.34 1.56
95% CI 0.93 0.86 1.09 1.19 0.94 0.83 1.05 1.18
1.21 1.46 1.43 2.04 1.46 1.46 1.71 2.06
P 0.68 ,0.01 0.15 0.52 0.02 ,0.01
1 Likelihood ratio test P value for the multiplicative interaction between sex and rs1502593 = 0.068. MetS, metabolic syndrome. 2 PR, prevalence ratio; adjusted for individual admixture proportion and age.
FIGURE 2 Association between rs1502593 and components of MetS under additive genetic model among women in Costa Rica (n = 574). Log P-trend is shown in the y axis. Horizontal line: P = 0.05. DBP, diastolic blood pressure, FBS, fasting blood sugar; MetS, metabolic syndrome; SBP, systolic blood pressure; WC, waist circumference.
We did not observe significant interactions (multiplicative or additive) between rs1502593 and ALA in this study (for multiplicative interaction, likelihood ratio test X2 = 1.12, df = 1, P = 0.29; for additive interaction, likelihood ratio test X2 = 2.40, df = 1, P = 0.12). In the analysis of additive interaction effects, the minor allele T for rs1502593 was assumed dominant.
Discussion In this study, we identified one tagSNP (rs1502593) of the SCD1 gene that was significantly associated with an increased prevalence for MetS. After correction for multiple testing, this association remained significant. In a stratified analysis according to sex, we observed significant associations only between rs1502593 and MetS prevalence among women. In the haplotype analysis of seven tagSNP of the SCD1 gene, two observed common haplotypes carrying the rs1502593 minor allele were
TABLE 4
significantly associated with elevated prevalence of MetS among women. Our results suggest that genetic variation in the SCD1 gene may play a role in the development of MetS. We observed that gender modified the association between rs1502593 and MetS occurrence. Gender differences in MetS have been observed in previous studies (45–47), but the modifying effect of gender on development of MetS from genetic variation has not, to our knowledge, been studied before. Studies in animals indicate that estrogen suppressed SCD1 expression (51,52). Therefore, differential hormone levels (e.g. estrogen) may explain the observed effect modification by gender. We found borderline significant associations between systolic BP and waist circumference and rs1502593 among women. Although no significant correlation was observed between rs1502593 and desaturation indexes of SCD1 in adipose tissue among women, we observed a trend toward low adipose tissue desaturation indexes of SCD1 among minor allele (T) carriers and participants homozygous for the minor allele T had the smallest mean value of SCD1 desaturation indexes in adipose tissue (Table 4). Together, these results may indicate that increased SCD1 activity may reduce inflammation and insulin resistance from SFA and that SCD1 is involved in BP regulation. Consistent with our study results, recent studies in vivo and in animals suggest that elevated SCD1 expression in adipose tissue, human muscle, and endothelial cells is positively correlated with insulin sensitivity (11,12,53). The conflicting results in insulin sensitivity from SCD1 knocked-out mice may be explained by the compensatory effects of activation of AMP-activated protein kinase against insulin resistance (12). Our results support the hypothesis that SCD1 may affect BP regulation through its role in maintaining cell membrane fluidity (16,17,54). In a previous study, the association between SCD1 variation and type 2 diabetes was investigated, but no significant associations were detected (55). However, it was pointed out that this failure of detecting significant associations did not exclude the possibility that the SCD1 variants under study (or others) influence intermediate traits relevant to pathogenesis of type 2 diabetes (55). A study of Swedish males found that SCD1 polymorphisms that decreased SCD1 activity were associated with reduced BMI and waist circumstance as well as improved insulin sensitivity (56). Our results indicated that among women, genetic variation in SCD1, which decreased SCD1 activity, was positively associated with FBS levels, although the association did not reach significance. The possible reasons for
Adipose tissue desaturation indices of SCD1 and individual components of MetS by rs1502593 genotype among women in Costa Rica1 Genotype of rs1502593
Desaturation index 16:1/16:0 18:1/18:0 Waist circumference, cm Plasma TG, mmol/L Systolic BP, mm Hg Diastolic BP, mm Hg HDL cholesterol, mmol/L Fasting blood glucose, mmol/L
CC
CT
TT2
P-trend3
0.37 (0.35, 0.40) 20.2 (19.0, 21.6) 84.6 (82.9, 84.6) 9.2 (8.5, 9.9) 137 (134, 141) 78 (76, 80) 2.4 (2.3, 2.5) 4.2 (4.0, 4.5)
0.36 (0.35, 0.38) 19.8 (19.0, 20.7) 87.7 (86.5, 88.9) 10.5 (9.9, 11.0) 139 (136, 141) 80 (79, 81) 2.4 (2.3, 2.5) 4.4 (4.2, 4.6)
0.34 (0.31, 0.37) 18.6 (17.1, 20.2) 86.8 (84.6, 89.0) 9.9 (8.9, 10.9) 144 (139, 149) 79 (76, 82) 2.4 (2.3, 2.5) 4.6 (4.3, 5.0)
0.09 0.12 0.06 0.14 0.05 0.43 0.80 0.06
Values are mean (95% CI), n = 574. BP, blood pressure. MetS, metabolic syndrome. Minor allele for rs1502593: T. 3 Models were adjusted for individual admixture proportion and age. 1 2
SCD1 genetic variant and metabolic syndrome
2215
TABLE 5
Associations between common haplotypes in SCD1 and MetS risk in the Costa Rican sample (n = 1410)1
Haplotype G-C-C-T-T-C-T2 A-T-T-G-T-C-T A-T-C-T-T-C-T G-C-C-T-T-C-T A-T-T-G-T-C-T A-T-C-T-T-C-T G-C-C-T-T-C-T A-T-T-G-T-C-T A-T-C-T-T-C-T
Total
Women
Men
Frequency
PR
0.35 0.24 0.10 0.36 0.23 0.08 0.35 0.24 0.10
1.0 1.14 1.18 1.0 1.37 1.37 1.0 1.01 1.08
95% CI — 1.00 0.98 — 1.14 1.07 — 0.83 0.84
— 1.31 1.41 — 1.66 1.76 — 1.22 1.38
P value — 0.07 0.08 — ,0.01 0.01 — 0.94 0.57
1 PR were estimated by use of log-Poisson regression model using the most common haplotype as the referent group; adjusted for individual admixture proportion and age. MetS, metabolic syndrome; PR, prevalence ratio; SNP, single nucleotide polymorphism. 2 The order of SNP in the haplotype is rs735877, rs1502593, rs11190483, rs3071, rs11557927, rs508384, and rs1393491.
this difference are as follows. The Swedish study did not include women. Furthermore, it did not investigate the SNP rs1502593, which was found associated with FBS levels in our study (the pairwise r2 of the SNP in the Swedish study with rs1502593 were ,0.4). Finally, it comprised a different ethnic study population than in our study. Two GWAS of the MetS recently have been published, one among Indian Asian men (57) and another one in participants of European ancestry (58). Both studies confirmed known associations with components of MetS (i.e., cholesteryl ester transfer protein and HDL cholesterol). However, there was no evidence of variants common to all the traits of the syndrome. This is consistent with the fact that the MetS is a complex and illdefined phenotype (59). SCD1 variants were not among the variants found in any of the GWAS. However, GWAS are not designed to detect very small effects, particularly for complex disorders, and therefore, candidate genes should not be totally excluded based exclusively on GWAS findings (60). ALA [18:3(n-3)] can suppress SCD1 expression (17,25–27) and in our sample, adipose tissue ALA level, which is a biomarker of dietary ALA intake (38), was inversely related to two desaturation indexes of SCD1 in adipose tissue (r2 = 20.20, P , 0.001 for 18:1/18:0; r2 = 20.19, P , 0.001 for 16:1/16:0). Previous studies showed that low levels of ALA are associated with increased risk of MetS (24,28). Therefore, interactions between the SCD1 gene and ALA on the risk of MetS could be plausible. However, we did not observe either multiplicative or additive interactions between rs1502593 and ALA on the prevalence of MetS. The small sample size in the gene-fatty acid interaction analysis may be one reason for no detection of interaction effects. In addition, the categorization process may, however, have contributed to a loss of power to detect additive interaction effects. Thus, more flexible models for testing additive interactions between genes and environmental variables need to be developed. Our study has several limitations. Because Latinos are not well represented in the HapMap database, we used the Caucasian HapMap database to pick tagSNP of SCD1. However, it has been shown that the Caucasian HapMap database is transferable to Latino populations (61). Three of the 10 tagSNP were excluded in the analysis because of a high rate of missing genotyping and violation of the Hardy-Weinberg equilibrium (P , 0.001). Therefore, it is possible that common genetic variation within 2216
Gong et al.
the SCD1 gene was not comprehensively covered and the three excluded tag SNP may be associated with MetS. We also cannot exclude the possibility of association between rare variants in the SCD1 gene and the risk of MetS. We used an arbitrary value of 0.20 as a FDR significant threshold. Although this threshold value has been used in other genetic association studies (49,50) and it has been proposed as a reasonable value for candidate gene studies (49), studies on the threshold for the FDR are warranted. Had we used a more conservative threshold such as 0.05, our results should be considered null. Nonetheless, because this was a candidate gene study with a strong a priori hypothesis based on animal models and we tested only seven tagSNP, we think that a value of 0.20 is still realistic. We used adipose tissue desaturation indexes as a proxy of SCD1 activity. Although SCD1 activity measured by the desaturation indexes is not measuring true enzyme activity, adipose tissue desaturation indexes have been shown to reflect SCD1 gene expression in adipose tissue (62). Nonetheless, SCD1 activity was estimated only in adipose tissue. SCD1 activity in other target tissues such as muscle, liver, and skin should also be measured and evaluated if we are to fully understand the potential mechanism involved in the relationship between the SCD1 gene and MetS. Our study results may not be generalized into other populations, because tagSNP of the SCD1 may be different when different population databases are used for tagSNP selection. Furthermore, the results were found in a middle-aged population and therefore results cannot be generalized to younger populations. Finally, we cannot rule out the possibility of chance in our findings. Our findings provide a stimulus for replicating these results in other populations and finding causal genetic variants of the SCD1 gene. In addition, the underlying biological mechanisms of the SCD1 on the development of MetS require further study in different population settings. Acknowledgments J.G., H.C., and A.B. designed research; H.C. and A.B. conducted research; J.G. analyzed data; J.G., H.C., S.M., R.G., Z.W., and A.B. wrote the paper; and J.G. and A.B. had primary responsibility for final content. All authors read and approved the final manuscript.
Literature Cited 1. 2.
3. 4. 5. 6.
7.
8.
Ntambi JM, Miyazaki M. Recent insights into stearoyl-CoA desaturase1. Curr Opin Lipidol. 2003;14:255–61. Smith CM, Marks AD, Lieberman MA, Marks DB. Synthesis of fatty acids, triacylglycerols, and the major membrane lipids. Marks’ basic medical biochemistry: a clinical approach. 2nd ed. Philadelphia: Lippincott Williams & Wilkins; 2005. p. xii, 977. Ntambi JM, Miyazaki M. Regulation of stearoyl-CoA desaturases and role in metabolism. Prog Lipid Res. 2004;43:91–104. Ntambi JM, Miyazaki M, Dobrzyn A. Regulation of stearoyl-CoA desaturase expression. Lipids. 2004;39:1061–5. Flowers MT, Ntambi JM. Role of stearoyl-coenzyme A desaturase in regulating lipid metabolism. Curr Opin Lipidol. 2008;19:248–56. Attie AD, Krauss RM, Gray-Keller MP, Brownlie A, Miyazaki M, Kastelein JJ, Lusis AJ, Stalenhoef AF, Stoehr JP, Hayden MR, et al. Relationship between stearoyl-CoA desaturase activity and plasma triglycerides in human and mouse hypertriglyceridemia. J Lipid Res. 2002;43:1899–907. Ntambi JM, Miyazaki M, Stoehr JP, Lan H, Kendziorski CM, Yandell BS, Song Y, Cohen P, Friedman JM, Attie AD. Loss of stearoyl-CoA desaturase-1 function protects mice against adiposity. Proc Natl Acad Sci USA. 2002;99:11482–6. Miyazaki M, Kim YC, Ntambi JM. A lipogenic diet in mice with a disruption of the stearoyl-CoA desaturase 1 gene reveals a stringent
9.
10.
11.
12.
13.
14.
15.
16.
17. 18.
19.
20.
21.
22.
23.
24.
25. 26.
27.
requirement of endogenous monounsaturated fatty acids for triglyceride synthesis. J Lipid Res. 2001;42:1018–24. Staiger K, Staiger H, Weigert C, Haas C, Haring HU, Kellerer M. Saturated, but not unsaturated, fatty acids induce apoptosis of human coronary artery endothelial cells via nuclear factor-kappaB activation. Diabetes. 2006;55:3121–6. Kausch C, Staiger H, Staiger K, Krutzfeldt J, Matthaei S, Haring HU, Stumvoll M. Skeletal muscle cells from insulin-resistant (non-diabetic) individuals are susceptible to insulin desensitization by palmitate. Horm Metab Res. 2003;35:570–6. Peter A, Weigert C, Staiger H, Rittig K, Cegan A, Lutz P, Machicao F, Haring HU, Schleicher E. Induction of stearoyl-CoA desaturase protects human arterial endothelial cells against lipotoxicity. Am J Physiol Endocrinol Metab. 2008;295:E339–49. Peter A, Weigert C, Staiger H, Machicao F, Schick F, Machann J, Stefan N, Thamer C, Haring HU, Schleicher E. Individual stearoyl-coa desaturase 1 expression modulates endoplasmic reticulum stress and inflammation in human myotubes and is associated with skeletal muscle lipid storage and insulin sensitivity in vivo. Diabetes. 2009; 58:1757–65. Rise´rus U, Tan GD, Fielding BA, Neville MJ, Currie J, Savage DB, Chatterjee VK, Frayn KN, O’Rahilly S, Karpe F. Rosiglitazone increases indexes of stearoyl-CoA desaturase activity in humans: link to insulin sensitization and the role of dominant-negative mutation in peroxisome proliferator-activated receptor-gamma. Diabetes. 2005;54:1379–84. Gurnell M. ’Striking the right balance’ in targeting PPARgamma in the metabolic syndrome: novel insights from human genetic studies. PPAR Res. 2007;2007:83593. Aguilar PS, de Mendoza D. Control of fatty acid desaturation: a mechanism conserved from bacteria to humans. Mol Microbiol. 2006; 62:1507–14. Corrocher R, Pagnan A, Ambrosio GB, Ferrari S, Olivieri O, Guarini P, Bassi A, Piccolo D, Gandini A, Girelli D. Effects induced by olive oilrich diet on erythrocytes membrane lipids and sodium-potassium transports in postmenopausal hypertensive women. J Endocrinol Invest. 1992;15:369–76. Ntambi JM. Regulation of stearoyl-CoA desaturase by polyunsaturated fatty acids and cholesterol. J Lipid Res. 1999;40:1549–58. Loos RJ, Katzmarzyk PT, Rao DC, Rice T, Leon AS, Skinner JS, Wilmore JH, Rankinen T, Bouchard C. Genome-wide linkage scan for the metabolic syndrome in the HERITAGE Family Study. J Clin Endocrinol Metab. 2003;88:5935–43. Lin HF, Boden-Albala B, Juo SH, Park N, Rundek T, Sacco RL. Heritabilities of the metabolic syndrome and its components in the Northern Manhattan Family Study. Diabetologia. 2005;48:2006–12. Austin MA, Edwards KL, McNeely MJ, Chandler WL, Leonetti DL, Talmud PJ, Humphries SE, Fujimoto WY. Heritability of multivariate factors of the metabolic syndrome in nondiabetic Japanese Americans. Diabetes. 2004;53:1166–9. Zhang S, Liu X, Yu Y, Hong X, Christoffel KK, Wang B, Tsai HJ, Li Z, Tang G, Xing H, et al. Genetic and environmental contributions to phenotypic components of metabolic syndrome: a population-based twin study. Obesity (Silver Spring). 2009;17:1581–7. Bastarrachea RA, Kent JW Jr, Rozada G, Cole SA, Lopez-Alvarenga JC, Aradillas C, Brito-Zurita O, Cerda-Flores RM, Ibarra-Costilla E, Gallegos E, et al. Heritability and genetic correlations of metabolic disease-related phenotypes in Mexico: preliminary report from the GEMM Family Study. Hum Biol. 2007;79:121–9. McQueen MB, Bertram L, Rimm EB, Blacker D, Santangelo SLA. QTL genome scan of the metabolic syndrome and its component traits. BMC Genet. 2003;4 Suppl 1:S96. Williams ES, Baylin A, Campos H. Adipose tissue arachidonic acid and the metabolic syndrome in Costa Rican adults. Clin Nutr. 2007;26: 474–82. Ntambi JM. Dietary regulation of stearoyl-CoA desaturase 1 gene expression in mouse liver. J Biol Chem. 1992;267:10925–30. Sessler AM, Kaur N, Palta JP, Ntambi JM. Regulation of stearoyl-CoA desaturase 1 mRNA stability by polyunsaturated fatty acids in 3T3–L1 adipocytes. J Biol Chem. 1996;271:29854–8. Bellenger J, Bellenger S, Clement L, Mandard S, Diot C, Poisson JP, Narce M. A new hypotensive polyunsaturated fatty acid dietary combination regulates oleic acid accumulation by suppression of
28.
29.
30.
31.
32.
33. 34. 35. 36.
37.
38. 39.
40.
41.
42.
43.
44. 45.
46.
47.
48.
49.
stearoyl CoA desaturase 1 gene expression in the SHR model of genetic hypertension. FASEB J. 2004;18:773–5. Truong H, DiBello JR, Ruiz-Narvaez E, Kraft P, Campos H, Baylin A. Does genetic variation in the Delta6-desaturase promoter modify the association between alpha-linolenic acid and the prevalence of metabolic syndrome? Am J Clin Nutr. 2009;89:920–5. Baylin A, Kabagambe EK, Ascherio A, Spiegelman D, Campos H. Adipose tissue alpha-linolenic acid and nonfatal acute myocardial infarction in Costa Rica. Circulation. 2003;107:1586–91. Campos H, Siles X. Siesta and the risk of coronary heart disease: results from a population-based, case-control study in Costa Rica. Int J Epidemiol. 2000;29:429–37. Beynen AC, Katan MB. Rapid sampling and long-term storage of subcutaneous adipose-tissue biopsies for determination of fatty acid composition. Am J Clin Nutr. 1985;42:317–22. Carlson CS, Eberle MA, Rieder MJ, Yi Q, Kruglyak L, Nickerson DA. Selecting a maximally informative set of single-nucleotide polymorphisms for association analyses using linkage disequilibrium. Am J Hum Genet. 2004;74:106–20. Livak KJ. Allelic discrimination using fluorogenic probes and the 59 nuclease assay. Genet Anal. 1999;14:143–9. Livak KJ. SNP genotyping by the 59-nuclease reaction. Methods Mol Biol. 2003;212:129–47. Kraft P. 2004 [cited May 2010]. Available from: http://www.hsph. harvard.edu/faculty/kraft/soft.htm. Zaykin DV, Westfall PH, Young SS, Karnoub MA, Wagner MJ, Ehm MG. Testing association of statistically inferred haplotypes with discrete and continuous traits in samples of unrelated individuals. Hum Hered. 2002;53:79–91. Stram DO, Leigh Pearce C, Bretsky P, Freedman M, Hirschhorn JN, Altshuler D, Kolonel LN, Henderson BE, Thomas DC. Modeling and EM estimation of haplotype-specific relative risks from genotype data for a case-control study of unrelated individuals. Hum Hered. 2003;55: 179–90. Baylin A, Kabagambe EK, Siles X, Campos H. Adipose tissue biomarkers of fatty acid intake. Am J Clin Nutr. 2002;76:750–7. Campos H, Bailey SM, Gussak LS, Siles X, Ordovas JM, Schaefer EJ. Relations of body habitus, fitness level, and cardiovascular risk factors including lipoproteins and apolipoproteins in a rural and urban Costa Rican population. Arterioscler Thromb. 1991;11:1077–88. Ruiz-Narva´ez EA, Bare L, Arellano A, Catanese J, Campos H. West African and Amerindian ancestry and risk of myocardial infarction and metabolic syndrome in the Central Valley population of Costa Rica. Hum Genet. 2010;127:629–38. Hoggart CJ, Parra EJ, Shriver MD, Bonilla C, Kittles RA, Clayton DG, McKeigue PM. Control of confounding of genetic associations in stratified populations. Am J Hum Genet. 2003;72:1492–504. McKeigue PM, Carpenter JR, Parra EJ, Shriver MD. Estimation of admixture and detection of linkage in admixed populations by a Bayesian approach: application to African-American populations. Ann Hum Genet. 2000;64:171–86. Executive Summary of The Third Report of The National Cholesterol Education Program (NCEP) Expert Panel on Detection, Evaluation, a Treatment of High Blood Cholesterol In Adults (Adult Treatment Panel III). JAMA. 2001;285:2486–97. Spiegelman D, Hertzmark E. Easy SAS calculations for risk or prevalence ratios and differences. Am J Epidemiol. 2005;162:199–200. Ahonen T, Saltevo J, Laakso M, Kautiainen H, Kumpusalo E, Vanhala M. Gender differences relating to metabolic syndrome and proinflammation in Finnish subjects with elevated blood pressure. Mediators Inflamm. 2009;2009:959281. Regitz-Zagrosek V, Lehmkuhl E, Weickert MO. Gender differences in the metabolic syndrome and their role for cardiovascular disease. Clin Res Cardiol. 2006;95:136–47. Hwang LC, Bai CH, Chen CJ, Chien KL. Gender difference on the development of metabolic syndrome: a population-based study in Taiwan. Eur J Epidemiol. 2007;22:899–906. Benjamini Y, Hochberg Y. Controlling the false discovery rate: a practical and powerful approach to multiple testing. J R Stat Soc, B. 1995;57:289–300. Goulart AC, Rexrode KM, Cheng S, Rose L, Buring JE, Ridker PM, Zee RY. Association of genetic variants with the metabolic syndrome in
SCD1 genetic variant and metabolic syndrome
2217
50.
51.
52.
53.
54.
55.
20,806 white women: The Women’s Health Genome Study. Am Heart J. 2009;158:257–62 e1. Smith NL, Hindorff LA, Heckbert SR, Lemaitre RN, Marciante KD, Rice K, Lumley T, Bis JC, Wiggins KL, Rosendaal FR, et al. Association of genetic variations with nonfatal venous thrombosis in postmenopausal women. JAMA. 2007;297:489–98. Lundholm L, Zang H, Hirschberg AL, Gustafsson JA, Arner P, Dahlman-Wright K. Key lipogenic gene expression can be decreased by estrogen in human adipose tissue. Fertil Steril. 2008;90:44–8. Paquette A, Wang D, Jankowski M, Gutkowska J, Lavoie JM. Effects of ovariectomy on PPAR alpha, SREBP-1c, and SCD-1 gene expression in the rat liver. Menopause. 2008;15:1169–75. Cao H, Gerhold K, Mayers JR, Wiest MM, Watkins SM, Hotamisligil GS. Identification of a lipokine, a lipid hormone linking adipose tissue to systemic metabolism. Cell. 2008;134:933–44. Popeijus HE, Saris WH, Mensink RP. Role of stearoyl-CoA desaturases in obesity and the metabolic syndrome. Int J Obes (Lond). 2008;32: 1076–82. Liew CF, Groves CJ, Wiltshire S, Zeggini E, Frayling TM, Owen KR, Walker M, Hitman GA, Levy JC, O’rahilly S, et al. Analysis of the contribution to type 2 diabetes susceptibility of sequence variation in the gene encoding stearoyl-CoA desaturase, a key regulator of lipid and carbohydrate metabolism. Diabetologia. 2004;47:2168–75.
2218
Gong et al.
56. Warensjo¨ E, Ingelsson E, Lundmark P, Lannfelt L, Syvanen AC, Vessby B, Riserus U. Polymorphisms in the SCD1 gene: associations with body fat distribution and insulin sensitivity. Obesity (Silver Spring). 2007;15:1732–40. 57. Zabaneh D, Balding DJ. A genome-wide association study of the metabolic syndrome in Indian Asian men. PLoS ONE. 2010;5:e11961. 58. Kraja AT, Vaidya D, Pankow JS, Goodarzi MO, Assimes TL, Kullo IJ, Sovio U, Mathias RA, Sun YV, Franceschini N, et al. A bivariate genome-wide approach to metabolic syndrome: STAMPEED consortium. Diabetes. 2011;60:1329–39. 59. Eckel RH, Alberti KG, Grundy SM, Zimmet PZ. The metabolic syndrome. Lancet. 2010;375:181–3. 60. Michel S, Liang L, Depner M, Klopp N, Ruether A, Kumar A, Schedel M, Vogelberg C, von Mutius E, von Berg A, et al. Unifying candidate gene and GWAS approaches in asthma. PLoS ONE. 2010;5:e13894. 61. de Bakker PI, Burtt NP, Graham RR, Guiducci C, Yelensky R, Drake JA, Bersaglieri T, Penney KL, Butler J, Young S, et al. Transferability of tag SNP in genetic association studies in multiple populations. Nat Genet. 2006;38:1298–303. 62. Sjo¨gren P, Sierra-Johnson J, Gertow K, Rosell M, Vessby B, de Faire U, Hamsten A, Hellenius ML, Fisher RM. Fatty acid desaturases in human adipose tissue: relationships between gene expression, desaturation indexes and insulin resistance. Diabetologia. 2008;51:328–35.