MAJOR ARTICLE
Geographic Expansion of Lyme Disease in the Southeastern United States, 2000–2014 Paul M. Lantos,1,2 Lise E. Nigrovic,4 Paul G. Auwaerter,5 Vance G. Fowler Jr.,3 Felicia Ruffin,3 R. Jory Brinkerhoff,6,7 Jodi Reber,8 Carl Williams,8 James Broyhill,9 William K. Pan,10,11 and David N. Gaines9 Divisions of 1Pediatric Infectious Diseases, and 2General Internal Medicine, and 3Infectious Diseases, Duke University School of Medicine, Durham, North Carolina; 4Division of Emergency Medicine, Boston Children’s Hospital, Massachusetts; 5Division of Infectious Diseases, Johns Hopkins Medical Institutions, Baltimore, Maryland; 6Department of Biology, University of Richmond, Virginia; 7University of KwaZulu-Natal, Westville, South Africa; 8 North Carolina Department of Public Health, Raleigh; 9Virginia Department of Health, Richmond; 10Duke Global Health Institute, and 11Nicholas School of the Environment, Duke University, Durham, North Carolina
Background. The majority of Lyme disease cases in the United States are acquired on the east coast between northern Virginia and New England. In recent years the geographic extent of Lyme disease has been expanding, raising the prospect of Lyme disease becoming endemic in the southeast. Methods. We collected confirmed and probable cases of Lyme disease from 2000 through 2014 from the Virginia Department of Health and North Carolina Department of Public Health and entered them in a geographic information system. We performed spatial and spatiotemporal cluster analyses to characterize Lyme disease expansion. Results. There was a marked increase in Lyme disease cases in Virginia, particularly from 2007 onwards. Northern Virginia experienced intensification and geographic expansion of Lyme disease cases. The most notable area of expansion was to the southwest along the Appalachian Mountains with development of a new disease cluster in the southern Virginia mountain region. Conclusions. The geographic distribution of Lyme disease cases significantly expanded in Virginia between 2000 and 2014, particularly southward in the Virginia mountain ranges. If these trends continue, North Carolina can expect autochthonous Lyme disease transmission in its mountain region in the coming years. Keywords. Lyme disease; epidemiology; GIS; North Carolina; Virginia.
Lyme disease is a multisystem bacterial infection caused by Borrelia burgdorferi and transmitted by Ixodes species ticks. With between 30 000 and 300 000 new cases per year, Lyme disease is the most common vectorborne infectious disease in the United States [1, 2]. Approximately 90% of all cases in the United States are acquired along the east coast between northern Virginia (VA) and northern New England, with most
Received 10 June 2015; accepted 24 September 2015. Correspondence: Paul M. Lantos, MD, DUMC 100800, Durham, NC 27710 ( paul.
[email protected]). Open Forum Infectious Diseases © The Author 2015. Published by Oxford University Press on behalf of the Infectious Diseases Societyof America. This is an Open Access article distributed under the terms of the Creative Commons Attribution-NonCommercial-NoDerivs licence (http:// creativecommons.org/licenses/by-nc-nd/4.0/), which permits non-commercial reproduction and distribution of the work, in any medium, provided the original work is not altered or transformed in any way, and that the work is properly cited. For commercial re-use, please contact
[email protected]. DOI: 10.1093/ofid/ofv143
of the remainder in Minnesota and Wisconsin. The 2013 incidence of Lyme disease in VA was 11.2 cases per 100 000 population [1]. North Carolina (NC), by contrast, had an incidence of 0.4 cases per 100 000, an incidence similar to other southeastern states that have been generally considered nonendemic. This is corroborated by entomologic studies in which host-seeking Ixodes nymphs that harbor B burgdorferi have been absent in NC and states further south [3, 4]. In recent years, however, surveillance efforts in VA have revealed a sustained increase in cases in southern reaches of the state, including counties near the NC border. Since 2009, 5 counties in NC have met clinical surveillance criteria for endemic Lyme disease [5]. In this study, we report the results of spatial and spatiotemporal analyses of Lyme disease case data from the Virginia Department of Health (VDH) and the North Carolina Department of Public Health (NCDPH) from 2000 to 2014. Geographic Expansion of Lyme Disease in the Southeastern United States
•
OFID
•
1
MATERIALS AND METHODS The Duke University Human Subjects Committee considered the study protocol exempt form committee review. The VDH and the NCDPH both approved the study protocol. Data Sources
The VDH and the NCDPH provided case records of probable and confirmed Lyme disease cases collected between 2000 and 2014. Each case report included patient residential zip code and year of diagnosis. Spatial data layers included zip code centroid points, zip code polygons, and county polygons. Each of these data sources included population estimates from the 2010 United States Census. These were obtained through the Esri (Redlands, CA) online data services. A topographic relief basemap layer was obtained through the Esri online data service to provide cartographic context. Case Definitions
Cases of Lyme disease were aggregated by the VDH and NCDPH according to the Centers of Disease Control and Prevention (CDC) surveillance definitions. Three case definitions were active during this period: the 1996 definition (for 2000– 2007 cases), the 2008 definition (for 2008–2010 cases), and the 2011 definition (for 2011–2014 cases) [6–8]. Until 2008, the CDC only classified cases as “confirmed”; the subsequent definitions have classified cases as “suspected,” “probable,” or confirmed. For this study we pooled probable and confirmed cases, but we excluded suspected cases. Geoprocessing
We used ArcGIS 10.3 (Esri) for all geoprocessing and cartographic operations. ArcGIS is a geographic information system (GIS) program that allows datasets, such as case data, environmental data, and census data, to be combined in digital “layers” based on shared geography. We obtained a map of zip code polygons from the US Census and displayed this in ArcGIS using a projected coordinate system. A data file containing case counts per zip code per year was attached to this zip code map using 5-digit zip code as a common field. Annual Increase in Cases
To illustrate which regions were experiencing the steepest increase in cases over baseline, we calculated the absolute interval change in cases for each 2-year interval at each zip code. These interval changes were then averaged over the fourteen 2-year intervals in the data set. We then used empiric Bayesian kriging to display these data as a continuous surface over the study area.
randomness of the entire dataset), and we performed local cluster analyses to identify discrete foci of disease clustering within the study region. For global cluster analysis, we used the Oden’s Ipop method in ClusterSeer (BioMedWare, Ann Arbor, MI). This is an adaptation of the Moran’s I autocorrelation analysis that adjusts for underlying population density [9]. We analyzed all cases in aggregate 2000 through 2014 for this analysis. Minor topological errors in the zip code polygon map (eg, self-intersecting and overlapping borders) required that we perform this 1 global analysis using data aggregated at the county level. To detect local clusters, we used the Kulldorff spatial scanning statistic in SatScan (Martin Kulldorff, Boston, MA) [10]. We selected the discrete Poisson model, which adjusts count data for population. For baseline population data, we used 2010 Census data for zip code tabulation areas. We specified circular scanning windows with a maximal spatial cluster size of 2% of the population at risk and maximal cluster radius of 30 kilometers. We chose this restrictive scanning window as the default setting (50% of the underlying population) is known to produce large, unwieldy clusters that can overlap nonendemic areas [11]. We performed this analysis for three 5-year groups of case data: 2000–2004, 2005–2009, and 2010–2014. Statistical significance was determined with 999 Monte Carlo randomizations. SatScan, as with other local cluster detection methods, performs a statistical analysis at every geographic location in the study region. To minimize the impact of multiple comparisons, we only retained clusters with a P value under .0001. The resulting clusters were categorized into 3 groups based on log likelihood ratio. For visualization, we clipped the circular clusters to the boundaries of zip code polygons whose geometric center fell within the cluster. Zip code polygons falling beneath multiple clusters were assigned to the highest log likelihood ratio group. Zip code polygons were removed from a cluster if they had had no reported cases of Lyme disease during the 5year interval represented by that cluster. Spatiotemporal Cluster Analysis
We used SatScan to identify spatiotemporal clusters with a minimum 3-year temporal window. We again used the discrete Poisson model, and scanning parameters were identical to those described for the purely spatial analysis. As before, we only retained clusters with a P < .0001, then we clipped them to the boundaries of the underlying zip code polygons. When zip codes fell beneath multiple clusters, we assigned them to the temporal cluster of longest duration. RESULTS Case Data
Spatial Cluster Analysis
We performed a cluster analysis to detect global spatial autocorrelation of Lyme disease cases (departure from spatial 2
•
OFID
•
Lantos et al
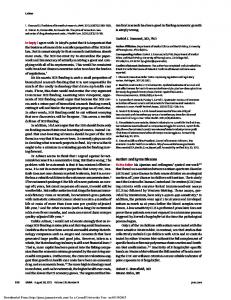
Between 2000 and 2014, there were 11 597 confirmed and probable cases of Lyme disease registered by the VDH and NCDPH in 1104 individual zip codes (Figure 1A). After removing cases
Figure 1. (A) Confirmed and probable Lyme disease cases in Virginia and North Carolina, 2000–2014. A marked and sustained increase in cases occurred in Virginia after 2006, although no such trend was observed in North Carolina. Note surveillance definition changes in 2008 and 2011. (B) Average annual increase in cases. Year-to-year differences in cases were calculated for each 2-year interval and at each zip code location. The average of these interval differences was then computed at each zip code, then interpolated using empirical Bayesian kriging to produce a continuous surface. The greatest average year-to-year increase in Lyme disease cases occurred in southwestern Virginia.
with no zip code location, with a zip code falling outside of VA or NC, or with a disease onset date before the beginning of the study period, 11 304 cases remained. Of these, 10 040 cases
(88.8%) had been registered by the VDH and 1266 (11.2%) by the NCDPH. The number of Lyme disease cases increased overall during the 15-year study period with increases solely
Geographic Expansion of Lyme Disease in the Southeastern United States
•
OFID
•
3
reflecting trends in VA. Virginia had registered fewer than 400 cases per year between 2000 and 2006. In 2007 there were 957 cases, however, and by 2014 the case count had climbed to 1346. During this same time period, the NCDPH had registered between 24 and 179 cases per year, a figure that oscillated without a sustained trend. The steepest average annual increase was exhibited in southwest VA, near the cities of Lynchburg, Roanoke, and Blacksburg (Figure 1B). Cluster Analyses
The Oden’s Ipop analysis indicated statistically significant global clustering (Ipop 5.66, P = .000000) over the entire 15-year study period. We grouped the case data by 35-year intervals to analyze how local clustering changed over time. (Figure 2) During the 2000–2004 interval, 3 regions had statistically significant local clusters of Lyme disease: northern VA, the Delmarva Peninsula in eastern VA, and the coastal area near Jacksonville, NC. The cluster in northern VA markedly expanded toward the southwest during the subsequent decade (2005–2014), and the statistical strength of the clustering increased as well. Clustering
Figure 2. Scanning statistic local cluster analysis. The primary cluster of Lyme disease in northern Virginia was present throughout the study period. Clustering in southwest Virginia was first detected in 2005–2009. In both of these regions, the geographic extent and the log likelihood ratio both increased throughout the study period. No significant clustering was detected in North Carolina except for a small coastal region during 2000– 2004. 4
•
OFID
•
Lantos et al
in southwest VA, near Roanoke, Lynchburg, and Blacksburg was first detected in the 2005–2009 interval. By the 2010–2014 time period, this spatial cluster had become large, statistically strong, and nearly contiguous with the expanding cluster from northern VA. The clustering along coastal VA weakened over this time period. No clustering in NC was detected after 2004. The spatiotemporal cluster analysis identified 126 discrete clusters of between 4 and 13 years duration; 100 of these had a P value under .0001 and are presented in Figure 3. Clusters of at least 7 years duration were all concentrated in northern VA near the Maryland border and on the Delmarva and VA peninsulas. The shortest duration clusters (4–6 years) were prominently located (1) along the Appalachian chain between Charlottesville and the NC border and (2) flanking the southeast border of the older clusters in northern VA. DISCUSSION Between 2000 through 2014, VA saw a marked increase in total Lyme disease case volume as well as expansion of geographic reach. These trends were most evident in northern VA, which is both populous and geographically contiguous with the highly endemic states farther north. This region experienced both intensification of case volume and an increase in its spatial extent. This expansion occurred slowly southeast towards the Richmond-Petersburg metropolitan area and more rapidly southwest along the Appalachians. The southern Appalachian area of VA, near the cities of Lynchburg, Roanoke, and Blacksburg, has been experiencing consistent growth and intensification of cases at least since 2005. Despite considerable growth in population, particularly in the large population centers of Charlotte and Raleigh, there was no appreciable expansion of case volume in NC during this 14-year study period. Our population-adjusted cluster analyses did not highlight any statistically significant concentrations of cases in this state. If the spatial trends seen in VA continue, however, we should anticipate a growth in autochthonous cases in NC in the coming years, particularly in the northern NC mountains. If favorable mountain ecology is driving geographic expansion of Lyme disease, we may also see expansion into the mountainous areas of neighboring states, such as Kentucky, West Virginia, and Tennessee. One notable finding is the sudden but sustained increase in Lyme disease cases in VA beginning in 2007, a phenomenon that was simultaneously observed in virtually all states with a high Lyme disease incidence [1]. This increase, including the continuing increase observed since then, cannot be explained by either a change in case definition or by a change in surveillance efforts. The case definitions adopted in 2008 and 2011 were generally stricter than the previous case definition that had been used through 2007. In particular, these definitions standardized the criteria necessary for laboratory confirmation. Laboratory-based case surveillance in NC and VA began in
Figure 3. Spatiotemporal scanning statistic cluster analysis. This analysis was limited to spatial clusters of at least 3 years duration and a P value of ≤.0001, ensuring that only significant and durable trends were identified. Clusters of longest duration were in northern and eastern Virginia, and the most recently emergent clusters extended along the Appalachian Mountains towards southwest Virginia.
2008, after the increase in cases that appeared in 2007. Unresolved hypotheses include (1) climatological factors making 2007 a more conducive year for tick and/or reservoir mammal survival and (2) the effects of the national real estate “boom” during those years on land use and human residential patterns. Surveillance for questing B burgdorferi-infected nymphs is widely regarded as a direct and specific measure of human Lyme disease risk. The largest systematic tick collection study in the eastern United States found few Ixodes scapularis nymphs west of coastal VA [3]. Of these, B burgdorferi-infected nymphs were only identified on the VA-Maryland border. However, the tick collections for this study had been completed by 2007. Subsequent studies have identified an increasing density of B burgdorferi-infected ticks in forested regions near Charlottesville, Roanoke, and Blacksburg with highest tick densities and highest tick infection prevalence at higher-elevation sites [12]. Furthermore, the ticks identified bear a stronger genetic resemblance to the northern I scapularis clades than their southern cousins, and population genetic analysis of VA ticks is consistent with
spatial and numerical expansion [13]. In sum, these findings demonstrate spatiotemporal expansion of tick vectors for human Lyme disease, particularly along the Appalachians, consistent with our reported trends in human case surveillance. Our study has several limitations. First, it is well recognized that Lyme disease cases are underreported by as much as 90% [14]. Second, surveillance definitions leave room for misclassification of cases. False-positive misclassification may occur for numerous reasons, including the retrospective process of public health case reviews, misdiagnosis of skin lesions as erythema migrans [15], and coincidentally positive serologic tests in individuals with alternative diagnoses [16]. False-positive cases are likely to be most influential in regions with low disease transmission, whereas in highly endemic areas they are quantitatively overwhelmed by true cases. Third, the ability of a state public health program to adequately address these biases can be strongly influenced by resource allocation and manpower, and both the VDH and NCDPH faced workforce limitations over the period studied. Finally, we used zip codes as the spatial unit for aggregation of Lyme
Geographic Expansion of Lyme Disease in the Southeastern United States
•
OFID
•
5
disease cases. Zip codes can be added, eliminated, and reassigned over time; and unlike other census units (eg, census tracts), some zip codes (for example, those attached only to post offices) have no population value. To mitigate these limitations, we chose to use population data from a single roughly midpoint year (the 2010 US Census) for all analyses. Nonetheless, our study analysis also included public health data from more than 11 000 Lyme disease cases registered by VA and NC over a 15-year period. The trends in these data paint a clear picture of southward expansion of Lyme disease; this is consistent with growth of the endemic range for Lyme disease that has been reported from other geographic regions [17– 19]. As a consequence, previously nonendemic communities will be at risk, including in the southeastern United States. We do not yet fully understand the ecological and biological factors that have facilitated spread of this pathogen and its tick vector, nor which factors may ultimately constrain it. In the meantime, further study is needed to optimize both ecological and case surveillance methods to best understand the geographic range of this common disease. Acknowledgments Disclaimer. The contents of this article are solely the responsibility of the authors and do not necessarily represent the official view of the National Institutes of Health. Financial support. P. M. L. was supported by the National Center for Advancing Translational Sciences of the National Institutes of Health under award number KL2 TR001115. P. G. A. was supported by the Ken and Sherrilyn Fisher Center for Environmental Infectious Diseases. V. G. F. and F. R. were supported by the National Institute for Allergy and Infectious Diseases of the National Institutes of Health under award number K24 AI093969. L. E. N. was supported by a Boston Children’s Hospital Pilot research grant. R. J. B. was supported by the Thomas F. and Kate Miller Jeffress Memorial Trust. W. K. P. was supported by the InterAmerican Institute for Global Change Research, CRN 3036. P. G. A. has served as an expert witness in malpractice cases related to Lyme disease. V. G. F. served as Chair of V710 Scientific Advisory Committee (Merck), has received grant support or has grants pending from Cerexa, Pfizer, Advanced Liquid Logic, MedImmune, and Cubist, has been a paid consultant for Merck, Astellas, Affinium, Theravance, Cubist, Cerexa, Debiopharm, Durata, Pfizer, NovaDigm, Novartis, Medicines Company, Biosynexus, MedImmune, and Inimex, Bayer, and has received honoraria from Merck, Astellas, Cubist, Pfizer, Theravance, and Novartis. Potential conflicts of interest. All authors have submitted the ICMJE Form for Disclosure of Potential Conflicts of Interest. Conflicts that the editors consider relevant to the content of the manuscript have been disclosed.
References 1. Centers for Disease Control and Prevention. Reported cases of Lyme disease by state or locality, 2004-2013. Available at: http://www.cdc. gov/lyme/stats/chartstables/reportedcases_statelocality.html. Accessed 12 January 2015.
6
•
OFID
•
Lantos et al
2. Hinckley AF, Connally NP, Meek JI, et al. Lyme disease testing by large commercial laboratories in the United States. Clin Infect Dis 2014 59:676–81. 3. Diuk-Wasser MA, Hoen AG, et al. Human risk of infection with Borrelia burgdorferi, the Lyme disease agent, in eastern United States. Am J Trop Med Hyg 2012; 86:320–7. 4. Maggi RG, Reichelt S, Toliver M, et al. Borrelia species in Ixodes affinis and Ixodes scapularis ticks collected from the coastal plain of North Carolina. Ticks Tick Borne Dis 2010; 1:168–71. 5. North Carolina Department of Health and Human Services: Division of Public Health. Annual update on surveillance for Lyme disease in North Carolina. Available at: http://epi.publichealth.nc.gov/cd/lyme/docs/ Lyme_memo_2015.pdf. Accessed 24 August 2015. 6. Centers for Disease Control and Prevention. Lyme Disease (Borrelia burgdorferi): 1996 Case Definition. Available at: http://wwwn.cdc.gov/ NNDSS/script/casedef.aspx?CondYrID=750&DatePub=1/1/1996% 2012:00:00%20AM. Accessed 21 January 2015. 7. Centers for Disease Control and Prevention. Lyme Disease (Borrelia burgdorferi): 2008 Case Definition. Available at: http://wwwn.cdc.gov/ NNDSS/script/casedef.aspx?CondYrID=751&DatePub=1/1/2008% 2012:00:00%20AM. Accessed 21 January 2015. 8. Centers for Disease Control and Prevention. Lyme Disease (Borrelia burgdorferi): 2011 Case Definition. Available at: http://wwwn.cdc.gov/ NNDSS/script/casedef.aspx?CondYrID=752&DatePub=1/1/2011% 2012:00:00%20AM. Accessed 18 December 2014. 9. Oden N. Adjusting Moran’s I for population density. Stat Med 1995; 14:17–26. 10. Kulldorff M, Nagarwalla N. Spatial disease clusters: detection and inference. Stat Med 1995; 14:799–810. 11. Chen J, Roth RE, Naito AT, et al. Geovisual analytics to enhance spatial scan statistic interpretation: an analysis of U.S. cervical cancer mortality. Int J Health Geogr 2008; 7:57. 12. Brinkerhoff RJ, Gilliam WF, Gaines D. Lyme disease, Virginia, USA, 2000-2011. Emerg Infect Dis 2014; 20:1661–8. 13. Kelly RR, Gaines D, Gilliam WF, Brinkerhoff RJ. Population genetic structure of the Lyme disease vector Ixodes scapularis at an apparent spatial expansion front. Infect Genet Evol 2014; 27:543–50. 14. Centers for Disease Control and Prevention (CDC). Physician reporting of Lyme disease–Connecticut, 1991-1992. MMWR Morb Mortal Wkly Rep1993; 42:348–50. 15. Lantos PM, Brinkerhoff RJ, Wormser GP, Clemen R. Empiric antibiotic treatment of erythema migrans-like skin lesions as a function of geography: a clinical and cost effectiveness modeling study. Vector Borne Zoonotic Dis 2013; 13:877–83. 16. Lantos PM, Branda JA, Boggan JC, et al. Poor positive predictive value of Lyme disease serologic testing in an area of low disease incidence [E-pub ahead of print]. Clin Infect Dis 2015. pii: civ584. 17. Lee X, Hardy K, Johnson DH, Paskewitz SM. Hunter-killed deer surveillance to assess changes in the prevalence and distribution of Ixodes scapularis (Acari: Ixodidae) in Wisconsin. J Med Entomol 2013; 50:632–9. 18. Hamer SA, Tsao JI, Walker ED, Hickling GJ. Invasion of the Lyme disease vector Ixodes scapularis: implications for Borrelia burgdorferi endemicity. Ecohealth 2010; 7:47–63. 19. Nelder MP, Russell C, Lindsay LR, et al. Population-based passive tick surveillance and detection of expanding foci of blacklegged ticks Ixodes scapularis and the Lyme disease agent Borrelia burgdorferi in Ontario, Canada. PLoS One 2014; 9:e105358.