Geosphere, published online on 23 October 2013 as doi:10.1130/GES00853.1
Geosphere Sea-level control of New Jersey margin architecture: Palynological evidence from Integrated Ocean Drilling Program Expedition 313 Francine M.G. McCarthy, Miriam E. Katz, Ulrich Kotthoff, James V. Browning, Kenneth G. Miller, Ryan Zanatta, Ross H. Williams, Matea Drljepan, Stephen P. Hesselbo, Christian J. Bjerrum and Gregory S. Mountain Geosphere published online 23 October 2013; doi: 10.1130/GES00853.1
Email alerting services
click www.gsapubs.org/cgi/alerts to receive free e-mail alerts when new articles cite this article
Subscribe
click www.gsapubs.org/subscriptions/ to subscribe to Geosphere
Permission request
click http://www.geosociety.org/pubs/copyrt.htm#gsa to contact GSA
Copyright not claimed on content prepared wholly by U.S. government employees within scope of their employment. Individual scientists are hereby granted permission, without fees or further requests to GSA, to use a single figure, a single table, and/or a brief paragraph of text in subsequent works and to make unlimited copies of items in GSA's journals for noncommercial use in classrooms to further education and science. This file may not be posted to any Web site, but authors may post the abstracts only of their articles on their own or their organization's Web site providing the posting includes a reference to the article's full citation. GSA provides this and other forums for the presentation of diverse opinions and positions by scientists worldwide, regardless of their race, citizenship, gender, religion, or political viewpoint. Opinions presented in this publication do not reflect official positions of the Society.
Notes
Advance online articles have been peer reviewed and accepted for publication but have not yet appeared in the paper journal (edited, typeset versions may be posted when available prior to final publication). Advance online articles are citable and establish publication priority; they are indexed by GeoRef from initial publication. Citations to Advance online articles must include the digital object identifier (DOIs) and date of initial publication.
© Geological Society of America
Results of IODP Exp313: The History and Impact of Sea-level Change Offshore New Jersey themed issue
Sea-level control of New Jersey margin architecture: Palynological evidence from Integrated Ocean Drilling Program Expedition 313 Francine M.G. McCarthy1, Miriam E. Katz2, Ulrich Kotthoff 3, James V. Browning 4, Kenneth G. Miller 4, Ryan Zanatta1, Ross H. Williams2, Matea Drljepan1, Stephen P. Hesselbo5, Christian J. Bjerrum6, and Gregory S. Mountain4 1
Department of Earth Sciences, Brock University, St. Catharines, ONT L2S 3A1, Canada Department of Earth & Environmental Sciences, Rensselaer Polytechnic Institute, Troy, New York 12180, USA 3 Institut für Geologie, Universität Hamburg, Bundesstrasse 55, 20146 Hamburg, Germany 4 Department of Earth and Planetary Sciences, Rutgers University, Piscataway, New Jersey 08854, USA 5 Camborne School of Mines, College of Engineering, Mathematics and Physical Sciences, University of Exeter, Penryn Campus, Penryn, Cornwall TR10 9EZ, UK 6 Nordic Centre for Earth Evolution (NordCEE) and Department of Geosciences and Natural Resource Management, Øster Voldgade 10, DK-1350, Copenhagen K, Denmark 2
ABSTRACT Integrated Ocean Drilling Program Expedition 313 recovered Miocene sequences at Holes M0027A and M0029A on the New Jersey shallow shelf that contain a characteristic acid-resistant organic component. The palynofacies within each sequence reflects variations in terrigenous versus authigenic flux through the Miocene that are associated with sea-level change. Very high ratios of terrigenous versus marine palynomorphs and of oxidation-resistant versus susceptible dinocysts are associated with seismic sequence boundaries, consistent with their interpretation as sequence-bounding unconformities generated at times of low sea level. Comparison of palynological distance from shoreline estimates with paleodepth estimates derived from foraminiferal data allows relative sea level to be reconstructed at both sites. Ages assigned using dinocyst biostratigraphy are consistent with other chronostratigraphic indicators allowing sequence boundaries to be correlated with Miocene oxygen isotope (Mi) events. Paleoclimatic evidence from the pollen record supports the global climate changes seen in the oxygen isotope data. Although chronological control is relatively crude, Milankovitch-scale periodicity is suggested for parasequences visible in thick sequences deposited in relatively deep water where substantial accommodation existed, such as during the early Langhian at Site 29 (Middle Miocene Climatic Optimum). Palynological analysis thus supports
the long-held hypothesis that glacioeustasy is a dominant process controlling the architecture of continental margins. INTRODUCTION Integrated Ocean Drilling Program Expedition 313 to the New Jersey Shallow Shelf The New Jersey margin is ideally suited to study the response of continental margin architecture to Oligocene–Miocene icehouse sea-level fluctuations (Mountain et al., 2010). Integrated Ocean Drilling Program (IODP) Expedition 313 provided an opportunity to apply a multiproxy approach to refining the application of palynology to sequence stratigraphic studies. In 1998, Ocean Drilling Program (ODP) Leg 174A attempted to core the outer New Jersey (USA) shelf, but recovery (particularly of the sand-rich Miocene section) was patchy, so the shipboard party (Austin et al., 1998) was forced to focus on the Quaternary of the uppermost slope. Drilling by onshore ODP Legs 150X and 174AX successfully recovered Late Cretaceous to Holocene sequences from sites on the Atlantic coastal plain (summaries in Miller, 2002; Miller et al., 2005) that provide the material to reconstruct sea level on the New Jersey margin and relate the fluctuations to global sea-level change (e.g., Miller et al., 2005). There remained a gap between the coastal plain and the outer shelf, making correlation difficult until the New Jersey shallow shelf was finally drilled between 30 April and 17 July 2009 by IODP Expedition 313, filling the criti-
cal gap in the transect of coreholes between the New Jersey coastal plain (ODP Legs 150X and 174AX) and the continental slope (ODP Legs 150 and 174A) (Fig. 1). There were 15 unconformity-bounded sequences identified within the Miocene during Expedition 313 (Mountain et al., 2010). Seismic sequence boundaries were identified based on reflector terminations (onlap, downlap, erosional truncation, and toplap) on multichannel seismic profiles obtained on R/V Ewing cruise Ew9009, R/V Oceanus cruise Oc270, and R/V Cape Hatteras cruise Ch0698 (Fig. 1; Monteverde et al., 2008; Monteverde, 2008; Mountain et al., 2010). Sequence boundaries were identified in the Expedition 313 cores on the basis of physical stratigraphy and age breaks (Mountain et al., 2010; Browning et al., 2013; Miller et al., 2013a) based on the following criteria: (1) irregular contacts, with as much as 5 cm of relief on a 6.2-cm-diameter core; (2) reworking, including rip-up clasts found above the contact; (3) intense bioturbation, including burrows filled with overlying material; (4) major lithofacies shifts and changes in stacking pattern; (5) gammaray increases associated with changes from low radioactivity sands below to “hotter” (high radioactivity) clays above, glauconite immediately above sequence boundaries, and/or marine omission surfaces (e.g., with high U/Th scavenging); (6) shell lags above the contact; and (7) age breaks indicated by Sr isotope stratigraphy or biostratigraphy. A velocity versus depth function was used to make initial seismiccore correlations of seismic sequence boundaries to core surfaces identified from visual
Geosphere; December 2013; v. 9; no. 6; p. 1–31; doi:10.1130/GES00853.1; 11 figures; 6 tables; 2 supplemental tables. Received 4 August 2012 ♦ Revision received 31 August 2013 ♦ Accepted 2 October 2013 ♦ Published online 23 October 2013
For permission to copy, contact
[email protected] © 2013 Geological Society of America
1
McCarthy et al. 77°
76°
75°
74°
73°
72°W 41°N
New Jersey Sea-Level Transect Seismic Profiles CH0698 Ew9009 Oc270 Existing Drillsites DSDP Exploration + AMCOR 903 ODP Leg 150, 150X 1072 ODP Leg 174A, 174AX M27 IODP Leg 313
op
cr
ut
o us
o
ce
ta
e Cr
op
tcr
e-
pr
ou
e ac
et
Cr
Sea Girt
n Ce
40° Double Trouble
Medford
Wilson Ancora Lake
p ro
c
ut
o oic oz
New Jersey
Fort Mott
Atlantic Ocean
u so
Island Beach
M27 M28 M29
6011 Bass River
1071 1072
+ Atlantic City
Millville
+ + ++
6020 Ocean View
+ ++
Cape May Zoo
6010
+++ +
+
+
906 902 904
+
6009
Cape May
1073
++ +
39°
903
Delmarva Peninsula
op
30
00
m
m 00 20
10
00
20
m
0m
Ri
se
Sl
Bethany Beach
e
Sh el f
905
38°
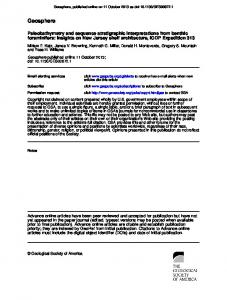
Figure 1. Generalized bathymetric and location map of the New Jersey/Mid Atlantic Margin transect showing three generations of multichannel seismic (MCS) data (R/V Ewing cruise Ew9009, R/V Oceanus cruise Oc270, and R/V Cape Hatteras cruise Ch0698) acquired before Expedition 313, as well as onshore coreholes and offshore coreholes drilled by AMCOR (Atlantic Margin Coring Project), ODP (Ocean Drilling Program), and IODP (Integrated Ocean Drilling Program). DSDP—Deep Sea Drilling Project. Palynomorphs were analyzed from Sites M27 and M29 at the proximal and distal ends of the IODP Expedition 313 transect.
evidence (core descriptions and photographs) and log data (Mountain et al., 2010; Mountain and Monteverde, 2012; Miller et al., 2013a). Synthetic seismograms from Sites M27A and M29A (Mountain and Monteverde, 2012) provide a check on seismic-core correlations and predicted depths of seismic sequence boundaries. The resultant seismic-core-log correlations (summarized in Miller et al., 2013a) were used to place the sequence boundaries in this study. A chronology was developed based on calcareous nannofossil, diatom, dinoflagellate cyst, and planktonic foraminiferal data together with Sr isotope analyses of mollusc shells and foraminifers that allowed correlation with the global record of eustasy (see Browning et al., 2013).
2
Sea-Level–Sensitive Palynological Proxies Several studies have used palynomorphs in sequence stratigraphic studies, recognizing their significance as sedimentary particles having provenance and history that can be much more comprehensively identified than those of the siliciclastic particles with which they are deposited (Eshet et al., 1988; Habib and Miller, 1989; Gregory and Hart, 1992; Wood and Gorin, 1998; McCarthy and Gostlin, 2000; McCarthy et al., 2003; Oboh-Ikuenobe et al., 2005). All of these studies demonstrated that the palynological signature of a continental margin is the product of the initial environmental conditions at the depositional setting together with taphonomic skew-
Geosphere, December 2013
ing of that record due to differential transport and preservation of palynomorphs (in addition to the biostratigraphically useful evolution and extinction events). The basic concept is that acidresistant organic material from land (e.g., phytoclasts, fungal spores, pollen, and embryophyte spores) is progressively sorted and degraded with increasing distance from the shoreline because of a progressively decreasing energy gradient. In contrast, autochthonous marine material is preferentially degraded in the higher energy proximal settings, but is preserved well in deeper water settings as long as the burial rate is relatively high (Traverse, 1994; Tyson 1995). In this paper sea-level–dependent aspects of the palynological record of Holes M0027A and
Palynological evidence of eustasy M0029A (herein 27A and 29A) are examined in light of one of the main goals of IODP Expedition 313, i.e., to assess the role of sea level on continental margin architecture (Mountain et al., 2010). Estimates of the proximity to the shoreline inferred from the palynological record are compared with estimates of paleo–water depth derived from benthic foraminiferal data, which have long been the basis for sea-level reconstruction (e.g., Miller et al., 1997; Katz et al., 2003). Previous comparisons of palynologically derived distance to shoreline estimates and benthic foraminiferal biofacies-based paleobathymetry in Pleistocene sediments from ODP Hole 1072A proved successful (Katz et al., 2003; McCarthy et al., 2003). Comparison of the palynological record (which represents the allochthonous pollen flux together with the in situ planktonic algal record, thus providing a proxy of terrigenous flux to marine environments) with the benthic foraminiferal record (which provides estimates of paleobathymetry) allows some of the complexity associated with the palynological response to sea-level change to be resolved, and a robust signal is obtained when all of the proxies are integrated and interpreted to record the same paleoenvironmental parameters. This multiproxy approach also highlights different aspects of variations in relative sea level that are recorded by the different microfossil groups. A shelf with a steep gradient, for example, could have proximal conditions (recorded by a strong dominance of terrestrial microfossils) together with outer neritic water depths (inferred from foraminiferal assemblages), whereas a shelf with a very gentle gradient could have distal settings, resulting in a lower ratio of terrestrial versus marine microfossils in sediments containing a benthic foraminiferal assemblage, reflecting inner neritic water depths. In addition, beyond the shelf break, downslope mass wasting (which is most pronounced at times of lowered sea level; cf. McCarthy et al., 2003, 2004a) can produce palynomorph assemblages very rich in pollen and embryophyte spores in relative deep water. The multiproxy data and the very good age resolution available from IODP Expedition 313 allow us to assess existing models and to infer the relationship between sea level and the sedimentation of organic particles on the New Jersey margin during the early Aquitanian to early Serravallian. METHODS Samples (5 cm3) were processed for palynological analysis at Brock University (St. Catharines, Canada) using standard techniques, including disaggregation using warm, dilute
(0.02%) sodium hexametaphosphate, and dissolution of carbonate and silicate minerals using weak (10%) HCl and concentrated HF, respectively. Samples were centrifuged and rinsed with distilled water between each ~1 h step. Samples were sieved twice through Nitex mesh to retain the >15 μm fraction, once after the weak sodium hexametaphosphate treatment to get rid of the majority of the resistant clays, and more thoroughly following the HF treatment to get rid of any remaining clays as well as fine organic matter that can obstruct palynomorph identification. A tablet containing 10,850 ± 200 Lycopodium clavatum spores was introduced during HCl treatment in order to allow estimates of marine and terrestrial palynomorph concentration relative to the exotic spores (as described by Stockmarr, 1971). Samples were mounted on glass slides using glycerine jelly and palynomorphs were counted at 400× magnification, with specimens examined under oil immersion at 1000× for verification where necessary. The identification of palynomorphs was hampered in many samples by the growth of pyrite, indicating that reducing conditions prevailed in the depositional environment. The abundance of dinoflagellate cysts and amorphous organic matter (AOM) in these pyrite-rich samples records that reducing conditions were associated with distal/ outer neritic conditions. In some samples, AOM was so common that it obscured some palynomorphs, preventing identification. In Serravallian sediments at the more neritic Site 27, and in most samples at sequence boundaries, marine palynomorphs were vastly outnumbered by terrestrial palynomorphs and terrigenous organic matter, so that several slides had to be examined. Nonetheless, nearly all Miocene samples processed contained sufficient reasonably well preserved palynomorphs to allow assessment of age and paleoenvironment; the exception was sandy sediments that make up the upper part of sequence m5.8 and sequence m5.47 in Hole 27A. Photographs of common and age-diagnostic dinocyst taxa were taken at 1000× using oil immersion. The dinocyst data (raw counts in Supplemental Tables 11 and 22) are presented semiquantitatively as relative abundances (rare < 5%, 1 Supplemental Table 1. Relative abundance and raw counts, Hole 27A. If you are viewing the PDF of this paper or reading it offline, please visit http:// dx.doi.org/10.1130/GES00853.S1 or the full-text article on www.gsapubs.org to view Supplemental Table 1. 2 Supplemental Table 2. Relative abundance and raw counts, Hole 29A. If you are viewing the PDF of this paper or reading it offline, please visit http:// dx.doi.org/10.1130/GES00853.S2 or the full-text article on www.gsapubs.org to view Supplemental Table 2.
Geosphere, December 2013
common 5%–20%, abundant > 20%) based on minimum counts of 35 cysts, although counts normally exceed 60 cysts. Ages were assigned to samples using the dinoflagellate (DN) zones of de Verteuil and Norris (1996) (Fig. 2), although more recent dinocyst studies, most notably the North Sea zonations of Dybkjær and Piasecki (2008, 2010) were also useful in assigning ages and characterizing sequences according to their palynological content. Useful datums calibrated to the Gradstein et al. (2004) time scale (as discussed in Browning et al., 2013) in Holes 27A and 29A are listed in Tables 1 and 2. The degree of terrigenous versus marine flux is illustrated by the ratio of terrestrial palynomorphs (T, pollen + embryophyte spores) versus marine palynomorphs (M, dinocysts + acritarchs), i.e., T:M (referred to as P:D [pollen versus dinocysts] in McCarthy and Mudie [1998] and McCarthy et al. [2003, 2004a, 2004b]). Minimum counts of 200 palynomorphs were employed to generate ratios of terrestrial versus marine palynomorphs (Tables 3 and 4). Foraminiferal linings were not included in the total marine palynomorph sum because coastal and inner neritic benthics are as likely to produce acid-resistant linings as are middle to outer neritic taxa, and we are attempting to gauge sea level and terrigenous flux. The T:M ratio illustrates the degree of terrigenous flux to the marine environment, representing the rapid settling of most pollen grains from the atmosphere and within the water column against an irregular pattern of algal productivity in surface waters (Mudie and McCarthy, 1994; McCarthy et al., 2003). A similar index is given by the ratio of two major end members of palynofacies classification: the allochthonous terrestrially derived phytoclasts (Ph) and authigenic marine AOM , i.e., Ph:AOM. Palynofacies identification follows Batten (1996), and the data are provided as a robust ratio of the terrigenous and marine end members (Figs. 3–5; Table 5). The Ph:AOM ratio primarily reflects taphonomic effects, e.g., the transportation of terrigenous organic matter relative to sea-surface productivity, and the ultimate preservation of that organic matter in the sediment. Distance from the shoreline is also reflected by the ratio of nonsaccate (primarily angiosperm/hardwood tree) versus bisaccate (conifer) pollen grains (nonsac:bisac; Figs. 3 and 4; Table 6), reflecting the gradual settling of heavier, less aerodynamic and hydrodynamic angiosperm grains (Mudie and McCarthy, 1994, McCarthy et al., 2003). Distal pollen assemblages thus tend to be greatly enriched in bisaccate conifer pollen with sacs adapted to float long distances in air or water. The ratio of cysts of primarily coastal to inner neritic dinoflagellate taxa relative to those of
3
14
15
4
Middle Miocene
13
Nannoplankton zonation
Stage
Serravallian NN6
Onshore zonation, Denmark Dybkjaer and Piasecki, 2010 A. andalousiense
13.65
NN5
USA East coast
Sequence Boundaries
de Verteuil and Norris, 1996
DN6
S. dionaeacysta Unipontidinium aquaeductum
Langhian Labyrinthodinium truncatum
15.97
16
DN5 Batiacasphaera sphaerica
b
DN4
m5.2
Distatodinium paradoxum
m5.3 Cousteaudinium aubryae
18
19
20
Early Miocene
17
Burdigalian NN3
NN2
21
c
Thalassiphora pelagica
Aquitanian
m5.4 m5.45 m5.47
m5.6
b DN2
m5.7
Sumatradinium soucouyantiae
m5.8 a
Caligodinium amiculum
m6
Homotryblium spp.
22
23
DN3 Cousteaudinium aubryae
E. insigne Cordosphaeridium cantharellus Sumatradinium hamulatum
20.43
m4.1 m4.5 m5.0
a
NN4
24
primarily outer neritic and oceanic taxa is an additional indicator of distance to shoreline. The long-ranging so-called “round brown” Brigantedinium spp., associated with coastal to inner neritic environments or upwelling regions, i.e., regions with high nutrient availability (Rochon et al., 1999), are common to abundant in most samples from the New Jersey shallow shelf sites. These protoperidinioid cysts typically have a strong effect on the ratio of gonyaulacoid cysts (G; produced by autotrophic dinoflagellates and generally more abundant seaward of the inner shelf; see McCarthy et al., 2003) versus protoperidinioid cysts (P; produced by heterotrophic dinoflagellates and generally more abundant in coastal and inner neritic environments). G:P ratios (Figs. 3 and 4; Tables 3 and 4) thus provide another, relatively crude measure of the offshore environmental gradi-
Epoch
Oligocene
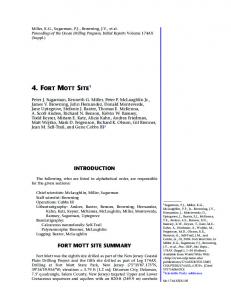
Figure 2. The dinocyst stratigraphy of de Verteuil and Norris (1996) allows ages to be assigned to Miocene sequences recovered from the New Jersey shelf and to sequence boundaries (unnamed–m4.1) that bound them. Dinoflagellate zone (DN) DN5 has been subdivided into subzones DN5a and DN5b, with the boundary between the subzones based on the lowest occurrence (LO) of Habibacysta tectata, which generally coincides with the highest consistent occurrence of Apteodinium tectatum, as reported by de Verteuil and Norris (1996). Subzones DN2a, DN2b, and DN2c are based on the highest occurrence (HO) of Caligodinium amiculum, Cordosphaeridium cantharellum, and Exochosphaeridium insigne, respectively. Also shown is the zonation of Dybkjær and Piasecki (2010) for the onshore sequences in Denmark, as well as the calcareous nannofossil zonation of Martini (1971). All are calibrated against the Gradstein et al. (2004) time scale, as discussed in Browning et al. (2013). The ages of sequence boundaries are constrained by the multiple chronostratigraphic proxies discussed in Browning et al. (2013). The thinner lines indicate the preferred and/or more constrained ages based on the dinocyst assemblages. A. andalousiense—Achomosphaera andalousiense; E. insigne—Exochosphaeridium insigne; S. dionaeacysta— Selenopemphix dionaeacysta.
Age (Ma)
McCarthy et al.
23.03
Chattian
NN1 NP25
Chiropteridium galea
Deflandrea phosphoritica
ent; however, G:P is also high in distal settings where bottom waters are well oxygenated and the rate of burial is low, because postdepositional degradation selectively affects protoperidinioid cysts (Zonneveld et al., 1997; Hopkins and McCarthy, 2002; McCarthy et al., 2004a, 2004b; Versteegh and Zonneveld, 2002). The labile Brigantedinium-type cysts are especially vulnerable to early diagenetic aerobic degradation, while most gonyaulacoid taxa are highly resistant (Zonneveld et al., 2001, 2008; Versteegh and Zonneveld, 2002), so the G:P ratio referred to here also retains a taphonomic signature in addition to reflecting ecology. Sequencebounding unconformities were found to be typically characterized by very high G:P, interpreted to be a taphonomic signal (e.g., McCarthy et al., 2003). The G:P ratio was also found to be very high in highstand systems tracts and maximum
Geosphere, December 2013
DN1 Chiropteridium galea
O6
flooding surfaces where sediment accumulation rates are very low (McCarthy et al., 2003). Paleobathymetric reconstructions are based on foraminifera, including benthic foraminiferal assemblages, key depth-indicator species, and percentage of planktonic foraminifera (for details, see Katz et al., 2013). Paleodepth constraints use the Miller et al. (1997) general paleobathymetric model, which was established using coeval New Jersey coastal plain sections drilled onshore (as modified by Katz et al., 2013). Hanzawaia hughesi–dominated biofacies indicate mid-inner neritic depth (10–25 m), Pseudononion pizarrensis–dominated biofacies indicate lower inner neritic to upper middle neritic depth (25–50 m), Bulimina gracilis/ Bolivina paula–dominated biofacies indicate middle-middle neritic depth (50–80 m), and Uvigerina spp./Bolivina floridana–dominated
Palynological evidence of eustasy TABLE 1. USEFUL DINOCYST DATUMS IN INTEGRATED OCEAN DRILLING PROGRAM EXPEDITION 313 HOLE M0027A LO HO Range Taxon (sample/depth mcd) (sample/depth mcd) (DN zone) Trinovantedinium papulum 27A-77R-2/221.11 DN5– Habibacysta tectata 27A-77R-2/221.11 upper DN5– Invertocysta lacrymosa 27A-77R-2/221.11 Middle Miocene– 27A-80R-1/226.28 Trinovantedinium harpagonium DN5– Unipontedinium aquaeductum 27A-83R-3/237.62 27A-70X-1/207.56 DN5 Imagidinum arachnion 27A-88R-1/250.26 top DN4–DN9 Apteodinium tectatum 27A-70X-1/207.56 –DN5 Cleistosphaeridium placacanthum 27A-73X-1/212.00 –top DN5 Apteodinium spiridoides 27A-88R-2/252.16 –top DN4 Labyrinthodinium truncatum truncatum 27A-88R-1/250.26 base DN4– 27A-88R-2/252.16 Labyrinthodinium truncatum modicum base DN4– Cerobrocysta poulsenii 27A-101R-1/290.31 top DN3–DN8 Sumatradinium druggii 27A-102R-2/294.07 base DN3–DN8 Sumatradinium hamulatum 27A-177R-1/503.41 27A- 161R-2/460.51 base DN2–top DN3 Sumatradinium soucouyantiae 27A-186R-1/523.66 base DN2–DN8 Cousteadinium aubryae 27A-186R-1/523.66 27A-83R-3/237.63 DN2–top DN4 Lingulodinium multivirgatum 27A-85R-3/242.72 (–top DN3) Operculodinium longispinigerum 27A-189R-1/531.08 27A-127R-1/359.71 DN2–DN4 Distatodinium paradoxum 27A-156R-1/445.14 DN2–DN4 Exochosphaeridium insigne 27A-156R-1/445.14 27A-152R-2/434.26 DN2b–DN2c Cordosphaeridium cantharellus 27A-148R-3/423.66 –DN2b Cribroperidinium tenuitabulatum 27A-148R-3/423.66 –DN2 Cerebrocysta satchelliae 27A-149R-2/425.56 –DN2 Dinopterigium cladoides 27A-149R-2/425.56 –DN2 Caligodinium amiculum 27A-164R-2/470.46 –DN2a Membranophoridium aspinatum 27A-176R-1/500.63 –base DN2 Stoverocysta conerae 27A-187R-3/526.08 27A-186R-1/523.66 base DN1–DN2 Chiropterdium galea 27A-186R-1/523.66 –top DN1 Deflandrea phosphoritica 27A-190R-2/525.73 –DN1 Note: LO—lowest occurrence; HO—highest occurrence; DN—dinoflagellate zone; mcd—meters composite depth.
biofacies indicate outer middle neritic depth (>75–100 m). Key taxa (e.g., Cibicidoides pachyderma, Cibicidoides primulus, Hanzawaia mantaensis, Oridorsalis umbonatus) often found in high-diversity, low-dominance assemblages indicate outer neritic paleodepths (100– 200 m) (for details, see Katz et al., 2013).
Sea level was qualitatively reconstructed, interpreted as high sea level wherever multiple palynological proxies recorded a distal setting and where middle to outer neritic water depths were suggested by the foraminiferal assemblage. These interpretations were at times confounded by barren samples, however, which may indi-
TABLE 2. USEFUL DINOCYST DATUMS IN INTEGRATED OCEAN DRILLING PROGRAM EXPEDITION 313 HOLE M0029A LO HO Range Taxon (Sample/depth mcd) (Sample/depth mcd) (DN zone) Ataxodium zevenboomi 29A-64R-1/ 320.96 Serravallian – Selenopemphix dionaeacysta 29A-70R-1/ 339.13 DN6 – Trinoventedinium harpagonium 29A-99R-2/425.11 DN5 – 29A-120R-1/470.10 Trinoventedinium papulum DN5 – Habibacysta tectata 29A-122R-1/ 481.73 DN5b – Unipontedinium aquaeductum 29A-128R-3/ 508.79 29A-75R-1/ 353.72 DN5 Cleistosphaeridium placacanthum 29A-85R-2/ 383.25 – top DN5 Cerebrocysta poulsenii 29A-191R-2/ 681.27 top DN3 – DN8 Sumatradinium soucouyantiae 29A-211R-2/ 739.35 base DN2 – DN8 Apteodinium tectatum 29A-101R-1/ 430.84 – DN5 29A-148R-3/ 566.27 – top DN4 Apteodinium spiridoides Labyrinthodinium truncatum truncatum 29A-176R-1/ 643.82 base DN4 – Labyrinthodinium truncatum modicum 29A-176R-1/ 643.82 base DN4 – Sumatradinium druggii 29A-194R-2/690.55 base DN3 – DN8 Cousteaudinium aubryae 29A-212R-1/ 741.04 29A-139R-1/ 536.58 DN2– top DN4 Operculodinium longispinigerum 29A-212R-2/ 742.56 29A-154R-2/ 581.45 DN2– top DN4 Distatodinium paradoxum 29A-148R-3/ 566.27 – top DN4 Exochosphaeridium insigne 29A-204R-1/ 717.71 m 29A-191R-2/ 681.27 DN2b – DN2c 29A-180R-2/ 657.38 Sumatradinium hamulatum DN2 – top DN3 Cerebrocysta satchelliae 29A-195R-2/ 693.59 –top DN2 Cordosphaeridium cantharellus 29A-196R-2/ 696.93 –DN2b Stoverocysta conerae 29A-211R-2/ 739.35 m 29A-211R-2/ 739.35 DN1 – DN2 Cribroperidinium tenuitabulatum 29A-212R-1/ 741.04 – top DN2 Dinopterygium cladoides 29A-212R-2/ 742.56 – DN2 Caligodinium amiculum 29A-208R-2/ 730.40 Membranophoridium aspinatum 29A-217R-1/ 753.87 m 29A-215R-1/ 749.93 m – base DN2 Note: LO—lowest occurrence; HO—highest occurrence; DN—dinoflagellate zone; mcd—meters composite depth.
Geosphere, December 2013
cate either deposition in very shallow water, dissolution, or mass transport of shallow-water sediments into deeper water environments. Sedimentological data proved valuable in verifying our sea-level interpretations, particularly in sediments barren of microfossils and in cases where palynomorphs and foraminifera indicate unrealistic shallow-water environments, likely indicating downslope transport. Good multiproxy geochronological control is available along the Expedition 313 transect, based on a variety of chronological tools in addition to dinocysts, including Sr isotope age estimates and nannofossil and diatom zonations (Browning et al., 2013). As a result, we were able to assess the influence of changing sea level and climate from the Aquitanian to earliest Serravallian on sedimentation on the New Jersey margin by correlating our sea-level record with Miocene oxygen isotope (Mi) events. PALYNOLOGY OF HOLES 27A AND 29A Palynological Signature and Age of Miocene Sequences Each sequence on the New Jersey shallow shelf has a distinct palynological character, not only in assemblages of marine and terrestrial palynomorph species, but in the entire palynofacies present in each slide, including the palynodebris. Sequences identified using seismic and sedimentological criteria have distinct signatures of T:M, Ph:AOM, G:P, and nonsac:bisac pollen, reflecting the distance from the shoreline and sea surface and depositional conditions at each site (Figs. 3–5). Evolution and extinction within dinoflagellate lineages allow biostratigraphic zonation of the uppermost Chattian to lowermost Serravallian, while semiquantitative variations in abundance reflect ecological change (Figs. 6 and 7). Lithologic Unit VII: Sequence O6 The dinocyst assemblage in sequence O6, above the reflector at 538.68 mcd (meters composite depth) in Hole 27A (Fig. 3), is rich in Apteodinium tectatum, Operculodinium centrocarpum, Lingulodinium multivirgatum, Spiniferites spp., Lejeunecysta sp., Brigantedinium sp., Membranophoridium aspinatum, Cleistosphaeridium placacanthum and Dapsilidinium pseudocolligerum (Supplemental Table 1 [see footnote 1]). The highest occurrence (HO) of Deflandrea phosphoritica in sample 27A-190R-2 (147–148 cm, 525.73 mcd) and of Chiropteridium galea in sample 27A-186R-1 (95–96 cm, 523.66 mcd), together with Stoverocysta conerae in samples 27A-187R-3 (140–141 cm, 526.08 mcd) through 186R-1
5
McCarthy et al. TABLE 3. RAW PALYNOMORPH COUNTS FROM INTEGRATED OCEAN DRILLING PROGRAM EXPEDITION 313 HOLE M0027A WITH CALCULATIONS OF THE TERRESTRIAL VERSUS MARINE PALYNOMORPH RATIO AND INTERPRETATIONS OF DEPOSITIONAL ENVIRONMENT AND SYSTEMS TRACTS Depth in Depth Terrestrial Marine section downhole palynomorphs palynomorphs Spike Environment/ Core Section (cm) (m) (grains) (cysts) (grains) T:M G:P systems tract Age 63 1 36.0–37.0 189.12 255 27 58 9.44 0.40 OFF 65 2 24.0–25.0 193.85 175 10 22 17.50 0.50 66 1 70.0–71.0 195.56 238 30 23 7.93 1.61 67 2 68.0–70.0 196.01 326.5 18 37 8.82 0.55 67 2 100.0–102.0 197.37 220 27 25 8.15 0.13 69 1 40.0–41.0 207.44 217 42 31 5.17 0.15 70 1 49.0–50.0 207.56 166 63 58 2.63 0.44 70 2 7.0–8.0 208.5 211 40 12 5.28 0.82 13.2 m4.1 209 71 1 17.0–18.0 209.6 175 50 25 3.50 2.54 SOT 72 1 14.0–16.0 210.58 94 66 47 1.42 1.20 72 1 22.0–24.0 210.7 144 103 52 1.39 2.20 73 1 57.0–58.0 211.45 133 51 7 2.61 1.47 75 1 50.0–52.0 216.72 137 88 2 1.56 1.15 TST 75 1 111.0–112.0 217.32 98 77 2 1.27 2.48 m4.5 218.39 75 2 82.0–83.0 218.53 131 24 6 5.46 2.78 SF 14.8 77 2 40.0–41.0 221.11 155 42 25 3.69 1.41 m5 225.45 80 1 98.0–99.0 226.28 113 71 9 1.59 3.9 OFF HST MFS 82 2 24.0–25.0 233.21 89 60 25 1.48 10.8 TST m5.2 236.15 83 3 11.0–12.0 237.62 127 52 11 2.44 0.87 SF 15.6 84 2 41.0–42.0 239.47 82.5 78 58 1.06 0.86 85 3 27.0–28.0 242.72 71 54 28 1.31 1.89 OFF 88 1 50.0–51.0 250.26 112 51 5 2.19 2.08 88 2 110.0–111.0 252.86 246 39 6 6.31 12.00 SOT 15.8 m5.3 256.19 91 CC(3) 9.0–10.0 262.05 146 40 12 3.65 1.24 HST 16.8 94 2 100.0–101.0 270.56 320 52 21 6.15 6.14 SF 94 3 2.0–3.0 271.06 76 40 4 1.90 1.44 TST m5.3.3 271.23 TS 95 1 109.0–111.0 272.21 170 72 13 2.36 1.83 SOT 98 1 58.0–60.0 280.08 143 46 11 3.11 2.38 LST 101 1 90.0–92.0 290.31 171 37 5 4.62 1.12 101 CC(4) 10.0–11.0 292.8 135 9 3 15.0 102 2 11.0–13.0 294.07 174 83 74 2.09 2.76 102 2 47.0–49.0 294.44 228 26 6 8.77 0.73 17.0 m5.4 295.01 103 1 50.0–51.0 296.01 169 89 32 1.89 1.15 17.7 103 1 140.0–141.0 296.91 110 50 22 2.20 2.62 104 3 36.0–38.0 301.86 173 4 8 43.25 105 CC(4) 10.0–11.0 304.95 88 26 4 3.38 HST FS 109 1 110.0–111.0 314.91 229 40 10 5.73 0.67 114 2 116.0–117.0 331.72 186 57 37 3.26 1.30 FS MFS 115 1 125.0–126.0 333.36 114 51 28 2.24 1.14 OFF TST 18.0 m5.45 336.06 116 2 38.0–39.0 337.04 175 33 71 5.30 1.29 122 2 58.0–60.0 347.94 BARREN channel fill m5.47 355.53 126 1 3.0–4.0 358.36 147 14 32 10.50 5.00 127 1 15.0–16.0 359.71 283 18 38 15.72 2.80 SF m5.7 361.28 (continued)
(95–96 cm, 523.66 mcd; Fig. 6; Table 1) allow this sequence to be assigned to dinocyst zone DN1 (late Chattian–early Aquitanian, ca. 24.4– 22.36 Ma). The existence of the OligoceneMiocene boundary within this sequence is consistent with the assignment of the lower part of this sequence to nannofossil zone NP25 and the upper part to zone NN1 (Browning et al., 2013). The AOM-dominated sediments in this sequence (palynofacies type 3 of Batten, 1996; Table 5) are characterized by relatively low terrestrial versus marine palynomorph ratios (mean T:M = 3.11, range 1.24–11.40, n = 11). A strong peak in T:M (11.4) in sample 27A-187R-CC
6
(8–10 cm, 527.68 mcd) is succeeded by somewhat elevated T:M (3.34) in the overlying sample. The abundance of Homotryblium spp. in all of the samples above the strong T:M peak (Figs. 3 and 6) suggests equivalence with the Homotryblium spp. zone of Dybkjær and Piasecki (2010) that they correlated with the lower part of the calcareous nannoplankton zone NN2 of Martini (1971), 22.36–21.6(?) Ma. The presence of Apteodininium spiridoides, Hystrichokolpoma rigaudiae, and Thalassiphora pelagica also differentiates the upper part of sequence O6. Protoperidinioid cysts are not abundant in this sequence (mean G:P = 6.12, range 2.21–10.25,
Geosphere, December 2013
n = 8); Brigantedinium spp. is the most consistently present. Most low-diversity pollen assemblages in sequence O6 are dominated by bisaccate conifer pollen (mean nonsac:bisac = 1.00, range 0.5–1.87, n = 5) until the peak in T:M at the base of core 187 (~528 mcd), above which angiosperm pollen become more abundant (mean nonsac:bisac = 2.37, range 1.22–3.56, n = 5; Fig. 3; Table 6). The dominance of gonyaulacoid cysts in marine palynomorph-rich sediments in which the pollen assemblage is characterized by bisaccate grains adapted to long-distance transport is consistent with a distal setting for Site 27 during the early Aquitanian (Fig. 3).
Palynological evidence of eustasy TABLE 3. RAW PALYNOMORPH COUNTS FROM INTEGRATED OCEAN DRILLING PROGRAM EXPEDITION 313 HOLE M0027A WITH CALCULATIONS OF THE TERRESTRIAL VERSUS MARINE PALYNOMORPH RATIO AND INTERPRETATIONS OF DEPOSITIONAL ENVIRONMENT AND SYSTEMS TRACTS (continued) Depth in Depth Terrestrial Marine section downhole palynomorphs palynomorphs Spike Environment/ Core Section (cm) (m) (grains) (cysts) (grains) T:M G:P systems tract Age 146 CC(3) 8.0–10.0 417.55 115 19 4 6.05 19.2 148 3 10.0–12.0 423.66 124 74 5 1.68 4.83 149 2 45.0–46.0 425.56 219 46 2 4.76 1.20 river– 150 2 50.0–51.0 428.66 210 54 8 3.89 1.64 influenced 151 1 49.0–50.0 430.21 172 32 8 5.38 2.02 SOT 151 2 145.0–147.0 432.76 141 11 312.82 1.64 152 2 20.0–21.0 434.26 209 10 6 20.90 2.78 152 2 104–105 435.10 317.5 34 9 9.34 154 1 90.0–92.0 440.00 154 32 11 4.81 3.91 154 CC(3) 0.0–1.0 441.13 223 26 6 8.58 155 CC(4) 0.0–1.0 445.00 177 84 7 2.11 156 1 18.0–19.0 445.14 352 58 4 6.07 3.50 156 2 8.0–10.0 448.09 208 40 3 5.20 3.45 157 2 122.0–123.0 450.74 123 35 1 3.51 5.80 159 CC(4) 13.0–15.0 457.54 225 62 6 3.63 160 2 124.0–126.0 459.88 142 18 7 7.89 161 2 30.0–31.0 462.01 124 21 5 5.90 0.67 161 2 89.0–90.0 462.51 227 89 3 2.55 4.20 MFS 161 CC(4) 8.0–10.0 463.61 172 30 6 5.73 162 1 89.0–90.0 464.00 121 60 2 2.02 2.29 162 2 30.0–32.0 464.69 181 91 9 1.99 1.74 TST 163 1 115.0–116.0 467.46 277 60 12 4.62 0.94 164 1 110.0–111.0 468.96 226 24 2 9.42 1.00 164 2 110.0–111.0 470.46 219 36 6 6.44 7.50 165 1 115.0–116.0 473.16 210 46 12 4.56 2.21 165 CC(4) 5.0–7.0 475.81 182 27 10 6.74 Toe of 166 1 15.0–16.0 475.62 136 30 9 4.69 2.63 slope 169 2 129.0–131.0 487.68 312 95 11 3.28 7.33 apron 170 1 15.5–16.5 488.17 209 44 13 4.75 0.63 171 2 120.0–121.0 492.09 178 21 5 8.48 0.75 LST 171 CC(3) 11.0–13.0 492.46 108 42 5 2.57 174 1 101–102 494.77 81 59 8 1.37 48.00 20.1 m5.8 494.87 175 1 28.0–29.0 497.09 128 51 14 2.51 0.85 175 CC(4) 13.0–16.0 500.23 178 37 5 4.81 Toe of 20.4 176 1 77.0–78.0 500.63 120 41 42 2.93 1.73 177 1 50.0–52.0 503.41 232 40 10 5.80 12.33 slope 177 CC(4) 14.0–16.0 506.36 165 11 8 15.00 apron 20.6 m6 509 185 CC(2) 15.0–17.0 520.96 111 50 6 2.22 5.60 23.0 186 1 95.0–96.0 522.66 214 67 27 3.19 3.33 187 1 87–88 523.57 193 129 43 1.49 9.00 187 3 140–141 526.08 213.5 64 36 3.34 8.33 187 CC(4) 8.0–10.0 527.68 171 15 5 11.40 188 2 60.0–61.0 529.21 129 45 17 2.87 2.21 apron 188 CC(3) 8.0–9.0 530.17 130 82 2 1.59 189 1 72.0–73.0 531.08 142 51 31 2.78 5.00 189 CC(4) 6.0–8.0 533.58 198 75 9 2.64 190 2 119.0–120.0 535.73 110 89 40 1.24 10.25 190 3 13.0–15.0 536.54 185 128 16 1.45 5.20 O6 538.68 Note: T:M—terrestrial vs. marine palynomorph ratio; G:P—gonyaulacoid versus protoperidinioidcyst ratio; SF—shoreface (0–10 m); OFF—offshore; SOT—shorefaceoffshore transition (10–30 m); TST—transgressive systems tract; FS—flooding surface; LST—lowstand systems tract; HST—highstand systems tract; MFS—maximum flooding surface; TS—transgressive surface.
Lithologic Unit VII: Sequence m6 The boundary between sequences O6 and m6 is characterized by high terrestrial versus marine palynomorph ratio (T:M = 15 in sample 27A-177R-CC, 506.36 mcd), a characteristic signature of erosional unconformities (Figs. 3 and 5; Table 3). The dinocyst assemblage in sequence m6 is relatively rich in Cleistosphaeridium placacanthum, Apteodinium tectatum, Dapsilidinium pseudocolligerum, Operculodinium longispinigerum, Selenopemphix nephroides, Lejeunecysta spp., and Brigantedinium spp. (Figs. 6 and 7). In addition to these common cysts, the presence of Sumatradinium
hamulatum together with Caligodinium amiculum (Figs. 6 and 7; Tables 1 and 2) constrains the age of this sequence to DN2a (22.36–19.4 Ma). The HO of Membranophoridium aspinatum (27A-176R-1, 500.63 mcd and 29A-215R-1, 749.93 mcd) occurs far below the HO of Caligodinium amiculum that marks the subzone DN2aDN2b boundary. We use this datum to characterize the base of DN2 as older than 20 Ma. T:M values remain relatively high in this sequence in Hole 27A (mean T:M = 6.21, n = 5), although terrestrial palynomorphs decline somewhat in relative abundance upcore within the thin sequence m6 to T:M = 4.81 in sample
Geosphere, December 2013
27A-175R-CC (13–16 cm, 500.23 mcd) from a peak value of 15 just above the sequence boundary. Lower T:M values were measured in the three samples analyzed from this thin sequence in the more distal Hole 29A (mean T:M = 3.04, range 1.20–4.26). Angiosperm pollen outnumber bisaccate conifer pollen in this sequence at both sites (Figs. 3 and 4; Table 6). This taphonomic signature records increased terrigenous flux to the New Jersey margin during the Aquitanian. No other microfossil groups were biostratigraphically useful, but Sr ages of 20.7–19.0 at the top of this sequence are consistent with the dinocyst zonation (Browning et al., 2013).
7
McCarthy et al.
Core 51 53 62 63 64 65 66 69 70 m4.1 72 73 74 75 77 78 m4.2 80 83 m4.3 84 85 85 88 90 92 93 m4.4 94 95 98 99 101 104 106 107 109 110 111 113 114 116 m4.5 120 121 122 126 m5 127 128 129 130 131 132 133 136 137 138 139 140 141 142 143 144 146 147 148
8
TABLE 4. RAW PALYNOMORPH COUNTS FROM INTEGRATED OCEAN DRILLING PROGRAM EXPEDITION 313 HOLE M0029A WITH CALCULATIONS OF THE T:M PALYOMORPH RATIO AND INTERPRETATIONS OF DEPOSITIONAL ENVIRONMENT AND SYSTEMS TRACT Depth in Depth Terrestrial Marine Environment or Age (Ma) section downhole palynomorphs palynomorphs Spike systems tract (Browning Section (cm) (m) (grains) (cysts) (grains) T:M G:P (Miller et al., 2013a) et al., 2013) 1 115.0–116.0 284.31 131 20 35 6.55 1 91.0–92.0 293.11 149 30 24 4.97 1 116.0–117.0 314.81 163 53 16 3.07 0.92 2 14.0–15.0 318.11 157 51 16 2.20 1.75 1 120.0–121.0 320.96 572 146 38 3.92 1.71 2 18.0–19.0 324.50 174 17 33 10.24 SF 1 25.0–26.0 326.11 162 24 8 6.75 0.25 1 44.5–46.0 335.46 620 129 38 4.81 0.35 1 107.0–108.0 339.13 186 42 17 4.43 2.88 OFF 12.9 342.81 2 39.0–40.0 345.20 168 25 17 6.72 SB 12.9 CC 219 60 25 3.65 3.5 2 57.0–58.0 352.32 246 77 11 3.19 1.69 FS 1 41.0–42.0 353.72 98 40 3 2.45 0.79 13.0 1 119.0–120.0 357.55 366 161 51 2.27 3.52 LST 13.0 1 110.0–111.0 360.51 143 32 5 4.47 3.11 364.86 1 109.0–110.0 366.60 194 79 6 2.45 1.00 1 10.0–11.0 374.76 284 83 11 3.42 0.46 13.1 377.15 2 122.0–123.0 380.48 139 68 6 2.04 1.56 13.1 2 99.0–100.0 383.25 312 123 8 2.54 3.86 CC 385.75 211 84 9 2.52 1.47 1 102.0–103.0 390.93 296 123 14 2.41 1.56 2 81.0–82.0 398.31 98 66 9 1.48 1.44 1 100.0–101.0 403.11 115.5 89 5 1.30 1.87 2 123.0–124.0 407.72 146 35 6 4.17 13.2 408.65 2 110.0–111.0 410.81 184 56 7 3.34 1.67 13.2 1 41.0–42.0 411.67 111 65 6 1.71 2.61 OFF 2 70.0–71.0 421.26 179 29 4 6.17 2 14.0–15.0 425.11 159 22 2 7.23 0.89 1 128.0–129.0 430.84 393 54 11 7.28 0.75 HST 1 98.0–99.0 439.69 183 17 2 10.76 1.54 2 36.0–37.0 443.62 211 27 5 5.31 0.44 3 40.0–41.0 447.81 83 59 6 1.41 2.67 MFS 2 20.0–21.0 452.61 269 43 7 6.26 13.00 2 21.0–22.0 455.39 204 43 12 4.74 1 92.0–93.0 457.93 268 24 5 11.17 7.17 1 102.0–103.0 464.13 254 77 22 3.30 2.15 1 35.0–37.0 466.51 123 37 12 3.32 3.11 1 120.0–121.0 473.46 59 106 14 0.56 3.04 TS 13.6 478.61 1 32.0–33.0 481.73 105 30 5 3.50 3.00 13.6 2 113.0–114.0 487.10 103 34 6 3.03 4.50 apron 1 150.0–151.0 489.01 136 49 5 2.78 0.50 lobe 1 15.0–16.0 499.86 196 86 11 2.28 1.54 13.7 502.01 3 31.0–32.0 505.35 168 58 3 2.90 14.6 3 73.0–74.0 508.79 105 82 12 1.28 2.35 1 89.0–90.0 509.75 162 68 2 2.38 2 32.0–33.0 513.73 122 56 7 2.18 1.56 1 28.0–29.0 515.24 118 70 6 1.69 1.09 2 30.0–31.0 519.81 127 50 2 2.54 1 48.0–49.0 521.54 137 55 6 2.49 2.6 1 73.0–74.0 528.48 321 89 19 3.61 0.74 1 90.0–91.0 531.11 212 64 8 3.31 0.63 HST 2 49.0–50.0 535.27 85 59 15 1.44 1.81 1 27.0–28.0 536.58 115 56 6 2.05 2.73 2 119.0–120.0 541.1 151 70 8 2.16 1 84.0–85.0 543.25 162 36 7 4.50 2 76.0–77.0 547.72 307 110 12 2.79 2.71 1 33.0–34.0 548.84 142 24 1 5.92 1 29.0–30.0 551.85 102 43 15 2.37 2.10 1 8.0–9.0 555.14 118 38 2 3.11 1 14.0–15.0 557.8 114 31 1 3.68 3 30.0–31.0 563.25 188 44 9 4.27 3.44 (continued)
Geosphere, December 2013
Palynological evidence of eustasy
TABLE 4. RAW PALYNOMORPH COUNTS FROM INTEGRATED OCEAN DRILLING PROGRAM EXPEDITION 313 HOLE M0029A WITH CALCULATIONS OF THE T:M PALYOMORPH RATIO AND INTERPRETATIONS OF DEPOSITIONAL ENVIRONMENT AND SYSTEMS TRACT (continued) Depth in Depth Terrestrial Marine Environment or Age (Ma) section downhole palynomorphs palynomorphs Spike systems tract (Browning Core Section (cm) (m) (grains) (cysts) (grains) T:M G:P (Miller et al., 2013a) et al., 2013) 149 3 10.0–11.0 566.27 106 36 8 2.94 3.00 151 3 17.0–18.0 572.43 174 31 5 5.61 0.83 152 2 27.0–28.0 574.68 164 28 5 5.86 153 2 50.0–51.0 577.99 133 43 1 3.09 154 2 90.0–91.0 581.45 102 35 13 2.91 2.89 155 2 99.0–100.0 584.55 104 54 3 1.93 156 1 20.0–21.0 585.31 135 64 3 2.04 1.17 TST 158 2 5.0–6.0 591.96 222 45 16 4.93 1.93 160 1 28.0–29.0 597.59 140 47 4 2.98 3.60 161 2 33.0–34.0 602.21 132.5 47 5 2.82 15.6 m5.2 602.25 163 1 73.0–74.0 607.19 296 37 4 8.00 1.42 15.8 165 2 154.0–156.0 615.64 132 84 10 1.57 6.27 167 2 151.0–153.0 621.68 107 31 3 3.45 0.82 168 1 21.0–22.0 621.92 131 47 5 2.79 toe-of-slope 168 2 96.0–97.0 624.17 102 55 31 1.85 3.78 apron 170 2 150.0–152.0 630.82 136 49 15 2.78 15.33 173 1 154.0–156.0 636.76 117 67 10 1.75 8.14 175 2 110.0–111.0 642.62 283 130 9 2.18 2.39 16.1 m5.3 643.19 176 1 76.0–77.0 643.82 119 45 7 2.64 3.89 OFF 17.6 179 2 5.0–6.0 650.99 345 100 6 3.45 2.00 180 1 38.0–39.0 652.59 166 39 7 4.26 4.51 Toe of slope apron 181 2 62.0–63.0 657.38 108 33 4 3.27 1.23 182 2 38.0–39.0 660.13 103 63 8 1.63 182 2 99.0–100.0 660.81 268 21 8 12.76 17.7 m5.4 662.37 183 1 110.0–111.0 663.81 249 91 21 2.74 3.17 17.7 184 1 113.0–114.0 665.54 158 49 11 3.22 2.77 Toe of slope apron 185 1 9.0–10.0 666.85 141 20 4 7.05 187 2 27.0–28.0 672.25 148 23 23 6.43 17.8 m5.45 673.71 189 CC 675.5 242 47 8 5.15 17.9 190 1 130.0 -131.0 677.84 94 51 12 1.84 1.32 190 2 34.0–35.0 678.45 222 147 13 1.59 1.73 191 2 22.0–23.0 681.27 254 121 12 2.10 1.71 192 1 88.0–89.0 683.59 97 30 8 3.23 1.78 192 2 98.0–99.0 685.2 196 67 5 2.93 18.0 194 2 23.0–24.0 690.55 241 86 11 2.80 2.31 18.1 195 1 50.0–51.0 692.36 178 57 5 3.12 195 2 33.0–35.0 693.59 198 93 28 2.13 8.33 195 2 124.0–125.0 694.60 128.5 49 1 2.62 4.88 m5.47 696 196 2 50.0–52.0 696.93 248 96 16 2.58 3.92 197 2 119.0–120.0 700.65 162 37 9 4.38 199 2 46.0–47.0 706.02 218 127 12 1.72 6.89 18.3 m5.6 706.66–710 201 1 6.0–7.0 710.22 147 43 3 3.42 18.6 202 1 9.0–10.0 711.87 152 39 4 3.90 202 2 6.0–7.0 712.96 113 52 2 2.17 2.07 203 1 22.0–23.0 713.43 142 70 2 2.03 2.67 204 1 145.0–147.0 717.71 202 126 16 1.60 7.89 OFF 205 CC 723.10 170 41 7 4.15 18.8 207 3 28.0–30.0 728.51 193 44 16 4.39 20.0 m5.7 728.56 208 2 44.0–45.0 730.40 126 52 25 2.42 1.83 209 1 111.0–112.0 732.62 152 65 59 2.34 1.56 210 2 30.0–31.0 736.36 158 47 20 3.36 dysoxic 211 1 31.0–32.0 737.92 130 11 26 11.82 4.50 prodelta 211 2 24.0–25.0 739.35 113 98 82 1.15 2.27 212 1 38.0–39.0 741.04 105 22 42 4.77 1.92 212 2 84.0–85.0 742.56 169 112 30 1.51 2.86 20.2 m5.8 746 215 2 5.0–6.0 749.93 95 79 1.20 2.76 20.5 217 1 101.0–102.0 753.87 216 29 4 3.67 3.92 217 2 103.0–104.0 755.35 145 34 6 4.26 Note: T:M—terrestrial vs. marine palynomorph ratio; G:P—gonyaulacoid versus protoperidinioid cyst ratio; SF—shoreface (0–10 mP; OFF—offshore (>30 m); SB— sequence boundary; FS—flooding surface; LST—lowstand systems tract; HST—highstand systems tract; MFS—maximum flooding surface; TS—transgressive surface.
Geosphere, December 2013
9
10
Geosphere, December 2013
600
550
500
450
400
350
300
250
200
150
0
MFS TST
TST
TST
TST TST
TST
100
0
10
30
)
to 48
40
0
30 0
to 43.25
)
10
40
60
15
80
nonsac:bisac (
5
20
Ph:AOM (
20
)
0
25
to 116
to 124
100
) 100000
200000
300000
500000
538.68
494.87 509 515
355.53 361.28
335.06
295.01
271.23
256.19
209 218.39 225 236.15
06
m6
m5.8
m5.47 m5.7
m5.45
195
190
170 175 180 185
165
160
155
150
145
140
135
130
125
115 120
110
105
100
95
m5.4
90
m5.33
85
70 75 80
65
60
55
Core
m5.3
m4.1 m4.5 m5 m5.2
Depth Sequence (mcd) Boundaries
400000
Palynomorph Concentration
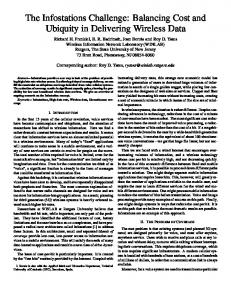
Figure 3. Ratio of terrestrial versus marine palynomorphs (T:M—green line), gonyaulacoid versus protoperidinioid dinocysts (G:P—black line), phytoclast versus amorphous organic matter (Ph:AOM—blue line), and nonsaccate versus bisaccate conifer pollen (nonsac:bisac— green line) and absolute abundance (concentration/cm3) of palynomorphs: marine dinocysts + acritarchs, (pale gray) and terrigenous pollen + embryophyte spores (dark gray) in Integrated Ocean Drilling Program Hole 27A. Stipple highlights coeval peaks in T:M, Ph:AOM, and nonsac:bisac that record increased terrigenous flux to Site 27. These are generally associated with peaks in total palynomorph abundance (concentration) and very low G:P, recording rapid burial inhibiting oxidation of susceptible protoperidinioid cysts. In contrast, transgressive systems tracts (TST) and maximum flooding surfaces (MFS) (from Miller et al., 2013a) are characterized by high G:P and low T:M, Ph:AOM, and nonsac:bisac. Seismic reflectors O6 to m4.1 (red lines) are sequence boundaries (i.e., impedance contrasts) identified during Expedition 313 and subsequently adjusted (Mountain et al., 2010; Miller et al., 2013a). Depth—meters composite depth (mcd).
of G:P (
20
20
Ratio of T:M (
Clay/Silt 0 10 Glauconite Ratio Fine/very fine quartz sand Medium & coarser quartz sand Foraminifers/shells Mica
50
Cumulative Percent
McCarthy et al.
Recovery
Depth (mcd)
Depth (mcd)
Geosphere, December 2013
750
700
650
600
550
500
450
400
350
300
0
TST
TST
MFS
100
0
2
4
8
10 12
8
)
14
10
12
16
)
18
0
14 0
2
4
6
40
8
10
60
Ph:AOM (
nonsac:bisac (
20
)
100
14
16
to 205
to 239
to 142
80
12
) 0
100000
200000 300000
400000
m5.47 m5.6
662.37 673.71 696 706.66
746
m5.7 m5.8
m5.4 m5.45
643.19
728.56
m5.3
602.25
m5
m4.5
m4.4
m4.2 m4.3
m4.1
m5.2
502.01
478.61
408.65
364.86 377.15
342.81
Depth Sequence (mcd) Boundaries
Palynomorph Concentration
Figure 4. Ratio of terrestrial versus marine palynomorphs (T:M—green line), gonyaulacoid versus protoperidinioid dinocysts (G:P—black line), phytoclast versus amorphous organic matter (Ph:AOM—blue line) and nonsaccate versus bisaccate conifer pollen (nonsac:bisac— green line) and absolute abundance (concentration per cm3) of palynomorphs (marine: dinocysts + acritarchs, pale gray) and terrigenous (pollen + embryophyte spores, dark gray) in Hole 29A. Depth—meters composite depth (mcd). Stipple highlights coeval peaks in T:M, Ph:AOM, and nonsac:bisac that record increased terrigenous flux to Site 29. These are generally associated with peaks in total palynomorph abundance (concentration) and very low G:P, recording rapid burial inhibiting oxidation of susceptible protoperidinioid cysts. Transgressive systems tracts (TST) and maximum flooding surfaces (MFS) (from Miller et al., 2013a) are characterized by high G:P and low T:M, Ph:AOM, and nonsac:bisac. Seismic reflectors m5.8 to m4.1 (red lines) are sequence boundaries (i.e., impedance contrasts) identified during Integrated Ocean Drilling Program Expedition 313 and subsequently adjusted (Mountain et al., 2010; Miller et al., 2013a).
of G:P (
6
Ratio of T:M (
0 2 4 6 Clay/Silt Ratio Glauconite Fine/very fine quartz sand Medium & coarser quartz sand Foraminifers/shells Mica
50
Cumulative Percent Core 210 215
200 205
195
170 175 180 185 190
165
160
155
145 150
130 135 140
125
115 120
110
100 105
95
90
85
75 80
70
65
60
50 55
Palynological evidence of eustasy
11
Recovery
Geosphere, December 2013
1.0
0.9
0.8
0.7
0.6
0.5
0.4
0.3
0.2
K/T
8000
m5.45 m5.47 m5.7
m5.4
0
7000
10
50
0
T:M (
20 30
)
100
6000
58H 59H 60H 61H 62H 63H 64H 65X 66X 67X 68X 69X 70X 71H 72H 73X 74X 75X 76X 77X 78X 79R 80R 81R 82R 83R 84R 85R 86R 87R 88R 89R 90R 91R 92R 93R 94R 95R 96R 97R 98R 99R 100R 101R 102R 103R 104R 105R 106R 107R 108R 109R 110R 111R 112R 113R 114R 115R 116R 117R 118R 119R 120R 121R 122R 123R 124R 125R 126R 127R 128R 129R 130R 131R 132R 133R 134R 135R 136R 137R 138R 139R 140R 141R 142R 143R 144R 145R 146R 147R 148R 149R 150R 151R 152R 153R 154R 155R 156R 157R 158R 159R 160R 161R 162R 163R 164R 165R 166R 167R 168R 169R 170R 171R 172R 173R 174R 175R 176R 177R 178X 179R 180R 181R 182R 183R 184R 185R 186R 187R 188R 189R 190R 191R 192R 193R 194R 195R 196R 197R 198R 199R 200R 201R 202R 203R 204R 205R 206R 207R 208R 209R 210R 211R 212R 213R 214R 215R 216R 217R 218R 219R 220R 221R 222R 223R 224R
55H 56H 57H
52H 53H 54H
51H
5 km
40
Core 2H 3H 4H 5H 6H 7H 8H 9H 10H 11H 12H 13H 14H 15H 16H 17H 18H 19H 20H 21R 22R 23H 25X 24H 26X 27X 28X 29X 30X 31X 32X 33X 34X 35X 36X 37X 38X 39X 40X 41X 42X 43X 44X 45R 46X 47H 48H 49H 50H
Unit III
Unit II
10
20
30
150
40
200
250
660
640
620
600
580
560
540
520
500
480
460
440
420
400
380
360
340
320
300
280
260
240
220
200
180
160
140
120
100
80
60
5000
Unit V
O.1
4000
m5
800
.2 600 .4 m5 m5 m5 .3 .47 .45 m5 .7 m5. 8 m6 O.5 m5
m4 .4 m 400 4 m .5 5
Hole M0029A T:M ( )
700
600
500
400
300
200
100
0
Depth (mcd)
Recovery
50 Latitude: 39°31.1705′N Longitude: 24.7925′W Water depth: 35.97m
42R 43R 44R 45R 46R 47R 48R 49R 50R 51R 52R 53R 54R 55R 56R 57R 58R 59R 60R 61R 62R 63R 64R 65R 66R 67R 68R 69R 70R 71R 72R 73R 74R 75R 76R 77R 78R 79R 80R 81R 82R 83R 84R 85R 86R 87R 88R 89R 90R 91R 92R 93R 94R 95R 96R 97R 98R 99R 100R 101R 102R 103R 104R 105R 106R 107R 108R 109R 110R 111R 112R 113R 114R 115R 116R 117R 118R 119R 120R 121R 122R 123R 124R 125R 126R 127R 128R 129R 130R 131R 132R 133R 134R 135R 136R 137R 138R 139R 140R 141R 142R 143R 144R 145R 146R 147R 148R 149R 150R 151R 152R 153R 154R 155R 156R 157R 158R 159R 160R 161R 162R 163R 164R 165R 166R 167R 168R 169R 170R 171R 172R 173R 174R 175R 176R 177R 178R 179R 180R 181R 182R 183R 184R 185R 186R 187R 188R 189R 190R 191R 192R 193R 194R 195R 196R 197R 198R 199R 200R 201R 202R 203R 204R 205R 206R 207R 208R 209R 210R 211R 212R 213R 214R 215R 216R 217R
36R 37R 38R 39R 40R 41R
31R 32R 33R 34R 35R
25R 26R 27R 28R 29R 30R
23R 24R
22R
21R
20R
19R
15R 16R 17R 18R
13R 14R
1R 2R 3R 4R 5R 6R 7R 8R 9R
200
100
10R 11R 12R
Unit I
50
40
0
IODP Expedition 313 Hole M0029A Ph:AOM ( )
20
0
0
IODP31329A Core
Figure 5. The palynofacies (i.e., the acid-resistant organic fraction of the sediment) clearly characterizes the lithological units and unconformity bounded sequences in Integrated Ocean Drilling Program (IODP) Holes 27A and 29A. Terrigenous flux, represented by high T:M (terrestrial versus marine palynomorphs—green curve) and high Ph:AOM (phytoclast versus amorphous organic matter—blue curve), is especially high in lithologic unit III around sequence boundary m5.4 (where the highest T:M peak was measured in both holes) and in upper lithologic unit II around sequence boundaries m4.5, m4.3, m4.2, and m4.1. Ph:AOM increases dramatically when the shelf progrades past each site, whereas peaks in T:M appear to be generated by increased proximity to the shoreline and accelerated resedimentation of terrigenous particles seaward, particularly past the shelf break. K/T is Cretaceous-Tertiary (Paleogene) boundary.
O.1
O.5
m6
m5.8
Unit VI
Unit IV
m5.2 m5.3
m4.4
m4.5 m5
0
Recovery
Latitude: 39° 38.04606′N Longitude: 73° 37.30146′W Water depth: 33.5m Depth (mcd)
12
0.1
0
IODP31327A
IODP Expedition 313 Hole M0027A Ph:AOM ( )
McCarthy et al.
TWTT (s)
Palynological evidence of eustasy
Hole 27A 27A 27A 27A 27A 27A 27A 27A 27A m4.1 27A 27A 27A 27A m4.5 27A 27A m5 27A m5.2 27A 27A m5.3 27A 27A m5.3.3 27A 27A 27A 27A m5.4 27A 27A 27A 27A 27A 27A m5.45 27A 27A 27A m5.47 27A m5.7 27A 27A 27A 27A 27A 27A 27A 27A 27A 27A m5.8 27A m6 27A O6 29A 29A 29A 29A 29A 29A 29A 29A m4.1 29A 29A
Core 63 65 65 66 67 67 67 69 70 72 72 75 75 75 77 82 83 88 91 94 95 98 101 102 103 105 109 114 114 115 116 122 125 127 148 149 150 151 157 163 164 169 170 174 176 186 51 54 62 63 64 65 67 69 72 73
TABLE 5. PHYTOCLAST VERSUS AMORPHOUS ORGANIC MATTER AND PALYNOFACIES TYPE IN INTEGRATED OCEAN DRILLING PROGRAM EXPEDITION 313 HOLES M0027A AND M0029A Section Depth in core Depth mcd Phytoclasts AOM Ph:AOM 1 36.0–37.0 189.12 109 1 109 2 24.0–25.0 193.85 154 2 77 CC 195.22 124 1 124 1 195.56 93 3 31 1 70.0–71. 0 2 68.0–70.0 196.01 103 1 103 2 100.0–102.0 197.37 69 1 69 CC 201.05 65 1 65 1 CC 207.10 86 26 3.31 1 1 49.0–50.0 207.56 72 1 72 209.00 1 14.0–16.0 210.58 38 54 0.70 1 22.0–24.0 210.70 46 50 0.92 1 50.0–52.0 216.72 67 22 3.05 1 111.0–112.0 217.32 38 58 0.66 218.39 2 82.0–83.0 218.53 80 1 80.00 1 90.0–91.0 223.21 37 37 1.00 225.45 2 24.0–25.0 233.21 89 2 44.50 236.15 3 11.0–12.0 237.62 161 37 4.35 1 50.0–51.0 250.26 120 126 0.95 256.19 CC 262.05 197 42 4.69 1 2 100.0–101.0 270.56 65 164 0.40 271.23 1 109.0–111.0 272.21 195 2 97.50 1 58.0–60.0 280.08 192 20 9.60 1 90.0–92.0 290.31 233 2 116.50 2 11.0–13.0 294.07 42 168 0.25 295.01 1 50.0–51.0 296.01 54 1 54.00 CC 304.95 102 102.00 1 1 110.0–111.0 314.91 20 54 0.37 1 33–34 329.39 176 37 4.76 1 71–73 329.77 145 53 2.74 1 125.0–126.0 333.36 180 23 7.83 336.06 2 38.0–39.0 337.04 69 135 0.51 2 58.0–60.0 347.94 10 85 0.11 1 47–48 354.59 23 167 0.14 355.53 1 15.0–16.0 359.71 226 23 9.83 361.28 3 10.0–12.0 423.66 208 10 20.80 2 45.0–46.0 425.56 144 50 2.88 1 55–56 427.21 178 51 3.49 2 110.0–111.0 432.31 163 50 3.26 2 122.0–123.0 450.74 178 22 8.09 1 115.0–116.0 467.46 98 128 0.77 2 110.0–111.0 470.46 176 34 5.18 1 484.93 143 58 2.47 1 15.5–16.5 488.17 36 187 0.19 1 101–102 494.77 88 11 0.80 494.87 1 77.0–78.0 500.63 63 156 0.40 509 1 95.0 –96.0 522.66 39 164 0.24 538.68 1 115–116 284.31 220 3 73.33 CC 294.71 142 1 142.00 1 116–117 314.81 154 36 4.28 2 14–15 318.11 183 4 45.75 CC 324.30 191 25 7.64 1 2 18–19 324.49 19 176 0.11 CC 333.94 115 30 3.83 1 CC 339.99 147 5 29.40 1 342.81 2 39–40 345.21 83 134 0.62 CC 351.8 125 3 41.67 1
Palynofacies type 1 1 1 1 1
1 2 2 1 2 1 2 1 1 2
2 1 1 1 2 1 2 1 1 1 2 2 2 1 1 1 1 1 1 2 2 3 2 2 2 3 1 1 1 1 2
2 (continued)
Geosphere, December 2013
13
McCarthy et al.
TABLE 5. PHYTOCLAST VERSUS AMORPHOUS ORGANIC MATTER AND PALYNOFACIES TYPE IN INTEGRATED OCEAN DRILLING PROGRAM EXPEDITION 313 HOLES M0027A AND M0029A (continued) Hole Core Section Depth in core Depth mcd Phytoclasts AOM Ph:AOM 29A 77 CC 359.41 161 4 40.25 1 29A 78 CC 360.82 143 53 2.70 2 m4.2 364.86 29A 80 1 109–110 366.60 239 1 239.00 368.10 224 5 44.80 29A 81 1 109–111 m4.3 377.15 29A 84 2 122–123 380.43 195 21 9.29 29A 85 CC 385.75 205 1 205.00 1 29A 88 1 102–103 390.93 146 52 2.81 29A 91 CC 399.06 210 11 19.09 1 29A 92 1 100–101 403.11 184 23 8.00 29A 93 2 123–124 407.72 133 62 2.15 m4.4 408.65 29A 94 2 110–111. 410.81 199 7 28.43 29A 95 1 41–42 411.67 218 8 27.25 29A 98 2 70–71 421.26 202 5 40.40 29A 99 2 14–15 425.11 223 14 15.93 29A 101 1 128–129 430.84 233 12 19.42 29A 104 1 98–99 439.69 196 17 11.53 29A 106 2 36–37 443.62 191 16 11.94 29A 107 3 40–41 447.81 7 224 0.03 29A 109 2 20–21 452.61 156 25 6.24 29A 110 2 21–22 455.39 180 16 11.25 29A 111 1 92–93 457.93 176 45 3.91 29A 114 1 35–37 466.51 103 93 1.11 29A 114 CC 467.16 94 132 0.71 2 m4.5 478.61 29A 119 CC 479.50 184 11 16.73 1 29A 120 1 32–33 481.73 66 126 0.53 29A 124 2 32–33 495.11 74 127 0.58 m5 502.01 29A 127 3 31–32 505.35 76 127 0.60 29A 130 2 32–33 513.73 24 159 0.15 29A 131 CC 514.96 136 80 1.70 2 29A 135 CC 527.16 80 103 0.78 2 29A 148 CC 560.71 185 11 16.82 1 29A 150 1 95–96 567.76 168 42 4.00 29A 157 2 20–21 589.86 192 21 9.14 29A 159 2 20–21 595.76 150 38 3.94 29A 161 2 33–34 602.21 105 110 0.95 m5.2 602.25 29A 165 2 154–156 615.64 82 133 0.62 29A 168 1 21–22 621.92 125 128 0.98 29A 168 2 96–97 624.17 75 92 0.82 29A 170 2 150–152 630.82 34 198 0.17 29A 175 2 110–111 642.62 37 187 0.20 m5.3 643.19 29A 178 2 67–68 649.62 130 93 1.40 29A 179 2 5–6 650.99 173 63 2.75 29A 181 2 62–63 657.38 55 75 0.73 m5.4 662.37 29A 186 2 95–96 669.91 121 77 1.57 29A 188 2 60–61 673.81 59 145 0.41 m5.45 673.71 29A 191 2 22–23 681.27 49 180 0.27 29A 192 1 88–89 683.59 31 166 0.19 29A 194 2 23–24 690.55 14 238 0.06 29A 195 2 124–125 694.60 8 196 0.04 m5.47 696 29A 196 2 50–52 696.93 15 205 0.07 m5.6 706.66–710 29A 202 2 6–7 712.96 37 184 0.20 29A 204 1 145 –147 717.71 9 195 0.05 m5.7 728.56 29A 208 2 44–45 730.40 142 47 3.02 29A 209 1 111–112 732.62 143 53 2.70 29A 210 2 30–31 736.36 74 66 1.12 m5.8 746 Note: Ph—Phytoclast (Ph); AOM—amorphous organic matter; MCD—meters composite depth. *Palynofacies type following Batten (1996).
14
Geosphere, December 2013
Palynofacies type
1 1 1 2 1 2 1 1 1 1 1 1 1 2 1 1 1 2
2 2 2 3
1 1 1 2 2 2 2 3 2 2 2 2 2 2 2 3 3 3 3 2 3 1 1 2
Hole 27A 27A 27A 27A 27A 27A 27A m4.1 27A 27A 27A m4.5 27A 27A m5 27A 27A m5.2 27A 27A 27A 27A m5.3 27A 27A 27A 27A 27A 27A 27A 27A m5.47 27A 27A 27A 27A 27A 27A 27A 27A 27A 27A 27A 27A 27A 27A 27A 27A 27A 27A 27A 27A
Geosphere, December 2013
127R 148R 149R 150R 150R 151R 151R 152R 152R 153R 154R 155R 156R 156R 157R 159R 160R 160R 161R 162R
91R 95R 101R 104R 105R 109R 114R 115R
80R 82R x 83R 84R 85R 88R
75R 77R
71R 72R 73R
Core 65R/ 66R 67R 67R 69R 70R 70R
TABLE 6. RATIOS OF NONSACCATE VERSUS BISACCATE POLLEN FROM INTEGRATED OCEAN DRILLING PROGRAM EXPEDITION 313 HOLES M0027A AND M0029A AND SUMMARY OF POLLEN DATA FROM HOLE M0027A Section Depth in core Depth mcd Nonsac:Bisac Bisac TCT Hemlock Oak Hickory Elm 2 24–25 193.85 23.71 10.5 8 0 152 10 6 1 70–71 195.60 17.27 11 13 0 66 11 2 2 68–70 196.01 14.41 17 14 2 134 27 2 2 100–101 199.10 17.00 15 16 2 94 16 9 1 40–41 204.41 5.56 52.5 8 0 126 32 6 1 49–50 207.60 6.30 37 20 0 126 17 5 2 7–8 208.70 10.20 24.5 19 0 182 8 3 209 1 17–18 209.10 2.64 88 18 0 151 10 6 1 22–24 210.70 4.18 50.5 17 0 132 15 2 1 57–58 211.45 5.06 50 18 0 150 14 6 218.39 2 82–83 218.53 2.85 87.5 16 1 150 17 7 1 90–91 223.21 2.22 95 16 0 132 3 5 225.45 1 92–93 226.48 6.41 39 11 0 162 18 5 2 24–25 233.21 15.20 15 37 1 134 12 1 x x 236.15 3 11–12 239.21 23.40 10 10 0 169 8 9 2 41–42 238.6 18.72 12.5 13 0 157 11 0 3 27–28 242.72 10.18 22.5 8 0 172 13 4 1 50–51 250.26 5.98 42.5 29 0 167 5 5 256.19 CC 9–10 262.05 5.46 41 2 0 135 29 7 1 109–111 272.21 4.08 62 18 0 123 29 8 1 90–92 290.31 5.31 49 18 0 144 21 6 CC x 301.61 11.84 19 4 0 113 32 9 CC 0–11 304.95 4.51 47.5 6 0 85 65 5 1 10–11 314.91 5.45 45.5 17 0 151 3 3 1 71–73 329.77 6.73 20.5 11 0 65 18 2 1 3–4 332.14 5.96 24 13 0 53 15 3 355.53 1 15–16 359.71 2.94 78 22 2 122 27 2 3 10–12 423.66 4.44 58.5 33 0 152 21 2 CC 11–12 426.71 3.81 62.5 10 1 142 15 3 1 55–56 427.21 11.80 20 13 1 156 7 4 2 100–101 429.16 9.14 28 24 0 183 5 1 2 55–56.5 431.86 3.71 61 9 0 133 20 2 CC x 432.86 5.65 40.5 12 0 136 23 2 1 20– 21 432.96 14.63 16 7 0 173 12 1 1 99–100 433.75 13.11 18 13 0 179 6 3 2 127–128 438.58 9.38 26 6 0 174 5 2 CC x 441.91 4.43 54 8 0 151 15 3 CC x 445.07 4.61 51 19 1 111 26 5 1 18– 19 445.14 6.68 37 16 0 174 7 1 2 114–115 447.60 11.27 20.5 18 0 149 7 2 2 122–123 450.74 14.76 17.5 14 0 179 7 1 2 120–121 456.82 10.68 23.5 10 0 172 4 2 2 32–34 458.96 7.41 32 21 0 143 18 0 CC x 459.88 10.71 21 13 0 138 25 1 2 30–31 462.01 7.83 30 9 0 145 22 1 2 30–32 464.69 4.08 62 11 2 130 34 6 0 0 0 0 0 0 0 0 0 0 0 0 6 6 0 5 3 0 0 0
54 52 67 55 43 62 56 42 35 57 62 73 43 49 52 58 52 48 58 70
51 75 65 66 53 76 40 53
38 53 32 48
0 0 0 0 0 0 6 1 0 0 2 6
54 42
58 50
47 45 65
Other 71 98 66 118 120 64 38
0 1
0 5
0 0 0
Palm 2 0 0 0 0 0 0
307 318.5 300.5 256 284 287 269.5 250 254 270 293 286 284 251.5 270.5 274.5 269 246 265 315 (continued)
265 315 309 244 261.5 295.5 158.5 167
244 246.5 251.5 296.5
289 243
336.5 306
320 261.5 303
Total 259.5 201 262 270 344.5 270 274.5
Palynological evidence of eustasy
15
Hole 27A 27A 27A 27A 27A 27A 27A 27A 27A 27A 27A m5.8 27A 27A m6 27A 27A 27A O6 29A 29A 29A 29A 29A 29A m4.1 29A 29A m4.2 29A 29A m4.3 29A 29A 29A 29A m4.4 29A 29A 29A 29A 29A 29A 29A 29A 29A 29A m4.5 29A 29A 29A 29A
16
Geosphere, December 2013
120 120 121 126
95 95 96 101 101 106 109 113 114 117
85 88 90 92
82 83
74 76
62 63 64 69 69 70
186R 188R 190R
176R 177R
Core 163R 164R 166R 167R 168R 169R 170R 171R 172R 174R 175R
TABLE 6. RATIOS OF NONSACCATE VERSUS BISACCATE POLLEN FROM INTEGRATED OCEAN DRILLING PROGRAM EXPEDITION 313 HOLES M0027A AND M0029A AND SUMMARY OF POLLEN DATA FROM HOLE M0027A (continued) Section Depth in core Depth mcd Nonsac:Bisac Bisac TCT Hemlock Oak Hickory Elm 1 115–116 467.46 11.21 21.5 11 0 164 13 2 2 61–62 471.47 1.53 166.5 20 1 107 45 2 1 15–16 475.62 1.41 199 27 10 131 29 1 CC x 481.60 9.00 24 12 0 109 24 2 1 21–22 481.76 3.52 66 7 0 129 17 11 1 32–33 484.93 3.27 73.5 17 1 146 15 3 1 51–52 488.17 20.09 11.5 10 0 173 8 0 CC x 492.47 1.81 129.5 36 4 112 21 3 1 14.5–15.5 492.59 6.67 37.5 20 0 170 9 2 1 101–103 494.77 6.27 40.5 19 0 171 17 0 1 28–29 497.09 3.12 82 38 2 140 11 1 494.87 1 77–78 500.63 2.48 92.5 19 0 150 24 2 1 50–52 503.41 1.65 142 8 0 171 9 5 509 2 95–96 523.66 2.84 96.5 28 2 172 20 3 2 60–61 529.21 0.50 549.5 53 13 117 37 5 1 119–120 534.60 1.88 128.5 23 0 129 34 1 538.68 1 116–117 314.81 5.07 44 3 0 148 22 7 2 14–15 318.11 1.48 1 120–121 320.21 1.87 126.5 41 6 92 20 7 1 44.5–55.5 335.46 2.29 96.5 14 0 80 40 8 2 103–105 337.55 4.21 53 36 2 89 15 9 1 107–108 339.13 5.13 342.81 2 57–58 352.32 7.88 1 120–121 355.55 2.08 108 24 0 130 18 4 364.86 1 93–94 372.54 7.20 30.5 16 0 101 21 3 1 10–11 376.00 11.60 377.15 2 99–100 383.10 14.33 15 15 0 125 21 7 1 102–103 390.93 12.50 2 81–82 396.00 8.70 1 100–101 403.11 7.95 21.5 10 0 92 18 5 408.65 1 41–42 411.67 12.90 2 26–27 413.02 13.45 17 15 0 123 13 5 2 103–104 416.84 4.87 46 12 0 91 17 4 1 128–129 430.84 4.20 2 37–38 431.43 3.86 56 10 83 26 6 2 36–37 443.62 3.60 2 20–21 452.61 2.77 77 18 0 131 13 5 1 102–103 464.13 2.09 106 5 2 143 15 8 1 35–37 466.51 1.01 217.5 11 0 103 15 8 2 60–61 477.41 2.03 107.5 12 0 144 10 8 478.61 1 32–33 481.73 2.20 2 36–37 483.28 3.80 64 8 0 167 10 0 1 113–114 485.08 3.10 1 100–101 500.71 1.39 45 48 86 56
0 0 0 1
59
91
0
0
72 103
46
0
3 2
50
74
1
1
41
60 77 74
0 0 0
1
44
48 49 54
34 42
Other 47 79 76 69 67 57 40 58 49 47 61
0
1 2 0
0 0
Palm 4 0 7 0 1 1 0 0 0 0 3
(continued)
308
289 327 440.5 338.5
272
248 275
192.5
234
246.5
326
352.5 315.5 278
268
370.5 825.5 369.5
321.5 377
Total 262.5 420.5 480 240 298 313.5 242.5 363.5 287.5 294.5 338
McCarthy et al.
TABLE 6. RATIOS OF NONSACCATE VERSUS BISACCATE POLLEN FROM INTEGRATED OCEAN DRILLING PROGRAM EXPEDITION 313 HOLES M0027A AND M0029A AND SUMMARY OF POLLEN DATA FROM HOLE M0027A (continued) Hole Core Section Depth in core Depth mcd Nonsac:Bisac Bisac TCT Hemlock Oak Hickory Elm m5 502.01 29A 128 3 73–74 508.79 3.00 29A 129 1 70–71 509.56 0.03 112.5 15 0 122 29 2 29A 131 2 78–79 517.26 4.07 53.5 10 0 132 26 6 29A 132 2 30–31 519.81 3.20 71.5 24 1 96 34 3 29A 133 1 48–49 521.54 3.60 29A 136 1 73–75 528.48 6.13 29A 137 1 90–91 531.11 4.82 29A 138 1 9–11 533.35 8.64 25 14 0 128 8 11 29A 139 1 24–26 536.56 4.59 47.5 14 0 143 13 3 29A 139 2 12–13 537.93 2.93 75.5 21 4 128 6 3 29A 144 1 29–30 551.85 9.20 29A 145 1 133–134 555.94 5.02 44 15 1 14 14 4 29A 148 3 10–11 563.25 2.29 29A 149 3 10–11 565.05 3.30 29A 151 1 94–95 570.80 2.66 83.5 11 1 122 9 0 29A 151 3 17–18 573.43 3.03 29A 154 2 90–91 581.45 8.19 26 26 0 74 12 4 29A 156 1 20–21 585.31 3.65 29A 158 2 5–6 591.96 2.36 29A 160 1 28–29 597.59 1.90 m5.2 602.25 605.19 1.86 111.5 12 2 121 8 3 29A 29A 165 2 154–156 615.64 5.60 29A 167 2 21–22 619.54 1.30 29A 168 1 21–22 621.92 3.83 60 8 0 129 17 11 29A 170 2 150–152 630.82 1.65 29A 173 x x x 3.2 29A 175 2 110–111 642.62 6.12 35.5 10 0 136 14 4 643.19 m5.3 29A 176 1 76–77 643.82 1.70 29A 179 1 5–6 650.99 1.40 662.37 m5.4 29A 183 1 110–111 662.81 1.47 29A 183 2 110–111 663.81 5.17 42 15 0 137 15 10 29A 184 1 113–114 665.81 1.2 1 7.25 29A 185 666.00 m5.45 673.71 29A 190 1 130–131 677.95 0.66 29A 190 2 34–35 678.45 1.26 29A 191 2 22–23 681.27 1.30 29A 195 2 124–125 694.60 2.10 696 m5.47 29A 196 2 50–52 696.93 2.47 64.5 6 0 116 8 1 29A 199 2 46–47 706.02 2.89 706.66–710 m5.6 29A 204 1 145–147 717.71 7.62 29 17 0 117 30 1 29A 207 3 x 727.00 11.72 18.5 11 0 156 13 2 m5.7 x x x 728.56 29A 209 1 111–112 732.62 0.98 258 55 25 103 24 3 29A 211 2 111–112 739.35 0.35 m5.8 x x x 746 29A 215 1 5–6 750.91 1.24 29A 217 1 101–103 753.87 4.54 Note: Nonsac:Bisac—nonsaccate vs. bisaccate pollen; mcd—meters composite depth; TCT—type cypress-cedar pollen. *Prefixes m, O indicate sequences. 48
44
29
38 29 43
0
0
0 0 0
97
1
0
79
1
65
53
0
1
55 45 57
0 0 0
63
72 45 72
1 0 0
0
Other
Palm
Geosphere, December 2013
511
250 229.5
224.5
263
246.5
291
320.5
241
306.5
265
241 265.5 294.5
353.5 272.5 301.5
Total
Palynological evidence of eustasy
17
Depth (mcd)
0
Geosphere, December 2013
540
520
500
480
460
440
420
400
380
360
340
320
300
280
260
240
220
200
180
160
140
120
100
80
60
40
20
Core
58H 59H 60H 61H 62H 63H 64H 65X 66X 67X 68X 69X 70X 71H 72H 73X 74X 75X 76X 77X 78X 79R 80R 81R 82R 83R 84R 85R 86R 87R 88R 89R 90R 91R 92R 93R 94R 95R 96R 97R 98R 99R 100R 101R 102R 103R 104R 105R 106R 107R 108R 109R 110R 111R 112R 113R 114R 115R 116R 118R 117R 119R 120R 121R 122R 123R 124R 125R 126R 127R 128R 129R 130R 131R 132R 133R 134R 135R 136R 137R 138R 139R 140R 141R 142R 143R 144R 145R 146R 147R 148R 149R 150R 151R 152R 153R 154R 155R 156R 157R 158R 159R 160R 161R 162R 163R 164R 165R 166R 167R 168R 169R 170R 171R 172R 173R 174R 175R 176R 177R 178X 179R 180R 181R 182R 183R 184R 185R 186R 187R 188R 189R 190R 191R 192R 193R 194R
55H 56H 57H
52H 53H 54H
51H
1H 2H 3H 4H 5H 6H 7H 8H 9H 10H 11H 12H 13H 14H 15H 16H 17H 18H 19H 20H 21R 22R 23H 24H 25X 26X 27X 28X 29X 30X 31X 32X 33X 34X 35X 36X 37X 38X 39X 40X 41X 42X 43X 44X 45R 46X 47H 48H 49H 50H
L. multivirgatum
C. minimum
D. pseudocolligerum
H. rigaudiae
C. placacanthum
S. soucouyantiae
A. spiridoides
O. centrocarpum A. tectatum
L. machaerophorum P. laticinctum
L. truncatum modicum
P. golzowense
S. nephroides
Recovery
> 20%
5 – 20%
C. tenuitabulatum
C. amiculum S. conerae
M. aspinatum
T. pelagica
S. hamulatum C. satchelliae
E. insigne
C. cantharellum
D. paradoxum
Homotryblium spp.
O. longispinigerum
P. zoharyi
S. brevispinosa
L. truncatum truncatum C. poulsenii
U. aquaeductum
T. papulum
I. lacrymosa
H. obscura H. tectata
B. sphaerica
Spiniferites sp.
Brigantedinium sp.
Figure 6. Semiquantitative depiction of the stratigraphic distribution of selected ubiquitous and age-diagnostic dinocysts in Integrated Ocean Drilling Program Hole 27A (raw data available in Supplemental Table 1 [see footnote 1]). Red lines represent sequence-bounding unconformities (depths of impedance contrasts follow Miller et al., 2013a). Zones are based on de Verteuil and Norris (1996), as depicted in Figure 2 and discussed in the text, and ages of zone boundaries are calibrated to the Gradstein et al. (2004) time scale. Depth: mcd—meters composite depth; mbsf—meters below seafloor. Useful datums are listed in Table 1.
Lejeunecysta sp.
Latitude: 39°38.04606′ N Longitude: 73°37.30146′ W Water depth: 33.5 m
C. aubryae
< 5%
C. galea
Stratigraphic Distribution - Dinocysts
Age (Ma)
Abundant
Common
Rare
06
m5.8 m6
22.36
19.4
18.4
m5.45 m5.47 18.1 m5.7
m5.4
DN1
DN2a
DN2b
DN3
m4.1 DN5b m4.5 14.2 m5 DN5a m5.2 14.8 DN4 m5.3 15.97 m5.33
D. phosphoritica
18 DINOCYST ZONES
IODP Expedition 313 Hole MM0027
McCarthy et al.
Geosphere, December 2013
700
600
500
400
300
200
100
0
1R 2R 3R 4R 5R 6R 7R 8R 9R
42R 43R 44R 45R 46R 47R 48R 49R 50R 51R 52R 53R 54R 55R 56R 57R 58R 59R 60R 61R 62R 63R 64R 65R 66R 67R 68R 69R 70R 71R 72R 73R 74R 75R 76R 77R 78R 79R 80R 81R 82R 83R 84R 85R 86R 87R 88R 89R 90R 91R 92R 93R 94R 95R 96R 97R 98R 99R 100R 101R 102R 103R 104R 105R 106R 107R 108R 109R 110R 111R 112R 113R 114R 115R 116R 117R 118R 119R 120R 121R 122R 123R 124R 125R 126R 127R 128R 129R 130R 131R 132R 133R 134R 135R 136R 137R 138R 139R 140R 141R 142R 143R 144R 145R 146R 147R 148R 149R 150R 151R 152R 153R 154R 155R 156R 157R 158R 159R 160R 161R 162R 163R 164R 165R 166R 167R 168R 169R 170R 171R 172R 173R 174R 175R 176R 177R 178R 179R 180R 181R 182R 183R 184R 185R 186R 187R 188R 189R 190R 191R 192R 193R 194R 195R 196R 197R 198R 199R 200R 201R 202R 203R 204R 205R 206R 207R 208R 209R 210R 211R 212R 213R 214R 215R 216R 217R
36R 37R 38R 39R 40R 41R
31R 32R 33R 34R 35R
25R 26R 27R 28R 29R 30R
23R 24R
22R
21R
20R
19R
15R 16R 17R 18R
13R 14R
10R 11R 12R
m 5.6 m 5.7 m 5.8
m 5.47
m 5.45
m 5.3 m 5.4
m 5.2
m 5.0
m 4.5
m 4.4
m 4.2 m 4.3
m 4.1
S. conerae
D. cladoides
C. amiculum
C. cantharellum
C. tenuitabulatum
E. insigne
C. satchelliae
S. hamulatum
L. multivirgatum
O. longispinigerum
C. aubryae
D. paradoxum
A. tectatum
A. spiridoides
S. soucouyantiae
P. laticinctum
C. placacanthum
P. zoharyi
L. truncatum modicum C. poulsenii
C. minimum
S. brevispinosa
L. truncatum truncatum H. obscura
H. tectata
T. papulum
U. aquaeductum
T. harpagonium
S. dionaeacysta
A. zevenboomii
Brigantedinium sp. B. sphaerica
Spiniferites sp.
P. golzowense
Lejeunecysta sp.
19.4
18.4
18.1
15.97
14.8
14.2
13.3
Age (Ma)
Common Abundant
Rare
> 20%
< 5%
DN2a
DN2b
DN2c
DN3
DN4
DN5a
DN5b
DN6
Figure 7. Semiquantitative depiction of the stratigraphic distribution of selected ubiquitous and age-diagnostic dinocysts in Integrated Ocean Drilling Program Hole 29A (raw data available in Supplemental Table 2 [see footnote 2]). Depth: mcd—meters composite depth. Red lines represent seismic reflectors interpreted as sequence-bounding unconformities (depths of impedance contrasts follow Miller et al., 2013a). Zones are based on de Verteuil and Norris (1996) as depicted in Figure 2, and ages of zone boundaries are calibrated to the Gradstein et al. (2004) time scale. Useful datums are listed in Table 2.
Depth (mcd)
Core
Latitude: 39° 31.1705′ N Longitude: 24.7925′ W Water depth: 35.97 m
Recovery
5 – 20%
M. aspinatum
Stratigraphic Distribution - Dinocysts
DINOCYST ZONES
IODP Expedition 313 Hole MM0029A
Palynological evidence of eustasy
19
McCarthy et al. Lithologic Unit VI: Sequence m5.8 G:P values are typically relatively low in sequence m5.8 at both sites where characteristic dinocyst taxa in include Lejeunecysta spp., Brigantedinium spp., Cleistosphaeridium placacanthum, Batiacasphaera sphaerica, Dapsilidinium pseudocolligerum, Apteodinium tectatum, Apteodinium spiridoides, Operculodinium longispinigerum, Hystrichokolpoma
Figure 8. Common marine palyno morphs in sequence m5.8 (lower Burdigalian, dinoflagellate zones DN2a, DN2b), including species, sample number, depth (in parentheses), and England Finder coordinates. (1) Batiacasphaera sphaerica Stover 1977: 313–29A-211R1 (31–32 cm), M54/4-N58/1. (2) Cordosphaeridium cantharellus (Brosius) Sarjeant, 1981: 313–29A-208R2 (44–45 cm), F55/0–1. (3) Cerebrocysta satchelliae de Verteuil and Norris 1996: 313–29A-208R2 (44–45 cm), T71/2. (4) Distatodinium paradoxum (Brosius) Eaton, 1976: 313–29A-208R2 (44–45 cm), W38/1–3. (5) Cordosphaeridium minimum: 313–29A-208R2 (44–45 cm), N43/0–3. (6) Cousteaudinium aubryae de Verteuil and Norris 1996: 313–29A-211R1 (31– 32 cm), P57–0. (7) Stoverocysta conerae Biffi and Manum 1988: 313–29A-208R2 (44–45 cm). (8) Cribroperidinium tenuitabulatum (Gerlach) Helenes 1984: 313–27A-165R-CC; 10. (9) Cleistosphaeridium placacanthum: 313–29A-211R1 (31– 32 cm). (10) Sumatradinium soucouyantiae de Verteuil and Norris 1992: 313–29A-208R2 (44–45 cm), R67/2. (11) Hystrichokolpoma rigaudiae Deflandre and Cookson 1955: 313–29A-211R1 (31–32 cm), P67–1. (12) Spiniferites mirabilis (Rossignol) Sarjeant: 313–29A212R1 (38–39 cm), N36/0–3.
20
rigaudiae, Cousteaudinium aubryae, Distatodinium paradoxum, and Paleocystodinium sp. (Figs. 6, 7, and 8; Tables 1 and 2; Supplemental Tables 1 and 2 [see footnotes 1 and 2]). This assemblage is similar to that reported by de Verteuil and Norris (1996) in their Sumatradinium soucouyantiae interval zone found in the Early Miocene Popes Creek Sand Member of the Calvert Formation of Maryland and Virginia
(equivalent to the lower Kirkwood Formation of New Jersey). Several biostratigraphically important Early Miocene taxa have their HO in sequence m5.8 at both sites (Figs. 6 and 7; Tables 1 and 2), e.g., Caligodinium amiculum, Cribroperidinium tenuitabulatum, and Dinopterigium cladoides. This is consistent with other chronological indicators that bracket the age of this sequence between 20.2 and 19.2 Ma,
1
2
4
5
6
7
8
9
10
11
Geosphere, December 2013
3
12
Palynological evidence of eustasy lowermost Burdigalian, i.e., calcareous nannofossils assigned to upper zone NN2 (Browning et al., 2013). The HO of Caligodinium amiculum (in sample 27A-164R-2, 110–111 cm, 470.46 mcd) and the lowest occurrence (LO) of Exochosphaeridium insigne (in sample 27A-156R-1, 18–19 cm, 445.14 mcd) occur within the thick sequence m5.8 in Hole 27A, marking the boundary between subzones DN2a and DN2b, ca. 19.5 Ma (Fig. 6; Table 1) In contrast, Caligodinium amiculum is present throughout the much thinner sequence in Hole 29A and Exochosphaeridium insigne is not present (Fig. 7; Table 2), suggesting that sequence m5.8 is truncated at Site 29. Terrestrial palynomorphs generally dominate assemblages in sequence m5.8 at both sites, with T:M between 1.37 and 20.90 (mean 5.68, n = 32) in the thick sequence in Hole 27A, and between 1.15 and 11.82 (mean 3.91, n = 7) in the more distal Hole 29A (Fig. 5). Pollen assemblages in Hole 27A are dominated by Quercus (oak) and Carya (hickory), with highly variable concentrations of bisaccate pollen (nonsac:bisac ranges 0.59–20.09, mean = 6.85, n = 36 in Hole 27A; Fig. 3; Table 6). Several peaks (~3%–12%) in inaperturate (TCT, i.e., type cypress-cedar) conifer pollen in sequence m5.8 are probably related to development of coastal wetlands during the early Burdigalian. There is a peak in Tsuga (hemlock) in Hole 29A that is apparently not represented in Hole 27A, possibly correlating with the barren sandy sediments at the top of the sequence at this neritic site. The palynofacies vary from rich in AOM (type 2) to very rich in phytoclasts (type 1) in the thick sequence m5.8 at Site 27 (Fig. 3; Table 5), with an increase in phytoclast abundance upsequence, particularly above ~465 mcd. It is in this sequence that phytoclasts first become an abundant component of the palynofacies in Hole 27A, first exceeding AOM in sample 27A-169R-1 (32–33 cm, 484.93 mcd; Figs. 3 and 5; Table 5). Phytoclasts also exceed AOM in the three samples quantitatively analyzed for palynofacies in the thin sequence m5.8 in Hole 29A (mean Ph:AOM = 2.28, range 1.12–3.02; Figs. 4 and 5; Table 5), suggesting that the thin sequence m5.8 in Hole 29A does not correlate with the oldest sediments in this sequence in Hole 27A, which are still AOM dominated. These indications of increased terrigenous flux are consistent with the presence of unfossiliferous sands in the upper 50 m of lithologic unit VI in Hole 27A. Bisaccate conifer pollen continues to dominate the pollen assemblage in several samples analyzed from this sequence in Hole 29A, recording continued dominance of long-distance transport (Table 6).
Lithologic Unit V: Sequence m5.7 Common dinocyst taxa in sequence m5.7 at both sites include Batiacasphaera sphaerica, Cleistosphaeridium placacanthum, Apteodinium tectatum, Dapsilidinium pseudocolligerum, Operculodinium centrocarpum, Operculodinium longispinigerum, and Hystrichokolpoma rigaudiae (Figs. 6 and 7; Supplemental Tables 1 and 2 [see footnotes 1 and 2]). The sparse phytoclast-dominated assemblage very rich in terrestrial palynomorphs in the two samples analyzed from Hole 27A precludes a more definitive age assignment than DN2–top DN4. This is not surprising, given the extraordinarily high abundances of fungal spores in the two samples analyzed from Hole 27A that record an exceptionally strong terrestrial influence. In sample 29A-204R-1 (145–147 cm, 717.71 mcd), however, Exochosphaeridium insigne co-occurs with Cordosphaeridium cantharellus (Fig. 7; Table 2), constraining these sediments to DN2b (ca. 19.5–18.4 Ma). This is consistent with a single calcareous nannofossil assignment of upper zone NN2 (Browning et al., 2013). G:P is high in this sequence, 2.8 and 5.0 in the 2 samples from Hole 27A and ranging from 2.07 to 7.89 in Hole 29A, although protoperidinioid taxa are common in some samples (primarily the ubiquitous Lejeunecysta and Brigantedinium spp., but also including lower concentrations of Sumatradinium soucouyantiae and Palaeocystodinium spp., primarily P. golzowense). AOM dominates the palynofacies in sequence 5.7 in Hole 29A where T:M values are relatively low, averaging ~3.09 (range 1.60–4.39, n = 7), and palynomorphs are abundant (mean 149,100, range 64,500– 230,000 palynomorphs/cm3), suggesting low rates of sediment accumulation at the distal site. Samples are assigned to palynofacies type 2 or type 3 of Batten (1996) in Hole 29A, whereas sequence m5.7 samples in Hole 27A are very rich in phytoclasts and other terrigenous components and are assigned to palynofacies type 1 (Table 5). Bisaccate pollen is rare within this sequence in Hole 29A (Fig. 4; Table 6), however, with Quercus remaining the dominant pollen type, paired with particularly high percentages of Carya in some samples. This suggests that a real change in vegetation occurred during the early Burdigalian, with an expansion of broadleaf deciduous trees at the expense of evergreen conifers. T:M ratios were 15.72 and 10.50 in the 2 samples analyzed from this thin, sandy sequence in Hole 27A (27A-127R1, 15–16 cm, 359.71 mcd), recording much more proximal conditions at Site 27, consistent with the seismic and sedimentological data (Figs. 3–5).
Geosphere, December 2013
Lithologic Unit V: Sequence m5.6 Sequence m5.6 was not resolved at Site 27, but Exochosphaeridium insigne is present through sequence m5.6 (HO in sample 29A-195R-1, 50–51 cm, 692.36 mcd; Fig. 7; Table 2). The HO of Cordosphaeridium cantharellus in sample 29A-196R-2 (96.93 mcd; Fig. 7; Table 2) identifies the subzone DN2b-DN2c boundary, which straddles the NN2-NN3 boundary, ca. 18.4 Ma (Fig. 2). This is consistent with other chronological proxies that constrain the age of this sequence to between 18.4 and 18.1 Ma: a single assignment to zone NN3 and an Sr isotope age of 17.9 Ma (Browning et al., 2013). Other common dinocysts in this sequence include Operculodinium centrocarpum, Apteodinium tectatum, Dapsilidinium pseudocolligerum, Cleistosphaeridium placacanthum, Batiacasphaera sphaerica, Spiniferites spp., Polysphaeridium zoharyi, Pentadinium laticinctum, and Homotryblium spp. (Fig. 7; Supplemental Table 2 [see footnote 2]). Lejeunecysta spp. are the only common protoperidinioid cysts and G:P values are high (G:P ranges from 3.92 to 6.89 in the 3 samples analyzed for dinocysts). T:M values remain relatively low, averaging 2.89 (range 1.72–4.38, n = 3; Figs. 4 and 5; Table 4) and bisaccate pollen are relatively abundant (nonsac:bisac average 2.3; Fig. 4; Table 6), and pollen of taxa associated with wet conditions and/or swamps decrease in abundance relative to sequence m5.7. Amorphous organic matter dominates samples in this sequence, assigned to palynofacies type 3 of Batten (1996) (Table 5). Lithologic Unit V: Sequence m5.47 In Hole 27A the thin, sandy sequence m5.47 is barren of palynomorphs except for a single sample at the top of the sequence (27A-116R-2, 38–39 cm, 337.04 mcd), although AOM is relatively abundant, with most samples assigned to palynofacies type 2 (Table 5). Palynomorphs were recovered from every sample examined from this sequence in Hole 29A (mean 63,900, range 16,100–112,800 palynomorphs/cm3). Cousteaudinium aubryae, Lingulodinium multivirgatum, Operculodinium longispinigerum, Batiacasphaera sphaerica, Spiniferites sp., Polysphaeridinium zoharyi, and Cleistosphaeridium placacanthum are consistently present; this is an assemblage similar to the Cousteadinium aubryae interval zone of de Verteuil and Norris (1996) found in the Fairhaven Member of the Calvert Formation. The LO of Cerebrocysta poulsenii in sample 29A-191R-2 (22–23 cm, 681.27 mcd) and of Sumatradinium druggii in sample 29A-194R-2 (23–24 cm, 660.55 mcd) together with dinocyst taxa having an HO in the Early Miocene (e.g., Lingulodinium multivirgatum and Operculodinium longispinigerum)
21
McCarthy et al. allows us to assign these sediments to DN3 (18.1–15.97, upper Burdigalian) (Fig. 7; Table 2). This assignment is younger than the diatom zonation suggests, but is consistent with the nannofossil assignment to zone NN4 (Browning et al., 2013). T:M values remain low in Hole 29A (Figs. 4 and 5; Table 4), averaging ~2.75 (range 1.59–5.15, n = 10) and bisaccate pollen is abundant (mean nonsac:bisac ~1.27, range 1.22–1.3; Fig. 4; Table 6), with Quercus dominating the nonsaccate pollen assemblage. The interpretation of high sea level is consistent with the continued dominance of AOM, with Ph:AOM ranging from 0.04 to 0.27 in Hole 29A where most samples were assigned to palynofacies type 3 (Table 5). Lithologic Unit IV: Sequence m5.45 All of the palynological proxies record a sharp increase in terrigenous flux to the New Jersey margin within lithologic unit IV. The ratio of Ph:AOM rises sharply in the upper part of sequence m5.45 in Hole 27A in samples mostly assigned to palynofacies type 1, exceeding 100:1 in sample 27A-105R-CC (304.95 mcd), and the strongest T:M peak in all of the samples studied was found higher up in this sequence (T:M = 43.25 in sample 27A-104R-3, 36–38 cm, 301.86 mcd) (Figs. 3 and 5; Table 3). Terrigenous flux to Hole 27A is high through this sequence, with mean T:M = 8.85, n = 7 (Fig. 3). At the more distal Site 29, there is an increase in Ph:AOM (Fig. 4; Table 5), although AOM continues to dominate (palynofacies type 2), and the ratio of terrestrial versus marine palynomorphs in sequence m5.45 (mean T:M = 4.86, range 2.74–7.05, n = 4; Figs. 4 and 5; Table 4) is higher than the Miocene average for this site (T:M = 3.82). Increased (possibly fluvial) terrigenous flux is also consistent with the diverse angiosperm-dominated assemblage that characterizes both holes; large heavy grains of Carya and Ulmus (elm) are especially abundant, in addition to the ubiquitous Quercus. Peak warmth on the New Jersey margin is recorded by the presence of Arecaceae/Arecipites-type (palm) pollen in this sequence, as well as in the overlying composite sequence m5.4. Palynological evidence of a sharp increase in terrigenous flux, particularly to the more proximal Site 27, is consistent with the seismic profile that shows that the clinoform break migrated past the site of corehole 27A at that time (Fig. 5; see also Browning et al., 2013, fig. 2 therein). G:P values are relatively low in sequence m5.45 (ranging from 0.67 to 2.62 in Hole 27A and 2.77 to 3.17 in Hole 29A; Figs. 3 and 4), recording neritic conditions and/or high productivity and/or high rates of sedimentation. Common to abundant protoperidinioid taxa include
22
Brigantedinium spp., Lejeunecysta spp., Echinidinium spp. Selenopemphix nephroides, Selenopemphix brevispinosa, Palaeocystodinium spp. and Sumatradinium soucouyantiae (Figs. 6 and 7; Supplemental Tables 1 and 2 [see footnotes 1 and 2]). Cousteaudinium aubryae is also consistently present in this sequence, as are gonyaulacoid cysts Batiacasphaera sphaerica, Apteodinium tectatum, Apteodinium spiridoides, Cleistosphaeridium placacanthum, and Lingulodinium machaerophorum. This assemblage, in the absence of diagnostic Middle Miocene taxa, allows us to assign this sequence to DN3 (18.1– 15.97 Ma, upper Burdigalian), which is consistent with better constrained dinocyst zonation of the underlying sequence m5.47 and with the assignment to nannofossil zone NN4 and the Sr age of 17.7 Ma. These ages are younger than the diatom zonation suggests (Browning et al., 2013), but are consistent with oxygen isotope and other proxies recording warm, humid conditions between ca. 18 and 16.5 Ma (Middle Miocene Climatic Optimum; Zachos et al., 2001). Lithologic Unit III: Sequence m5.4 In Miller et al. (2013b), seismic profiles, core data, and log stacking patterns were used to recognize that sequence m5.4 is a composite of three higher order (100–400 k.y. scale) sequences called m5.4–1 (the sequence that directly overlies surface m5.4), m5.34, and m5.33. At Hole M27A, sequences m5.34 and m5.33 are recognized in a topset setting, but sequence m5.4–1 is cut out. At Site M29, seismic resolution did not permit the higher order sequences to be defined in this bottomset setting and the section there is referred to as m5.4 (Miller et al., 2013b). The continued presence of Arecaceae/ Arecipites-type (palm) pollen in a diverse angiosperm pollen flora with relatively high percentages of Ulmus records continued warm, humid conditions in the New Jersey hinterland (Table 5). G:P remains relatively low in sequence m5.4 in Hole 27A (mean G:P = 1.76, range 0.73–2.76, n = 5; Fig. 3; Table 3), where a diverse protoperidinioid cyst assemblage includes Selenopemphix brevispinosa, Selenopemphix nephroides, Palaeocystodinium spp., Sumatradinium soucouyantiae, Echinidinium spp., and Lejeunecysta spp. in addition to the ubiquitous Brigantedinium spp. (Supplemental Table 1 [see footnote 1]). Higher G:P values characterize the more distal Hole 29A (mean G:P = 2.91, range 1.23–4.51, n = 4; Fig. 4; Table 4). T:M values are variable, but higher than the Miocene average at both sites, ranging from ~2.09 to 15.0 (mean ~5.99, n = 6) in Hole 27A and from ~1.63 to 12.76 (mean ~4.67, n = 6) in Hole 29A (Figs. 3 and 4; Tables 3 and 4).
Geosphere, December 2013
The strongest T:M peak in Hole 29A (T:M = 12.76) is at the base of this sequence, in sample 29A-182R-2 (99–100 cm, 660.81 mcd), and a very high T:M peak (15.00) was found in sample 27A-101R-CC (292.8 mcd). The palynofacies in Hole 27A is dominated by phytoclasts (palynofacies type 1 of Batten, 1996), especially at the base of this sequence where T:M is very high, but AOM remains common in this sequence in Hole 29A, with Ph:AOM values similar to those in the underlying sequence m5.45 (Figs. 3 and 4; Table 5). Sequence m5.4 contains common Batiacasphaera sphaerica, Apteodinium tectatum, Cleistosphaeridium placacanthum and Lingulodinium machaerophorum together with Apteodinium spiridoides and Cousteaudinium aubryae. The LO of Labyrinthodinium truncatum modicum and Labyrinthodinium truncatum truncatum (and thus the base of DN4, 15.97 Ma; Figs. 6 and 7; Tables 1 and 2) occur at the top of this sequence in Hole 29A in sample 29A-176R-1 (76–77 cm, 643.82 mcd), although these useful Middle Miocene markers are not found until the base of sequence m5.3 in Hole 27A (in sample 27A-88R-2, 110–111 cm, 252.86 mcd). Most of sequence m5.4 in Hole 29A, and all of this sequence in Hole 27A, is thus assigned to DN3, which is consistent with all other chronostratigraphic proxies (Browning et al., 2013). Lithologic Unit III: Sequence m5.33 Sequence m5.33, which forms the upper part of lithologic unit III Hole 27A but is not present in Hole 29A, contains a dinocyst assemblage similar to that in sequence m5.4, but gonyaulacoid cysts dominate, with G:P values averaging 4.81 (Fig. 3; Table 3). The dinocyst assemblage is rich in Batiacasphaera sphaerica, Cleistosphaeridium placacanthum, Lingulodinium machaerophorum, Apteodinium tectatum, and Apteodinium spiridoides (Fig. 6; Supplemental Table 1 [see footnote 1]). The HO of Lingulodinium multivirgatum occurs in this sequence, in sample 313–27A-94R-2 (100–101 cm, 270.56 mcd; Fig. 6; Table 1), allowing this sequence to be assigned to DN3. A relatively diverse oak-dominated angiosperm pollen assemblage continues to characterize this sequence (Table 5), but the presence of Fagus/Nyssa (beech/tupelo, or black gum) and the absence of Arecaceae/Arecipites-type (palm) pollen record climatic cooling. AOM is common in this sequence (Table 5), recording a decrease in terrigenous flux. This is consistent with the relatively low T:M values in this sequence, averaging ~3.9 (range 1.9–6.15, n = 3; Figs. 3 and 5; Table 3).The palynological assemblage thus records a distal setting around 15.97 Ma (the Burdigalian-Langhian boundary).
Palynological evidence of eustasy Lithologic Unit II: Sequence m5.3 Palynomorphs are relatively sparse in sequence m5.3 (averaging ~20,589 palynomorphs/cm3 in Hole 27A and ~16,593 palynomorphs/cm3 in Hole 29A). The palynofacies is generally rich in AOM (Figs. 3–5; Table 5), and the remains of marine protozoans (e.g., radiolarians and foraminifer linings) are common (palynofacies type 2 of Batten, 1996). T:M values are very low in Hole 27A, averaging only 2.66 (range 1.06–6.31, n = 5) above the sequence boundary in sample 27A-88R-2 (110–111 cm, 252.86 mcd), where T:M was 6.31 (Figs. 3 and 5; Table 3). T:M values are also low in Hole 29A, averaging ~3.05 (range 1.57–8.00, n = 8). G:P is very high in Hole 29A, averaging 5.45 (n = 7), reaching a peak of 15.33 in sample 29A-170R-2 (150–152 cm, 630.82 mcd; Figs. 4 and 5; Table 4). G:P is also very high in the lower part of the sequence in Hole 27A, reaching 12.00 in sample 313–27A-88R-2 (100–101 cm, 252.86 mcd), but protoperidinioids outnumber gonyaulacoid cysts in the upper part of this sequence (in samples 27A-84R-2, 41–42 cm, 239.47 mcd and 27A-83R-3, 11–102 cm, 237.52 mcd; Fig. 3; Table 3). The relatively low diversity pollen assemblages are generally dominated by Quercus (Table 5). The palynological proxies all record more distal conditions during the early Langhian than existed in the late Burdigalian (recorded in sequences m5.45–m5.4). The LO of Labyrinthodinium truncatum modicum in sample 27A-88R-2 (110–111 cm, 252.86 mcd), together with the LO of Labyrinthodinium truncatum truncatum and Impagidinium arachnion in sample 27A-88R-1 (50–51 cm, 250.26 mcd; Fig. 6; Table 1), allows us to assign this sequence to DN4 (15.97–14.8 Ma), an age consistent with all other chronostratigraphic proxies (Browning et al., 2013). As de Verteuil and Norris (1996) reported, the assemblage in their Distatodinium paradoxum interval zone differs primarily from the underlying Cousteaudinium aubryae interval zone in containing Labyrinthodinium truncatum. Gonyaulacoid dinocysts such as Batiacasphaera sphaerica, Cleistosphaeridium placacanthum, Dapsilidinium pseudocolligerum, and Apteodinium tectatum generally dominate the assemblage together with Labyrinthodinium truncatum modicum. Lejeunecysta spp. and Brigantedinium spp. are common to abundant in several samples, and other protoperidinioid cysts such as Echinidinium spp., Palaeocystodinium spp., Selenopemphix brevispinosa, Selenopemphix nephroides, Sumatradinium druggii, and Sumatradinium soucouyantiae are also usually present to common (Figs. 6 and 7; Supplemental Tables
1 and 2 [see footnotes 1 and 2]). This assemblage allows sequence m5.3 to be assigned to DN4, an age consistent with all other chronostratigraphic proxies.
appears to record a dramatic increase in fluvial flux or substantial downslope mass wasting and resedimentation, consistent with the geometry of the margin at the time (Fig. 5).
Lithologic Unit II: Sequence m5.2 Palynomorph concentrations remain low in sequence m5.2 in Hole 27A, averaging 30,950 palynomorphs/cm3. Mean concentrations in Hole 29A are ~125,600 palynomorphs/ cm3, exhibiting a wide range (22,900–381,900 palynomorphs/cm3) with the concentration peaks generally characterized by relatively high T:M (>4; Figs. 3 and 4). T:M values average ~3.10 (range 1.28–5.92, n = 29) in the thick sequence in Hole 29A and T:M is 1.48 and 1.59 in the two samples analyzed from this very thin sequence in Hole 27A. A relatively diverse angiosperm pollen assemblage characterizes sequence 5.2 (with relatively high percentages of Tilia, Ulmus, and Fagus pollen compared to Quercus in Hole 29A), although bisaccate grains tend to increase in relative abundance upcore through this sequence, culminating in ~30% of total pollen at the sequence m5 boundary (Figs. 3 and 4; Table 6). Inaperturate conifer TCT pollen shows particularly high abundances in the lower part of this sequence, perhaps recording the expansion of cypress swamps on the Atlantic coastal plain associated with the Middle Miocene Climate Optimum (see Browning et al., 2013; Fig. 7). Labyrinthodinium truncatum modicum and Labyrinthodinium truncatum truncatum are both consistently present together with Batiacasphaera sphaerica, Apteodinium tectatum, Dapsilidinium pseudocolligerum, Cleistosphaeridium placacanthum, Lingulodinium machaerophorum, and Cordosphaeropsis minimum (Figs. 6, 7, and 9; Supplemental Tables 1 and 2 [see footnotes 1 and 2]). Protoperidinioid cysts like Selenopemphix brevispinosa, Selenopemphix nephroides, Sumatradinium soucouyantiae, Echinidinium spp., and Palaeocystodinium spp. are present in variable quantities in these sediments in addition to the ubiquitous Lejeunecysta and Brigantedinium spp. The HO of Apteodinium spiridoides at the base of this sequence in sample 27A-88R-2 (110–111 cm, 252.16 mcd; Fig. 6; Table 1) may represent reworking, but the LO of Unipontedinium aquaeductum in samples 27A-83R-3 (11–12 cm, 237.62 mcd) and 29A-128R-3 (73–74 cm, 508.79 mcd) at the top of this sequence at both sites (Tables 1 and 2; Figs. 6 and 7) marks the DN4-DN5 boundary. Exceptionally high abundances of the acritarch Cyclopsiella granosa (typically found in shallow-marine and/or nearshore high-energy environments according to Louwye and Laga, 2008) at the top of this sequence in Hole 29A
Lithologic Unit II: Sequence m5 The palynological proxies continue to record distal conditions in sequence m5. In both holes, sequence m5 is characterized by assemblages rich in AOM (palynofacies type 2 of Batten, 1996; Figs. 3–5; Table 6). Bisaccate conifer pollen is relatively abundant, and the lower part of sequence m5 is characterized by particularly low percentages of hickory pollen (Carya), reflecting the cooling that marks the early Serravallian (event Mi3; see Browning et al., 2013, fig. 7 therein). T:M values are very low in Hole 29A (mean T:M = 2.89, range 2.28–3.50, n = 4) but substantially higher in the two samples analyzed from this very thin sequence in Hole 27A (mean T:M = 4.58, range 3.69–5.46, n = 2; Figs. 3–5; Tables 3 and 4). The much lower palynomorph abundances in Hole 29A than in Hole 27A suggest that most terrigenous flux is not reaching the bottomsets (mean palynomorph concentration is only ~48,600/cm3, range 25,600–80,300 palynomorphs/cm3 in Hole 29A whereas it is ~133,600 palynomorphs/ cm3 in Hole 27A, increasing sharply upcore from ~44,000 to 244,000 palynomorphs/cm3) (Figs. 3 and 4). G:P values are relatively low at both sites, with common protoperidinioid cysts including Lejeunecysta spp. Brigantedinium spp. Sumatra dinium soucouyantiae, Sumatradinium druggii, Selenopemphix brevispinosa, Palaeocystodinium spp., and Trinovantedinium spp., mainly Trinovantedinium papulum (Figs. 6 and 7; Supplemental Tables 1 and 2 [see footnotes 1 and 2]). The LO of Habibacysta tectata and the last common occurrence of Apteodinium tectatum occur within this sequence in both holes (Tables 1 and 2; Figs. 6 and 7), marking the boundary between zones DN5a and DN5b, ca. 14.2 Ma. This is consistent with age estimates based on other available proxies (Browning et al., 2013). The most distinctive feature of this sequence is an acme of Pentadinium laticinctum in both holes (sample 313–29A-119R-CC, where these cysts make up nearly 20% of the assemblage, and sample 27A-77R-2 [40–41 cm, 221.11 mcd], where they make up nearly 10% of the assemblage; Supplemental Tables 1 and 2 [see footnotes 1 and 2]). Other consistently present gonyaulacoid cysts include Batiacasphaera sphaerica, Lingulodinium machaerophorum, Cleistosphaeridium placacanthum, Dapsilidinium pseudocolligerum, Hystrichosphaeropsis obscura, and Polysphaeridium zoharyi.
Geosphere, December 2013
23
McCarthy et al.
7
1
2
3
4
5
6
8
9
Figure 9. Common marine palynomorphs in sequence m5.2 (upper Langhian–lower Serravallian, dinoflagellate zones DN4–DN5a) including species, sample number, and England Finder coordinates. Depth for each = 15–16 cm. (1) Apteodinium tectatum Piasecki 1980: 313–29A-126R1, U53/3- V53/1. (2) Tectatodinium pellitum Wall, 1967: 313–29A-126R1, X52–1. (3) Cyclopsiella granosa /elliptica: 313–29A-126R1, C37/2. (4) Dapsilidinium pseudocolligerum (Stover) Bujak et al. 1980: 313–29A-126R1, R61–0. (5) Lingulodinium machaerophorum (Deflandre and Cookson) Wall, 1967: 313–29A-126R1, v48/4-V49/3. (6) Lingulodinium multivirgatum de Verteuil and Norris, 1996: 313–29A-126R1, N62–1. (7) Labyrinthodinium truncatum ssp. modicum de Verteuil and Norris 1996: 313–29A-126R1, R61–0. (8) Palaeocystodinium golzowense Alberti, 1961: 313–29A-126R1, X60–0. (9) Trinovantedinium sp.1: 313–29A-126R1, G64–3.
24
Geosphere, December 2013
Palynological evidence of eustasy Lithologic Unit II: Sequence m4.5 Palynomorphs increase sharply in abundance within sequence m4.5 in Hole 29A, where they average 107,400 palynomorphs/cm3 (range 39,500–217,000 palynomorphs/cm3), but palynomorph concentrations in the thin sequence in Hole 27A average only ~67,400 palynomorphs/ cm3, declining sharply in abundance upcore. It is surprising that T:M values in sequence m4.5 in Hole 27A are lower than in Hole 29A (Hole 27A: mean ~1.96, range 1.27–3.50, n = 6; Hole 29A: mean ~5.18, range 0.56–11.17, n = 14); this suggests that most terrigenous flux is bypassing the more neritic site, an interpretation consistent with the geometry of this sequence (Fig. 5). This is also consistent with the dominance of phytoclasts through much of this sequence in Hole 29A, and the first sample with Ph:AOM > 40 at 421.26 mcd (sample 29A-89R-2, 70–71 cm; Table 5), although most samples from Hole 27A were assigned to palynofacies type 2 of Batten (1996) (Table 5). Cool early Serravallian conditions are recorded by high relative abundances of bisaccate pollen in both holes, with nonsac:bisac values ranging from 2.64 to 5.06 in Hole 27A and from 1.01 to 4.87 in the lower part of sequence m4.5 in Hole 29A (Table 6). G:P values are relatively low in sequence m4.5 in Hole 27A (range 1.15–2.54) and in the upper part of this sequence in Hole 29A above a silty sand, where G:P values reach a peak of 13.00 in sample 29A-109R-2 (20–21 cm, 452.61 mcd; above this silty sand, G:P ranges from 0.44 to 2.67; Figs. 3 and 4; Tables 3 and 4). Low G:P suggests lower than normal marine salinity and high nutrient flux (i.e., fluvial influence) during the latest Langhian, consistent with the sharp increase in phytoclasts versus AOM and the rapid progradation evident in Figure 5. In addition to Lejeunecysta spp. and Brigantedinium spp., Habibacysta tectata is common to abundant, and other common dinocyst taxa include Spiniferites spp., Batiacasphaera sphaerica, Lingulodinium machaerophorum, Selenopemphix brevispinosa, Selenopemphix nephroides, Dapsilidininium pseudocolligerum, Labyrinthodinium truncatum modicum, and Sumatradinium soucouyantiae (Supplemental Tables 1 and 2 [see footnotes 1 and 2]). This assemblage is assigned to DN5b, consistent with ages derived from other proxies (Browning et al., 2013). Lithologic Unit II: Sequences m4.4–m4.2 Sequences m4.4–m4.2 were not resolved in Hole 27A. In Hole 29A, T:M values are relatively low but rise slowly in sequences m4.4– m4.2: sequence m4.4 (mean ~2.35, range 1.30– 4.14, n = 7 in Hole 29A), T:M ~2.45; T:M = 3.43 in the 2 samples analyzed from sequence m4.3;
and mean T:M = 3.79 (range 2.27–6.72, n = 6) in sequence m4.2. A diverse angiosperm pollen assemblage characterizes these sequences that are rich in phytoclasts, although AOM remains common in some samples (palynofacies types 1 and 2 of Batten, 1996) (Tables 5 and 6). Palynomorph concentrations in Hole 29A tend to decrease upcore, from a mean ~93,600 palynomorphs/ cm3 (range 6700–177,200 palynomorphs/cm3) in sequence m4.4, ~99,800 palynomorphs/cm3 in the only sample analyzed from sequence m4.3, and mean ~53,900 palynomorphs/cm3 (range 15,000–99,800 palynomorphs/cm3) in sequence m4.2. Habibacysta tectata and Spiniferites spp. are usually common to abundant in sequences m4.4–m4.2 in Hole 29A, together with common Batiacasphaera sphaerica and Labyrinthodinium truncatum modicum; Lingulodinium machaerophorum. Labyrinthodinium truncatum truncatum, and Trinovantedinium papulum are also quite consistently present (Figs. 6, 7, and 10; Supplemental Tables 1 and 2 [see footnotes 1 and 2]). The highest common occurrence of several dinocyst taxa occur in these sequences in Hole 29A: Cleistosphaeridium placacanthum (sample 29A-85R-2, 99–100 cm, 383.25 mcd), Labyrinthodinium truncatum modicum and Selenopemphix brevispinosa (sample 29A-75R-1, 41–42 cm, 353.72 mcd), and Dapsilidinium pseudocolligerum (sample 29A-74R-2, 57–58 cm, 352.32 mcd; Supplemental Table 2 [see footnote 2]). Like sequence m4.5 and upper sequence m5, these sediments are assigned to DN5b. Acritarchs, particularly the genera Cyclopsiella and Michrystridium can be common to abundant in these sequences (Supplemental Tables 1 and 2 [see footnotes 1 and 2]), probably recording freshwater flux during the late Langhian. Lithologic Unit II: Sequence m4.1 Palynological assemblages were very sparse in sequence m4.1 (mean concentration = 29,800, range 9400–50,500 palynomorphs/cm3, n = 9 in Hole 29A and mean ~20,900, range 8600–45,500 palynomorphs/cm3, n = 9 in Hole 27A), with mean T:M ~5.06 (range 3.07–10.24, n = 7) in Hole 29A and mean T:M ~7.79 (range 2.63–17.5, n = 7) in the more proximal Hole 27A. The dinocyst assemblage was dominated by long-ranging, ubiquitous taxa, precluding precise age assignments in Hole 27A. Dinocyst assemblages strongly dominated by protoperidinioid cysts such as Lejeunecysta spp., Brigantedinium spp., Echinidinium spp., and Trinovantedinium papulum characterize the sediments at both sites, with Spiniferites spp., Batiacasphaera sphaerica, and Habibacysta tectata being the only consistently common gonyaulacoid cysts, although Hystrichosphaeropsis obscura is consistently present (Figs. 6
Geosphere, December 2013
and 7; Supplemental Tables 1 and 2 [see footnotes 1 and 2]). At the more distal Site 29, the LO of Selenopemphix dionaeacysta (in sample 29A-70R-1, 107–108 cm, 339.13 mcd) and Ataxiodinium zevenboomii (in sample 29A64R-1, 120–121 cm, 320.96 mcd) occur within sequence m4.1, allowing assignment to DN6 (Fig. 7; Table 2, Supplemental Table 2 [see footnote 2]). This estimate agrees with all other proxies (Browning et al., 2013). The abundance of the acritarch genus Cyclopsiella and the consistent presence of Polyshaperidium zoharyi are similar to the observations of de Verteuil and Norris (1996) for their Selenopemphix dionaeacysta interval zone. Diverse angiospermdominated pollen assemblages are characterized by an upsequence decrease in bisaccate pollen grains, paired with an increase in Carya (hickory) grains (particularly in Hole 27A; Figs. 3 and 4; Table 6). This records climatic amelioration and/or increasingly neritic conditions. All samples examined from this sequence in Hole 27A are strongly dominated by phytoclasts (palynofacies type 1; mean Ph:AOM = 81.67, range 3.3–124, n = 8). A few samples (e.g., 29A65R-2, 18–19 cm, 324.50 mcd, and 29A-64R-1, 120–121 cm, 320.96 mcd, from which many of the specimens illustrated in Fig. 10 were identified) at the more distal site were relatively rich in AOM and assigned to palynofacies type 2 of Batten (1996). Ph:AOM values range from 0.11 to 45.75 in sequence m4.1 in Hole 29A (Table 5). Overall Trends through the Miocene Terrestrial palynomorphs (pollen and embryophyte spores) outnumber marine algae (dinoflagellates and acritarchs) in all but one sample analyzed in this study (29A-116R-1, 120–121 cm, 473.46 mcd, where T:M = 0.56), reflecting strong terrigenous flux to the New Jersey margin throughout the Miocene. The average T:M through the Miocene in Hole 27A is ~5.4 and ~3.6 in the more distal Hole 29A. Strong peaks in T:M are found sporadically throughout the Miocene in Holes 27A and 29A (Figs. 3–5; Tables 3 and 4), and are frequently in silty muds associated with sequence-bounding unconformities (e.g., m6, m5.7, m5.4, m5.3.3, m5.3, m4.5, and m4.4-m4.1 in Hole 27A, and m5.7, m5.45, m5.4, m4.4, m4.3, m4.2, and m4.1 in Hole 29A) or with palynomorph-rich silty muds within sequences (e.g., ~527, 469, 434, and 194 mcd in Hole 27A and ~575, 549, 529, 457, 440, and 325 mcd in Hole 29A). Transgressive systems tracts (TSTs) (identified by Miller et a., 2013a), in contrast, are characterized by very low T:M, e.g., ~465, 333, 271, 243, and 217 mcd in Hole 27A (where T:M ranges from 1.27 to 2.24)
25
McCarthy et al.
1
2
5
3
6
8
7
9
11
4
10
12
Figure 10. Common marine palynomorphs in sequences m4.5–m4.1 (lower Serravallian, dinoflagellate zones DN5b–DN6) including species, sample number, depth (in parentheses), and England Finder coordinates. (1) Hystrichosphaeropsis obscura Habib 1972: 313–29A- 64R-1 (120–121 cm), B61/2. (2) Labyrinthodinium truncatum ssp. truncatum Piasecki 1980: 313–29A- 64R-1 (120–121 cm), V41/0. (3) Habibacysta tectata Head et al. 1989: 313–29A- 64R-1 (120–121 cm), J70/4. (4) Ataxiodinium zevenboomii: 313–29A-64R-1 (120–121 cm), X53/4. (5) Unipontidinium aquaeductum (Piasecki) Wrenn 1988: 313–29A-92R1 (100–101 cm), M57/0-H33/4-V39/3. (6, 7) Selenophemphix dionaeacysta Head et al. 1989: 313–29A- 64R-1 (120–121 cm), J45/3-K44/2. (8) Selenophemphix brevispinosa Head et al. 1989: 313–29A- 64R-1 (120–121 cm), B49/4. (9) Trinovantedinium harpagonium de Verteuil and Norris 1992: 313–29A-92R1 (100–101 cm), U69/3. (10) Sumatradinium soucouyantiae de Verteuil and Norris 1992: 313–29A-92R1 (100–101 cm), G64-3. (11) Impagidinium arachnion de Verteuil and Norris 1996: 313–29A-92R1 (100–101 cm), N51/2-M51/4. (12) Pentadinium laticinctum Gerlach 1961: 313–29A-64R-1 (120–121 cm), L67/2.
26
Geosphere, December 2013
Palynological evidence of eustasy and ~585 mcd in Hole 29A, where T:M = 2.04 (Tables 3 and 4). The oldest strong peak in terrestrial versus marine palynomorphs (T:M = 11.4) is in sample 27A-187R-CC (8–20 cm, 527.68 mcd; Fig. 3), in sequence O6 (earliest Aquitanian). The oldest peak at Site 29 (T:M = 11.82) was in sample 29A-211R-1 (31–32 cm, 737.92 mcd), in sequence m5.8 (Fig. 3), in sediments of Aquitanian–early Burdigalian age. The strongest T:M values in both holes are in sediments of late Burdigalian age (DN3, NN4, and East Coast Diatom Zone ECDZ2) near sequence boundary m5.4; T:M was 43.25 in sample 27A-104R-3 (36–38 cm, 301.86 mcd), near the top of sequence m5.45, and T:M was 12.76 in sample 29A-182R-2 (99–100 cm, 660.81 mcd), ~1.5 m above sequence boundary m5.4. The ratio of phytoclasts versus AOM (Ph:AOM), which might be expected to record much the same information as T:M, shows much less sample to sample variability upcore at both sites, but shows marked increases in palynodebris of terrestrial origin at particular times. Phytoclasts first outnumber AOM in sequence 5.8 in both holes, but phytoclasts overwhelm AOM (i.e., are assigned to palynofacies type 1 of Batten [1996], rather than type 2, which characterizes most of the earlier Miocene) much earlier at Site 27 than at Site 29. The oldest sample in which phytoclasts outnumber AOM in Hole 27A is sample 27A-169R-1 (32–33 cm, 484.93 mcd, in sequence m5.8), and the earliest strong dominance of phytoclasts (Ph:AOM > 5) is in sample 27A-164R-2 (61–62 cm, 471.47 mcd, also in sequence m5.8). There is a dramatic increase (Ph:AOM > 40) in the Ph:AOM in sample 27A-105R-CC (301.61 mcd), near the top of sequence m5.45 (Fig. 3). In Hole 29A, phytoclasts first outnumber AOM in sample 29A-210R-3 (18–19 cm, 737.74 mcd, in sequence m5.8) and Ph:AOM first exceeds 5 in sample 29A-157R-2 (20–21 cm, 589.86 mcd, near the base of sequence m5.2; Fig. 4). The first dramatic increase in Ph:AOM in Hole 29A occurs in sample 29A-98R-2 (70–71 cm, 421.26 mcd in sequence m4.5; Fig. 3). The Ph:AOM signal at the two sites is nearly identical above sequence m4.5, suggesting that the shelf had prograded past Site 29 by the latest Langhian– early Serravallian (Fig. 5). Nonsaccate (mainly angiosperm) pollen outnumber bisaccate conifer pollen in nearly every sample analyzed from both holes (Figs. 3 and 4; Table 6), with exceptions in Hole 27A in samples 190R-3 (15–16 cm, 536.54 mcd), 190R-2 (119–120 cm), 189R-1 (72–73 cm, 531.08 mcd), 188R-2 (60–61 cm, 529.21 mcd; in sequence O6), 166R-1 (15–16 cm, 475.62 mcd), 165R-1 (115–116 cm, 473.16 mcd), 164R-2 (110–111 cm, 470.46 mcd; in sequence
m5.8), and 88R-2 (110–111 cm, 252.86 mcd; at the base of sequence m5.2), and in Hole 27A in samples 211R-2 (24–25 cm, 739.35 mcd), 211R-1 (31–32 cm, 737.92 mcd), 209R-1 (111–112 cm, 732.62 mcd; in sequence m5.8), 190R-1 (130–131 cm; in sequence m5.47), and 129 R-1 (89–90 cm, 509.75 mcd; in sequence m5.2). Nonsac:bisac first exceeds 10:1 in sample 27A-170R-1 (51–52 cm, 488.17 mcd, in sequence m5.8) and in sample 29A-207R-3 (728.51 mcd, in sequence m5.7). The nonsac:bisac pollen ratio increases sharply in sequence m5.8 in Hole 27A and remains relatively high until sequences m5.4–m5.33. Following a peak in upper sequence m5.3, the nonsac:bisac ratio declines again in sequences m5.2–m4.2, then rise sharply in sequence m4.1 (Fig. 3). In Hole 29A, nonsac:bisac pollen ratio peaks around sequence boundary m5.7 and is high in sequence m5.45, sequences m5.3–m5.2, and again in sequence m4.4 (Fig. 4). Terrigenous palynomorphs tend to increase in relative and absolute concentrations (high T:M and high pollen/spore concentrations) in proximity to sequence boundaries. The palynological signatures near sequence boundaries are indicative of increased proximity to the shoreline and/or more neritic conditions as well as the greater resistance of pollen and spores (evolved for wind pollination) to oxidation than dinoflagellate cysts. The ratio of more oxidationresistant gonyaulacoid cysts versus more susceptible protoperidinioid cysts (G:P) tends to be high in the lower parts of sequences where terrestrial palynomorph abundances are low (Figs. 3 and 4; Tables 3 and 4), recording low rates of sediment accumulation in TSTs, probably due to higher accommodation and/or more distal settings in TSTs (as discussed in McCarthy et al., 2003; Gostlin, 1999). High concentrations of terrestrial palynomorphs in the upper parts of sequences record aggradation and progradation within the sequences. Protoperidinioids can also be very rare within dinocyst-rich sequences, such as in samples 27A-187R-3 (140–141 cm), 27A-187R-1 (87–88 cm; 526.08–523.57 mcd in sequence O6), where G:P values were 8.33 and 9.00, respectively, 29A-170R-2 (630.82 mcd in sequence m5.3), and 29A-109R-2 (20–21 cm, 452.61 mcd in sequence m4.5), where G:P values were 15.33 and 13.00, respectively (Figs. 3 and 4; Tables 3 and 4). RELATIVE SEA-LEVEL RECONSTRUCTIONS COMPARED WITH GLACIOEUSTASY The relationship between sea level and the palynological assemblage is more complex than that with the benthic foraminiferal assem-
Geosphere, December 2013
blage, which is largely a function of paleo– water depth due to changes in physiochemical parameters that vary with water depth (Katz et al., 2013). Most of the palynological samples examined from IODP Expedition 313 contain more allochthonous than authochthonous elements, and thus cannot reflect the local depositional environment, as do the foraminiferal assemblages. In addition to variations in sea surface productivity, T:M reflects variations in the numerous mechanisms that transport pollen and embryophyte spores to each offshore site, i.e., wind, rivers, ocean currents, and mass transport, most of which are related to distance from the shoreline. High sea surface productivity can be inferred from the abundance of round-brown dinoflagellate cysts, Brigantedinium spp. (Zonneveld et al., 2001, 2008; Versteegh and Zonneveld, 2002), and the abundance of AOM derived from algal decomposition (Batten, 1996). The relative importance of wind can be estimated by examining the relative abundance of bisaccate pollen (Mudie and McCarthy, 1994). The influence of rivers can be identified lithologically (e.g., in sequence m5.8; Miller et al., 2013a) as well as by large pulses of acritarchs. Mass transport is largely restricted to environments on clinoform bottomsets (e.g., much of the Early to Middle Miocene at Site M29; Mountain et al., 2010) and to continental slope and rise sediments (McCarthy and Mudie, 1998). Following progradation of the clinoform break past a site, downslope transport would no longer play a significant role, but until then, recycling and resedimentation of palynomorphs from the shelf would have been a major overprint to our records. This is evident in the continental margin architecture (Fig. 5): Hole 27A is continuously neritic above lithologic unit VI (sequence m5.8), so mass wasting would have been far less important at this site after the early Burdigalian. By the middle Burdigalian, the overwhelming dominance of phytoclasts in the palynofacies and very sparse AOM (Figs. 3–7) record a very strong terrigenous component in the majority of samples analyzed in lithological units III and II. Ph:AOM shows less variability through the Miocene at each site than the ratio of terrestrial versus marine palynomorphs. Peaks in T:M in AOM-rich sediments thus record pulses of terrigenous flux into deepwater settings, mainly via mass wasting (e.g., in sequence m5.8 in Hole 27A and in sequences m5.3–m5.2 in Hole 29A), whereas high T:M in phytoclast-rich sediments records sedimentation in neritic settings. Because the palynofacies primarily reflects distance from the shoreline, and foraminiferal assemblages largely reflect the paleo–water depth, the response of palynological and
27
McCarthy et al. benthic foraminiferal assemblages to sea-level change will differ, depending on the gradient of the margin and the position of the rollover. Whereas the resolution available with foraminiferal estimates of sea level cannot discriminate sea-level lowerings of a few tens of meters, an increase in terrigenous flux recorded by high T:M can record downslope mass wasting from neritic environments into relatively deep water environments in response to regression. Subsequent onlapping sequences (e.g., m5.7, m5.3, m5, m4.4–m4.2) are characterized high AOM except around seismic sequence boundaries, suggesting taphonomic effects associated with the generation of sequence boundaries (e.g., resedimentation, selective oxidation; cf. McCarthy et al., 2003). In addition, the much lower gradient of the margin once the clinoform has prograded past a site (past Site 27 during the late Burdigalian DN3 [18. 1–15.97 Ma], marked by Ph:AOM = 102 in sample 27A-105R-CC [301.61 mcd], and past Site 29A during the latest Langhian, ca. 14.2–13.2 Ma, DN5b recorded by Ph:AOM = 40.4 in sample 29A-98R-2 [70–71 cm, 421.26 mcd; Table 5]) results in much more proximal palynological assemblages (high T:M, Ph:AOM, nonsac:bisac) relative to foraminiferally derived paleobathymetric estimates (Figs. 3–5; Tables 3–6). Distal deep-water settings were thus inferred whenever multiple palynological proxies concur, i.e., low T:M (Figs. 3–5)/ high M:T (Figs. 11A, 11B), low nonsac:bisac pollen ratios (Figs. 3 and 4; Table 6), low phytoclasts versus AOM (Ph:AOM in Figs. 3–5; Table 5), as well as high G:P (Figs. 3 and 4; Tables 3 and 4), and where upper middle neritic (50–80 m; Bulimina gracilis/Bolivina paula–dominated biofacies), outer middle neritic (75–100 m; Uvigerina spp./Bolivina floridana–dominated biofacies), or outer neritic (>100 m; high-diversity, lowdominance assemblages with key indicator taxa, e.g., Cibicidoides pachyderma, Hanzawaia mantaensis, and Oridorsalis umbonatus) water depths were indicated by the foraminiferal assemblages (Mountain et al., 2010; Katz et al., 2013) (Figs. 11A, 11B). As previously observed (McCarthy et al., 2003), the primary ecological signal is confounded by strong taphonomic skewing at sequence boundaries, preferentially degrading neritic protoperidinioid dinoflagellate cysts and thin-walled pollen. Taking these caveats into consideration, there is generally good agreement between palynologically based estimates of position of the shoreline (and shelf break) and foraminiferally derived paleobathymetric estimates (Figs. 11A, 11B). This allowed us to qualitatively reconstruct relative sea level at each site
28
with some degree of confidence (Figs. 11A, 11B). The interpretation of high terrigenous flux as typically recording low sea levels is consistent with the shallow paleodepths usually reconstructed based on the benthic foraminiferal assemblages in pollen-rich sediments, which are Hanzawaia concentrica–dominated biofacies (interpreted as middle inner neritic, 10–25 m) (Katz et al., 2013). Samples rich in nonsaccate pollen that tends to preferentially settle in coastal and inner neritic environments (Mudie and McCarthy, 1994; McCarthy et al., 2003) support the interpretation of a middle inner neritic depositional environment. Increased proximity to the shoreline at times of lower sea level would also tend to decrease the ratio of marine versus terrestrial palynomorphs (M:T in Figs. 11A, 11B) due to ecological stress on marine phytoplankton in inner neritic environments. The sea-level reconstructions also appear to be consistent with other available data from IODP Expedition 313. Proximal low sea-level settings are generally suggested by very terrigenous samples at sequence boundaries (Figs. 11A, 11B), and strong taphonomic alteration in these sediments is also recorded by high G:P (Figs. 3 and 4). The reconstructions of coastal to inner neritic paleodepths at most sequence boundaries correlate with times of medium to major sea-level lowering according to the compilation of Snedden and Liu (2010). The identification of TSTs and maximum flooding surfaces (MFS) at very high relative sea level (Tables 3 and 4; Figs. 11A, 11B), in contrast, is consistent with our interpretation of distal deep-water environments (Miller et al., 2013a; Browning et al., 2013). The combination of the two relative sea-level proxies provides more information than either in isolation. For example, the sudden deepening is evident in our sea-level reconstructions during the early Langhian (in sediments assigned to DN4, NN4, and ECDZ2). Outer middle neritic (75–100 m) and outer neritic (>100 m) paleodepth estimates for sequences m5.3 through m5 at Sites 27 and 29, respectively, are paired with quite variable reconstructions of terrigenous flux derived from the palynofacies, recording the rapid aggradation and progradation of lithologic unit II into relatively deep water environments. The interpretation of deep water is consistent with the low deep-sea oxygen isotope values of the Middle Miocene Climate Optimum (Zachos et al., 2001; see fig. 7 in Browning et al., 2013). Similarly, both sets of proxies record a rapid sea-level fall during the late Langhian that correlates with event Mi3 (in sediments assigned to DN5b, NN5, and ECDZ6a-b; Figs. 11A, 11B). One advantage of
Geosphere, December 2013
the palynological approach in reconstructing relative sea level is that palynomorphs and palynodebris were available in statistically significant quantities in more samples than were benthic foraminifers, particularly at the more inner to middle neritic Site 27. This higher resolution record allowed the identification of possible parasequences within thick sequences in both holes. The accumulation of nearly 200 m of sediment beyond the paleoclinoform break in Hole 29A during the early–middle Langhian allows two high-amplitude and 11 lower amplitude sealevel cycles to be identified in sequences m5.3– m5 (Fig. 11B). The dinocyst zonation suggests that these sequences were deposited between 15.97 and 14.2 Ma (zones DN4–DN5a), which agrees well with the estimate of ca. 16.1–14.6 Ma based on the compilation of all chronostratigraphic proxies (by Browning et al., 2013). The resulting periodicity estimates (~136–160 k.y.) in our relative sea-level curves suggest possible Milankovitch forcing, although the chronological control is not sufficient to demonstrate this conclusively; in Miller et al. (2013b), 8 flooding surfaces (including the MFS) were noted in sequence m5.2 at Hole M29A, similar to the 7–8 noted here (Fig. 11B) within the ~1 m.y. of this sequence (15.6–14.6 Ma; Browning et al., 2013). We also note that there are 6–7 flooding events in the Hole M29A m4.5–m4.1 section, which represents ca. 13.6 to ca. 13.0 Ma (Fig. 11B; Browning et al., 2013). The chronology is not sufficient to establish that these are actually quasi-100-k.y.-scale events, but the general match is intriguing. Given the available resolution, with chronological control provided by multiple biostratigraphic proxies and by Sr isotope ages (Browning et al., 2013), we were able to correlate all of the Mi events shown in figure 7 of Browning et al. (2013) with intervals of lowered sea level reconstructed from the integrated palynological and foraminiferal proxies. These observations, together with the palynological evidence of accelerated offshore sediment transport at times of lowered sea level, and associated progradation and downslope mass wasting, suggest that eustasy is an important factor influencing the architecture of the New Jersey margin. CONCLUSIONS A comparison of paleo–water depth estimates inferred from benthic foraminifera (Katz et al., 2013) and distance from shoreline estimates derived from the palynological data allowed relative sea level to be qualitatively reconstructed in Holes 27A and 29A on the New Jersey margin. Although qualitative, this simple estimate
50
100
0
20
40
60
Hole M0027 Interpreted relative sea level ( m)
m)
80
100
120
Nannofossil/ East Coast Diatom Zones
0
Paleodepth (
Core
Cumulative Percent
Recovery
A
Dinocyst zones
Palynological evidence of eustasy
150 55
Sequence Boundaries 200
200
m4.1 m4.5 m5 m5.2 m5.3
TST TST TST
250
Depth (mcd)
TST
300
300
60 65 70 75 80 85
DN5b DN5a DN4
90
m5.33
95
m5.4
100 105
NN4/ ECDZ2
DN3
110
TST
350
NN5-NN6/7 ECDZ6a-b NN5/ECDZ6a NN5/ECDZ3-4 NN4/ECDZ3
m5.45
115 120
m5.47 m5.7
125
NN4/ ECDZ1
130 135 140
400
400
145 150
165
500
m5.8
500
m6 06
600
1
2
Ratio of M:T (
)
Shallow
Deep
DN2a
170 175 180 185
0 Clay/Silt Glauconite Fine/very fine quartz sand Medium & coarser quartz sand Foraminifers/shells Mica
NN2/ ECDZ1
160
MFS TST
550
DN2b
155
450
190
NN2
DN1
NN1
195 200
Figure 11 (on this and following page). Relative sea level was qualitatively reconstructed by combining paleodepth estimates derived from benthic foraminiferal assemblages (blue, left) and distance from shoreline estimates derived from the ratio of marine versus terrestrial (M:T) palynomorphs (green, left). Depth: mcd—meters composite depth. (A) Integrated Ocean Drilling Program Hole 27A. Sequence boundaries (m6–m4.1) are associated with very low relative sea level, whereas maximum flooding surfaces (MFS) and transgressive surfaces (TS) are associated with foraminiferal and palynological proxies recording high relative sea level. Our sea-level interpretation also appears to identify parasequences, such as in the thick sequence m5.8 in Hole 27A and m5.2 in Hole 29A. Age control is provided by dinocyst zones, together with calcareous nannofossil and diatom zone assignments and Sr isotope age estimates from Browning et al. (2013), allowing intervals of very low sea level to be correlated with Miocene oxygen isotope (Mi) events (see Browning et al., 2013, fig. 7). These generally correlate with the sequence boundaries identified across the New Jersey shallow shelf, supporting the contention that relative sea-level change and the architecture of the New Jersey margin are primarily responses to eustasy.
of relative sea-level change provides a useful framework with which other variations at the IODP Expedition 313 drill sites can be compared. Further, the simple estimate represents a good starting point for subsequent work on eustatic reconstructions, which require backstripping to account for compaction, loading and/or flexure, and thermal subsidence. Our data-based reconstruction can be compared with ongoing modeling studies.
High terrigenous flux associated with fluvial discharge and/or progradation of the New Jersey shelf is recorded by peak concentrations of pollen rich in angiosperm taxa and phytoclasts in sediments deposited in very shallow water or redeposited downslope from coastal and/or upper neritic to middle inner neritic environments, based on paleodepth estimates from benthic foraminiferal assemblages. The low sea levels are interpreted where sediments are
Geosphere, December 2013
rich in angiosperm pollen and phytoclasts and foraminifer samples are either barren, almost completely dominated by Lenticulina spp., or assigned to the Hanzawaia concentrica–dominated biofacies. The dinocyst zonation of de Verteuil and Norris (1996) allowed ages to be assigned to all Miocene sequences recovered from Holes 27A and 29A. Additional chronostratigraphic control was provided by calcareous nannofossils and
29
50 100 0
20
40
60
Hole M0029A Interpreted relative sea level ( m)
m) 80
100
120
Dinocyst zones
0
Paleodepth (
Core
Cumulative Percent
Recovery
B
Nannofossil/ East Coast Diatom Zones
McCarthy et al.
50 55
300
300
Sequence Boundaries m4.1
350
m4.2 m4.3
70 75 80
m4.4
450
Depth (mcd)
NN6
85
NN5/ECDZ6
95 100 105 110
m4.5 500
DN6
65
90
400
400
60
500
m5
DN5b
NN5/ECDZ6
115 120
NN5/ECDZ6a
125 130 135
DN5a
140
550
NN4-NN5 ECDZ3-4
145 150 155
600
600
m5.2
DN4
160 165
650
700
700
170 175
m5.4 m5.45
180 185 190
DN3
NN4 ECDZ2 NN4 ECDZ1
m5.47
195
DN2c
m5.6
200
NN4 NN3/ ECDZ1
205
DN2b
(mid NN2)
210 215
DN2a
m5.7 m5.8
750 0 Clay/Silt Glauconite Ratio Fine/very fine quartz sand Medium & coarser quartz sand Foraminifers/shells Mica
1
of M:T (
2
Shallow
NN4 ECDZ2
m5.3
NN2
Deep
)
Figure 11 (continued). (B) Hole 29A.
diatoms, as well as by Sr isotope pages (Browning et al., 2013) allowing sequence boundaries generated at times of lowered sea level to be correlated with Miocene oxygen isotope events. In contrast, distal environments are recorded by low T:M (high M:T) and a dominance of AOM in onlapping sequences m5.7–m5.6 (early Burdigalian), m5.3–m5 (Langhian), and m4.4 (latest Langhian–earliest Serravallian). High sea level at these times is recorded by benthic foraminiferal assemblages indicative of lower middle to outer neritic environments. This study illustrates the value of palynology in sequence stratigraphic studies, and of combining palynological and benthic foraminiferal proxies to produce robust reconstructions of relative sea level and relate these to sedimentation on continental margins.
30
ACKNOWLEDGMENTS
We acknowledge the input of the entire Integrated Ocean Drilling Program (IODP) Expedition 313 Scientific Party and the IODP staff in Bremen, and current and former students and colleagues in the Palynology Lab at Brock University: E. Fischer, S. Tiffin, J. Hopkins, K. Gostlin, M. Mahdavi, M. Head, and K. Sihra. Mike Lozon provided invaluable assistance with drafting. This research used samples and/or data provided by the IODP and the International Continental Scientific Drilling Program (ICDP). Funding for this research was provided by a Natural Sciences and Engineering Research Council of Canada (NSERC) Discovery Grant to McCarthy, NSERC Undergraduate Student Research Awards to Zanatta and Drljepan, U.S. Science Support Program and National Science Foundation awards (Browning, Katz, Miller, and Mountain), and by the German Science Foundation (DFG project KO 3944/3-1 to Kotthoff). We thank two anonymous reviewers and editor Carol Frost for their helpful comments on an
Geosphere, December 2013
earlier draft of our paper, and especially guest editor Jean-Noel Proust, who meticulously edited the revised draft of this paper. REFERENCES CITED Austin, J.A., Jr., and 28 others, 1998, Proceedings of the Ocean Drilling Program, Initial reports, Volume 174A: College Station, Texas, Ocean Drilling Program, doi: 10.2973/odp.proc.ir.174a.1998. Batten, D.J., 1996, Palynofacies, in Jansonius, J., and McGregor, D.C., eds., Palynology: Principles and applications: American Association of Stratigraphic Palynologists Foundation, v. 3, p. 1011–1084. Browning, J.V., Miller, K.G., Barron, J., Sugarman, P.J., McCarthy, F.M.G., Kulhanek, D., Katz, M.E., and Feigenson, M.D., 2013, Chronology of Oligocene– Miocene sequences, onshore and nearshore New Jersey: Implications for regional, interregional, and global correlations: Geosphere, v. 9, doi:10.1130/GES00857.1. de Verteuil, L., and Norris, G., 1996, Miocene dinoflagellate stratigraphy and systematics of Maryland and Virginia: Micropaleontology: Supplement, v. 42: New York, Micropaleontology Press, 172 p.
Palynological evidence of eustasy Dybkjær, K., and Piasecki, S., 2008, A new Neogene biostratigraphy of Denmark: Geological Survey of Denmark, Greenland Bulletin 15, p. 29–32. Dybkjær, K., and Piasecki, S., 2010, Neogene dinocyst zonation for the eastern North Sea basin, Denmark: Review of Palaeobotany and Palynology, v. 161, p. 1–29, doi: 10.1016/j.revpalbo.2010.02.005. Eshet, Y., Druckman, Y., Cousminer, H.L., Habib, D., and Drugg, W.S., 1988, Reworked palynomorphs and their use in the determination of sedimentary cycles: Geology, v. 16, p. 662–665, doi:10.1130/0091-7613 (1988)0162.3.CO;2. Gostlin, K.E., 1999, Continental margin architecture: the palynological signature of glacioeustasy [M.S. thesis]: St. Catharines, Canada, Brock University, 160 p. Gradstein, F., Ogg, J., and Smith, A., 2004, A geologic time scale 2004: Cambridge, U.K., Cambridge University Press, 589 p. Gregory, W.A., and Hart, G.F., 1992, Towards a predictive model for the palynologic response to sea level changes: Palaios, v. 7, p. 3–33, doi:10.2307/3514794. Habib, D., and Miller, J.A., 1989, Dinoflagellate species and organic facies evidence of marine transgression and regression in the Atlantic Coastal Plain: Palaeogeography, Palaeoclimatology, Palaeoecology, v. 74, p. 23–47, doi:10.1016/0031-0182(89)90018-7. Hopkins, J.A., and McCarthy, F.M.G., 2002, Post-depositional palynomorph degradation in Quaternary shelf sediments: A laboratory experiment studying the effects of progressive oxidation: Palynology, v. 26, p. 167–184, doi:10.1080/01916122.2002.9989571. Katz, M.E., Miller, K.G., and Mountain, G.S., 2003, Biofacies and lithofacies evidence for paleoenvironmental interpretations of upper Neogene sequences in the New Jersey continental shelf (ODP Leg 174A), in Olson, H.C., and Leckie, R.M., eds., Micropaleontologic proxies for sealevel change and stratigraphic discontinuities: SEPM (Society for Sedimentary Geology) Special Publication 75, p. 131–146, doi:10.2110/pec.03.75.0131. Katz, M.E., Browning, J.V., Miller, K.G., Monteverde, D., Mountain, G.S., and Williams, R.H., 2013, Paleobathymetry and sequence stratigraphic interpretations from benthic foraminifera: Insights on New Jersey shelf architecture, IODP Expedition 313: Geosphere, doi:10.1130/GES00872.1. Louwye, S., and Laga, P., 2008, Dinoflagellate cyst stratigraphy and paleoenvironment of the marginal marine Middle and Upper Miocene of the eastern Campine area, northern Belgium (southern North Sea basin): Geological Journal, v. 43, p. 75–94, doi:10.1002/gj.1103. Martini, E., 1971, Standard Tertiary and Quaternary calcareous nannoplankton zonation, in Farinacci, A., ed., Proceedings of the Second International Conference on Planktonic Microfossils 1970, Volume 2: Rome, Edizioni Tecnoscienza, p. 739–785. McCarthy, F.M.G., and Gostlin, K.E., 2000, Correlating Pleistocene sequences across the New Jersey margin: Sedimentary Geology, v. 134, p. 181–196, doi: 10.1016/S0037-0738(00)00019-1. McCarthy, F.M.G., and Mudie, P.J., 1998, Oceanic pollen transport and pollen:dinocyst ratios as markers of late Ceno-
zoic sea level change and sediment transport: Palaeogeography, Palaeoclimatology, Palaeoecology, v. 138, p. 187–206, doi:10.1016/S0031-0182(97)00135-1. McCarthy, F.M.G., Gostlin, K.E., Mudie, P.J., and Hopkins, J.A., 2003, Terrestrial and marine palynomorphs as sealevel proxies: An example from Quaternary sediments on the New Jersey Margin, U.S.A., in Olson, H.C., and Leckie, R.M., eds., Micropaleontologic proxies for sealevel change and stratigraphic discontinuities: SEPM (Society for Sedimentary Geology) Special Publication 75, p. 119–129, doi:10.2110/pec.03.75.0119. McCarthy, F.M.G., Gostlin, K.E., Mudie, P.J., and Ohlenschlager, R., 2004a, The palynological record of terrigenous flux to the deep sea: Late Pliocene–recent examples from 41°N in the abyssal Atlantic and Pacific Oceans: Review of Palaeobotany and Palynology, v. 128, p. 81–95, doi:10.1016/S0034-6667(03)00113-1. McCarthy, F.M.G., Findlay, D.J., and Little, M.L., 2004b, The micropaleontological character of anomalous calcareous sediments of late Pliocene through early Pleistocene age below the CCD in the northwest North Pacific: Palaeogeography, Palaeoclimatology, Palaeoecology, v. 215, p. 1–15, doi:10.1016/j.palaeo.2004.07.032. Miller, K.G., 2002, The role of ODP in understanding the causes and effects of global sea-level change: JOIDES Journal, v. 28, p. 23–28. Miller, K.G., Rofolo, S., Sugarman, P.J., Pekar, S.F., Browning, J.V., and Gwynn, D.W., 1997, Early to middle Miocene sequences, systems tracts, and benthic foraminiferal biofacies, New Jersey coastal plain, in Miller, K.G., and Snyder, S.W., Proceedings of the Ocean Drilling Program, Scientific Results, Volume 150X: College Station, Texas, Ocean Drilling Program, p. 169–186. Miller, K.G., Kominz, M.A., Browning, J.V., Wright, J.D., Mountain, G.S., Katz, M.E., Sugarman, P.J., Cramer, B.S., Christie-Blick, N., and Pekar, S.F., 2005, The Phanerozoic record of global sea-level change: Science, v. 310, p. 1293–1298, doi:10.1126/science.1116412. Miller, K.G., Browning, J.V., Mountain, G.S., Bassetti, M.A., Monteverde, D., Katz, M.E., Inwood, J., Lofi, J., and Proust, J.-N., 2013a, Sequence boundaries are impedance contrasts: Core-seismic-log integration of Oligocene–Miocene sequences, New Jersey shallow shelf: Geosphere, v. 9, doi:10.1130/GES00858.1. Miller, K.G., and 13 others, 2013b, Testing sequence stratigraphic models by drilling Miocene foresets on the New Jersey shallow shelf: Geosphere, v. 9, doi: 10.1130/GES00884.1. Monteverde, D.H., 2008, Sequence stratigraphic analysis of early and middle Miocene shelf progradation along the New Jersey margin [Ph.D. thesis]: New Brunswick, New Jersey, Rutgers University, 247 p. Monteverde, D.H., Mountain, G.S., and Miller, K.G., 2008, Early Miocene sequence development across the New Jersey margin: Basin Research, v. 20, p. 249–267, doi: 10.1111/j.1365-2117.2008.00351.x. Mountain, G., and Monteverde, D., 2012, If you’ve got the time, we’ve got the depth: The importance of accurate core-seismic correlation: American Geophysical Union Fall Meeting, abs. PP51B–2111.
Geosphere, December 2013
Mountain, G.S., Proust, J.-N., McInroy, D., Cotterill, C., and the Expedition 313 Scientists, 2010, Proceedings of the Integrated Ocean Drilling Program, Volume 313: Tokyo, Integrated Ocean Drilling Program Management International, Inc., doi:10.2204/iodp.proc.313 .2010. Mudie, P.J., and McCarthy, F.M.G., 1994, Pollen transport processes in the western North Atlantic: Evidence from cross-margin and north-south transects: Marine Geology, v. 118, p. 79–105, doi:10.1016/0025-3227 (94)90114-7. Oboh-Ikuenobe, F.E., Obi, C.G., and Jaramillo, C.A., 2005, Lithofacies, palynofacies, and sequence stratigraphy of Paleogene strata in southeastern Nigeria: Journal of African Earth Sciences, v. 41, p. 79–101, doi: 10.1016/j.jafrearsci.2005.02.002. Rochon, A., de Vernal, A., Turon, J.-L., Matthiessen, J., and Head, M.J., 1999, Distribution of recent dinoflagellate cysts in surface sediments from the North Atlantic Ocean and adjacent seas in relation to sea-surface parameters: American Association of Stratigraphic Palynologists Contribution 35, 152 p. Snedden, J.W., and Liu, C., 2010, A compilation of Phanerozoic sea-level change, coastal onlaps and recommended sequence designations: American Association of Petroleum Geologists Search and Discovery Article 40594, www.searchanddiscovery.com. Stockmarr, J., 1971, Tablets with spores used in absolute pollen assessment: Pollen et Spores, v. 13, p. 615–621. Traverse, A., ed., 1994, Sedimentation of organic particles: New York, Cambridge University Press, 544 p. Tyson, R., 1995, Sedimentary organic matter: Organic facies and palynofacies: London, Chapman & Hall, 615 p. Versteegh, G.J.M., and Zonneveld, K.A.F., 2002, Use of selective degradation to separate preservation from productivity: Geology, v. 30, p. 615–618, doi:10.1130/0091 -7613(2002)0302.0.CO;2. Wood, S.W., and Gorin, G.E., 1998, Sedimentary organic matter in distal clinoforms of Miocene slope sediments: Site 903 of ODP Leg 150, offshore New Jersey: Journal of Sedimentary Research, v. 68, p. 856–868, doi:10.2110/jsr.68.856. Zachos, J.C., Pagani, M., Sloan, L.C., Thomas, E., and Billups, K., 2001, Trends, rhythms, and aberrations in global climate 65 Ma to present: Science, v. 292, p. 686–693, doi:10.1126/science.1059412. Zonneveld, K.A.F., Versteegh, G.J.M., and de Lange, G.J., 1997, Preservation of organic walled dinoflagellate cysts in different oxygen regimes: A 10,000 years natural experiment: Marine Micropaleontology, v. 29, p. 393–405, doi:10.1016/S0377-8398(96)00032-1. Zonneveld, K.A.F., Versteegh, G.J.M., and de Lange, G.J., 2001, Palaeoproductivity and postdepositional aerobic organic matter decay reflected by dinoflagellate cyst assemblages of the Eastern Mediterranean S1 sapropel: Marine Geology, v. 172, p. 181–195, doi: 10.1016/S0025-3227(00)00134-1. Zonneveld, K.A.F., Versteegh, G.J.M. and Kodrans-Nsiah, M., 2008, Preservation and organic chemistry of late Cenozoic organic-walled dinoflagellate cysts: A review: Marine Micropaleontology, v. 86, p. 179–197.
31