int. j. remote sensing, 2000, vol. 21, no. 6 & 7, 1289–1302
Global spatial and temporal distribution of vegetation re as determined from satellite observations ´ GOIRE E. DWYER*, S. PINNOCK and J.-M. GRE Global Vegetation Monitoring Unit, Space Applications Institute, Joint Research Centre, European Commission, 21020 Ispra, Italy.
and J. M. C. PEREIRA Departamento de Engenharia Florestal, Instituto Superior de Agronomia, Universidade Te´cnica de Lisboa, Tapada da Ajuda, 1399 Lisboa Codex, Portugal. Abstract. Vegetation res occur worldwide, all year round and inject enormous amounts of trace gases and particles into the atmosphere. Nonetheless, there is still great uncertainty as to the global spatial and temporal distribution of vegetation res. Twenty one months of global, daily, daytime satellite data at 1 km resolution, from April 1992 to December 1993, were processed in order to determine the positions of active vegetation res. Results from the rst twelve months of the study period are presented here. This is the rst time that such a global study has been carried out using a long time series data set and a single processing technique. The data set and results discussed provide much improved information on the spatial variability and the seasonality of vegetation res. They will be of use in the global mapping and modelling of emissions due to biomass burning as well as in the study of the role of re in land cover maintenance and change. We show that half of the res detected were on the African continent and over 70% within the tropical belt. Fires were detected in more than 6% of 1 km2 pixels, over land, during the 12-month period and savanna grasslands accounted for over one third of this area.
1.
Introduction Vegetation re, whether caused naturally or by humans, is widespread and its occurrence depends on vegetation type and state, climatic and meteorological conditions and land use. From a global perspective human-made res form by far the majority, whether accidental or deliberate (Levine 1992), although lightning-induced re is responsible for the majority of burning in boreal regions (Stocks 1992). Human-made res are closely related to land use and there are many reasons for setting them (Andreae 1992). Over recent years the growing concern in scienti c communities and among international policy makers about climate change and environmental degradation *Present address: Sarmap SA, Cascine di Barico, 6989 Purasca, Switzerland. E-mail address:
[email protected] International Journal of Remote Sensing ISSN 0143-1161 print/ISSN 1366-5901 online © 2000 Taylor & Francis Ltd http://www.tandf.co.uk/journals/tf/01431161.html
1290
E. Dwyer et al.
has highlighted the requirement for improved information on the dynamics of biomass burning at global scales. As a consequence, re as an agent of change is now systematically investigated. Burning produces very large emissions of trace gases and aerosol particles, however, there is much uncertainty as to the quantities emitted (Crutzen and Andreae 1990), the plume trajectories (Cooke et al. 1996) and the consequences on the Earth’s radiative budget and hence climate. The impact on the biogeochemical cycles of several elements such as P, Ca, Mn, Zn, Cl, Si and K, which are released during burning is, unknown. They may also act as cloud condensation nuclei, therefore a ecting the mechanisms of cloud formation. This can have consequences on precipitation patterns at regional and global scales (Fishman et al. 1993). Fire practises are also of interest from the perspective of land use and potential land degradation. Fire is widely used as a tool in land management, but its misuse coupled with excessive grazing and unfavourable meteorological conditions can lead to soil erosion, changes in hydrological cycles, an increase in water runo and modi cations in the soil’s nutrient status (Menaut et al. 1993, Maass 1995). Due to the lack of information on the global distribution of vegetation res, the spatial and temporal distribution of surface ozone has been used as a proxy for locating re events and the burning season (Hao and Liu 1994). The method is recognized as being approximate and there is a strong need for improved maps of global biomass burning (Crutzen and Goldammer 1993, Hein et al. 1997). Satellite remote sensing is the only technology which allows consistent and extensive data collection at global scales. Its use for the detection and monitoring of active res at local and continental scales has been developed over many years and a number of di erent sensors and systems, such as Landsat Thematic Mapper (TM) (Brustet et al. 1992), National Oceanic and Atmospheric Administration (NOAA) Advanced Very High Resolution Radiometer (AVHRR) (Setzer and Pereira 1991, Langaas 1992, Ko et al. 1996), the Defence Meteorological Satellite Program (DMSP) satellite (Cahoon et al. 1992), and the Geostationary Operational Environmental Satellite (GOES) (Prins and Menzel 1994) have been exploited. The widespread use of AVHRR data for active re detection is due to the presence of suitable thermal sensors on the instrument, the data produced being inexpensive and widely available, the existence of historical archives, daily coverage of the areas studied and a spatial resolution suitable for regional-scale studies (Kendall et al. 1997). The Joint Research Centre of the European Commission has played an active part in the International Geosphere–Biosphere Programme (IGBP) Data and Information System (DIS) project to produce a Global Fire Product (GFP) (Dwyer et al. 1998). We have processed daily global coverage imagery for the 21 months from April 1992 to December 1993 to detect vegetation res over the whole world. The processing strategy and implementation are described in Stroppiana et al. (2000). This paper discusses the spatial and temporal distributions of the detected res during the 12-month period from April 1992 to March 1993. The regional patterns are highlighted and the main vegetation types a ected by burning are identi ed. 2.
Methodology Most res, depending on whether they are smouldering or aming, burn at temperatures between 500 K and 1200 K. At these temperatures there is a very strong infrared emission at wavelengths of 3–5 mm. Fire detection using AVHRR data has traditionally depended on imposing xed thresholds on the values recorded in channels 3 and 4, which operate at 3.7 mm and 10.8 mm respectively. The appropriate
Global and regional land cover characterization
1291
thresholds are calculated empirically and depend on vegetation type, region and time of year. More recent methods using contextual algorithms compute relative thresholds based upon statistics calculated from neighbouring pixels. An adaptation of this method has been implemented in the processing system used here. Firstly, a simple threshold test is applied pixel by pixel to both channels 3 and 4 in order to select those pixels that may contain a re. A contextual test is then applied to these potential res. This test involves the calculation of statistics on channel 3 and 4 pixels in a variable sized window, centred on the pixel under consideration. A potential re pixel is con rmed as a re pixel, if it is much warmer than the background pixels within the window. The algorithm and processing system are explained in more detail in works by Stroppiana et al. (2000) and Flasse and Ceccato (1996). Modelling work shows that contextual algorithms provide the most consistent range of re detectability across vegetation types and seasons and are therefore most appropriate for global applications (Giglio et al. 1999). The data set used here was constructed as part of the IGBP’s project to produce a 1 km resolution global land cover map from satellite imagery (Eidenshink and Faundeen 1994, Loveland and Belward 1997). For each day processed, the system ingests 2 gigabytes of data from tape, which represents the 5 channels of the raw AVHRR data for the 14 orbits covering all land areas of the globe. Firstly the data are geolocated using an orbit model obtained from the Colorado Center for Astrodynamics Research (CCAR) (Rosborough et al. 1994). The orbit model is typically accurate to Ô 2 pixels. Then all ocean and large inland water bodies are masked out. A ‘no-burn’ mask is applied to exclude regions where the surface is of a type which does not support any signi cant vegetation re. These masks signi cantly reduce the amount of data to be subsequently processed. A simple cloud detection algorithm based on that of Saunders and Kriebel (1988) is applied before nally testing the remaining pixels for the presence of hot sources using the algorithm outlined above. The output from the re detection system is a list of latitude and longitude positions of all re pixels detected in one day. A re pixel is any AVHRR image pixel in which a hot source has been detected. Both spatial and temporal compositing techniques can be used to generate gridded products at any desired resolution greater than 0.01ß . 3. Results 3.1. T he yearly cycle of re activity The re detection algorithm used to process the data identi es image pixels which radiate more strongly than their neighbours in the infrared. These pixels are identi ed as re pixels if they pass a series of tests. A total of 6.5 million re pixels were detected in the 12 months of 1 km resolution AVHRR data analysed. However, these are not evenly distributed throughout the year. There is a peak in global re activity in July and August. Activity then decreases slowly reaching a minimum in early November when the number detected is only 28% of those detected during the period of peak burning. From November, re activity increases again reaching another lower peak in late December and January after which it reduces. Independent validation of a global product such as this is not possible. Fires are ephemeral events and evidence of their passage may last a very short time, particularly in tropical ecosystems. The algorithm used for re detection was chosen and
1292
E. Dwyer et al.
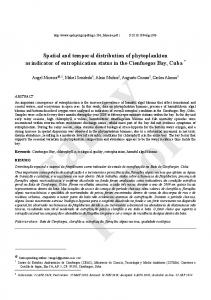
recommended to IGBP-DIS, as the most appropriate for global applications, by an international expert group (IGBP 1996). During the prototyping of the system, the results were compared with those from visual interpretation for a number of areas. From those pixels selected by the algorithm as re, visual analysis con rmed that 85% were de nitely res (EOS 1995). Comparison of the performance of the contextual algorithm with multi-threshold algorithms for Africa led Eva and Flasse (1996) to favour the former. We have compared re patterns with those derived from the same AVHRR data using regionally speci c satellite data analysis methods for southeast Asia (Jones 1997), Africa (Arino and Melinotte 1995) and Brazil (Miranda et al. 1994). They are in close agreement. Di erences in the absolute number of res detected are due to the use of di erent algorithms. As part of the IGBP-DIS GFP veri cation procedure, adopted at the re working group meeting in Toulouse in March 1998, feedback on the GFP will be sought from regional experts. This information will be combined with data from eld studies in order to identify the shortcomings of the product. Areas where we believe anomalous detections occur are discussed below. Cloud cover inhibits the detection of res. Although the probability of ignition of a re under heavy cloud is reduced (Moula 1996), it is still possible that burning occurs in cloudy conditions (Robinson 1992). Analysis of this data set shows that many tropical regions are cloud free for over 6 months of the year, while in equatorial, temperate and boreal regions cloud cover can persist for very long periods. Due to the lack of ground observations on re presence in cloudy conditions, it is impossible to make any estimation of the number of res not observed due to cloud. 3.2. Geographical distribution of vegetation res Figure 1 shows the location and number of vegetation res detected over threemonth periods in the year studied. 38% of all re pixels were located in the Southern Hemisphere. Although only 26% of the global land surface is located south of the equator, much of it lies within or near the tropics, which is the area subject to most burning. 50% of all re pixels detected were on the African continent. This large contribution of Africa to global biomass burning is in agreement with previously published material (Andreae 1992, Hao and Liu 1994). Most of the res are set in the savanna regions. Reasons for burning are numerous and vary across the continent, but some of the more common are burning to remove unpalatable stubble and to initiate o -season regrowth of fresh shoots, clearing ground for crops, establishment of re-breaks around settlements, removal of parasites, to drive game out of hiding and to make pathways accessible (Menaut et al. 1992). Figure 1 and gure 2(a) show that in Africa north of the equator, re stretches in a band from Senegal to Ethiopia, the main burning season being from November to April with peak activity in late December and early January. Burning then shifts with the dry season to the Southern Hemisphere and from May through to early November it moves in a west to east direction across the continent ( gure 2(b)). Southern Africa experienced a long drought in 1991–1992 which is believed to have resulted in reduced re activity as the amount of fuel available for burning was much less than normal (Justice et al. 1996). The temporal pattern of re activity in Africa is illustrated in gure 3, which shows the month by which 50% of all re pixels had been detected in a given cell. There is a progressively later onset of the re season, linked with the passage of the dry season, from north to south in the Northern Hemisphere while there is a west
Figure 1.
The number of re pixels detected in cells of 0.5ß Ö 0.5ß over 3-month periods is shown. Those cells containing less than ten re pixels are not indicated as they unrealistically exaggerate the amount of burning in this type of representation.
Global and regional land cover characterization 1293
1294
E. Dwyer et al.
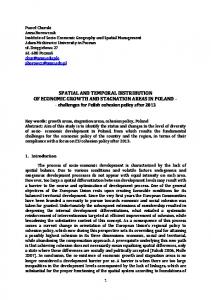
Figure 2. The world was divided into eight regions considering both land masses and the timing of the re season. The number of re pixels (in thousands) detected in each region for each 10-day period from 1 April 1992 to 27 March 1993 is shown.
to east movement south of the equator. This type of information can be extracted from the data set for any part of the globe. In southern Asia there are three main regions of activity ( gure 1 and gure 2(c)). In peninsular south-east Asia the re season runs from late January to mid-May, with the highest activity being detected in early April. This late dry season burning is associated with forest areas and may be due to shifting cultivation, since the most e cient burns are achieved after prolonged drying of felled vegetation (Jones 1997). In eastern India and in particular in the Orissa province there is burning from late February with a peak in activity in early June, after which burning decreases very rapidly. According to Joshi (1992), 90% of the area a ected by forest re in India is in the Orissa province; however estimates of total re occurrence in India are
Global and regional land cover characterization
1295
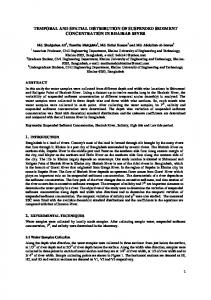
Figure 3. The month by which 50% of the re pixels had been detected in Africa in each cell of 0.5ß Ö 0.5ß is shown. The areas in white correspond to arid regions and were masked before re detection. The timing of the re season is useful in evaluating re e ects on vegetation and ecosystems and also in determining the direction in which emissions will travel.
widely varying. Fires detected on the slopes of the Himalayas are associated with graziers who annually burn the forest litter layer; this forms a very slippery surface and can be dangerous for cattle (Goldammer and Pen˜a el 1990). The third region in which many re events were detected is in eastern China; re pixels can be detected in the plains drained by the Yangtze and Yellow rivers between late May and August. Burning of eld residues from rice, wheat, maize and other crops is increasing in China as organic composts are replaced by chemical fertilisers and industry switches to fossil fuels (Zhuang et al. 1996). Some false detections due to Sun glint from water occur in this extensively irrigated area. Burning in South America, south of the equator, begins in June, with peak activity remaining practically constant from late August to mid-October ( gure 2(d)). Most of the burning takes place in the grasslands of north-east Brazil, where ranchers use re in the management of grazing areas and small farmers burn crop residues. In September burning is most intense in the states of Mato Grosso and Rondonia, towards the border with Bolivia. These observations are in very good agreement with those of the Instituto Nacional de Pesquisas Espaciais (INPE) (Miranda et al. 1994). We also detected re pixels in Argentina, on or near the lower slopes of the Andes, from November to early March. As this is during the austral summer, many of these may be spurious detections due to hot bare soil and the salt ats of the ‘Salinas Grandes’. In the Central American region, shown in gure 2(e)—which for the purposes of this study includes South American countries north of the equator—there is a south
1296
E. Dwyer et al.
to north migration in the burning pattern. In Venezuela and Colombia savanna burning starts towards the end of January reaching a peak in early April after which it dies o . Burning in Central American countries peaks about a month later and continues, with res being observed in Mexico into early August. Most of the burning events in Australia are in the savanna grasslands of Arnhem Land in the so-called ‘Top-End’ of the Northern Territory. These res move in a west to east direction across the province from May to November ( gure 2 ( f )). In the east in Queensland and along the southern coast, there is widespread low-level burning activity which reaches a peak in January and February. The location and timing of the res detected are in good agreement with known re patterns in Australia (Tapper et al. 1993). In insular south-east Asia, in particular in New Guinea and Borneo, burning occurs from August to November, with a high density of re events observed in southern New Guinea. The widespread burning which occurred in these regions in 1997 and into 1998 was favoured by an abnormally long dry season which allowed res to spread more easily and uncontrollably. The Europe/Eurasia window ( gure 2( g)) covers the largest geographical area of all the regions investigated. This region is characterized by a well de ned re season from April to September, outside of which very few re events were detected. In the Mediterranean regions re activity reaches a maximum at the end of July and beginning of August. A large band of re stretches across Eurasia from the Black Sea to Lake Baikal and beyond, starting in early April and dying out towards the end of August. Here, res are started by farmers to clear land and burn crop residues, and if not properly controlled can spread to nearby forested lands. In the more northern latitudes of Siberia there is widespread low-density re activity in July and August. Fires due to lightning are frequent in the Taiga and are important in controlling forest regeneration and conditions (Cahoon et al. 1996, Goldammer and Furyaev 1996). In North America most of the burning takes place over quite a short season between May and August ( gure 2(h)). Although low-density burning is observed across the region there are three main areas of activity. The region of most dense activity runs through Kansas, Oklahoma and Texas where the peak activity is in late June and early July. Burning to clear agricultural elds is common practise in this area and res have also been observed here by the GOES satellite ( http://cimss.ssec.wisc.edu/goes/misc/ res_ok.html ). Another band of re activity stretches down the west coast from Washington state to California and into Arizona. As certain regions of these states are arid there may be some false detections due to hot soil. There is also a band of re activity stretching from the Great Lakes up past Lake Winnipeg in Canada. This is a region of frequent re activity as reported by the Canadian Forest Service (http://fms.nofc.cfs.nrcan.qc.ca/ cw s/index.html). There is a high inter-annual variability in burning. The number of res reported in Canada in 1992 was about average, however the area of forest land burned was one of the lowest in the last 25 years ( http://www.nrcan.qc.ca:80/cfs/proj/iepb/nfdp/frames2_e.htm ). About ten times as many res were detected in the US as compared with Canada. This is broadly in line with the gures reported by Stocks and Trollope (1993). Prescribed burning as a means of forest management is common in North America, however, the small proportion (~ 10%) of wild res caused by lightning is responsible for about 90% of the area burned (Cofer et al. 1996).
Global and regional land cover characterization
1297
3.3. Vegetation types a ected by burning The IGBP-DIS has been co-ordinating a project to produce a global land cover map at a resolution of 1 km using AVHRR data. This map has been recently made available and, although it is still undergoing veri cation and validation, it represents the highest resolution and most up-to-date map of global land cover available (Loveland and Belward 1997). Using the 25 class United States Geological Survey (USGS) legend supplied we determined the re distribution among the di erent vegetation types. Almost 90% of all the re pixels detected were found in eight vegetation types. Table 1 shows the percentage of dry land surface covered by each of these vegetation types, the proportion of each type a ected by re and the percentage of the Earth’s land surface this represents. Although res were detected in over 6% of 1 km land pixels in the course of the year, this does not mean that this much surface area was burned. Each re pixel detected covers a surface area from approximately 1 km2 to 12 km2, depending on the sensor scan angle, and can contain one or more res of unknown dimensions and intensity. The actual re size and burn e ciency depends on the vegetation type, moisture loading and meteorological conditions at the time of burning. Area burned should not be extrapolated from the re position data. Savanna res are predominant, accounting for the largest proportion of pixels containing res. Broadleaf forest also experiences burning, with a larger proportion of deciduous forests a ected than evergreens. Croplands, which are the third largest contributor, are often burned in order to remove residues after harvesting, as noted above. However, the impact of re on the ecosystems or atmosphere cannot be simply inferred from the number of res detected alone. For example, in boreal ecosystems, the annual number of re events is quite small in terms of global activity, however, the amount of biomass, both above and below ground, that is consumed can be enormous, resulting in the release of carbon stocks that may have been accumulated over hundreds of years (Kasischke 1996). Table 2 shows the regional distribution of burning for each of these eight Table 1. Vegetation types a ected by re. The eight vegetation types, as de ned in the IGBPDIS land cover map, which showed the most re activity account for 66% of the Earth’s land surface. Varying amounts of each vegetation type were a ected by re, however, savanna burning was the most widespread.
Vegetation type Savanna Evergreen broadleaf forest Deciduous broadleaf forest Dryland crops and pasture Shrubland Cropland/woodland mosaic Irrigated crops and pasture Grassland
Per cent of global land surface
Per cent of 1 km2 vegetation pixels with res
Per cent of global 1 km2 land pixels with re
11 10
19 7
2.1 0.7
5
13
0.6
9
6
0.5
12 7
4 7
0.5 0.5
3
14
0.4
9
4
0.3
E. Dwyer et al.
1298
Table 2. Percentage of re pixels in each region as percentage of total observed in each vegetation type. Northern Southern Southern South Central Australia/ Europe/ North Africa Africa Asia America America Paci c Eurasia America Savanna Evergreen broadleaf forest Deciduous broadleaf forest Dryland crops and pasture Shrubland Cropland/woodland mosaic Irrigated crops and pasture Grassland
51 36
27 24
4 13
3 13
5 9
8 5
1 0
1 0
0
78
11
3
6
0
1
1
6
5
27
6
10
3
36
7
26 9
3 30
16 11
15 36
8 2
13 0
10 11
9 1
1
0
85
0
3
1
8
2
10
6
7
23
5
3
26
17
vegetation types, where the regions are as described previously. Over three quarters of savanna burning occurs on the African continent. In the evergreen forest domain 60% of the res were observed in Africa while res in the Central and South American regions contribute another 20%. Deciduous forest is dominated by res in southern Africa. Dry cropland res are mostly seen in the Eurasian and southern Asian windows, while burning in irrigated crop areas is almost exclusively con ned to Asia. However, care must be taken in the interpretation of this last gure, as it is known that many false detections result from Sun glint from temporary water surfaces that have not been masked due to the lack of an approriate digital data set. Grassland res are seen in the more temperate regions of South America, North America and Eurasia. As the land cover map used is general, using only 25 classes to map the whole globe, some important details are masked. For example, the class mapped as decidious forest in southern Africa is commonly known as miombo, which is open woodland dominated by small trees and shrubs and which is regularly burned. 4.
Discussion The production of a 21-month daily inventory of active vegetation re occurrence and the analysis of a 12-month portion of it represents the rst attempt to characterize one aspect of biomass burning on a global scale using direct observations of the phenomenon. Fires occur throughout the year but there is a strong spatial and temporal variability. Although the majority of re events were observed in the tropics, much re activity was also present in temperate and boreal regions. Accurate information at a sub-regional resolution on the timing and duration of the re season is necessary in order to improve estimates of quantities of biomass consumed and correlate re events with the emission and transport of gaseous products and particulates (Kim and Newchurch 1998). Scholes et al. (1996) have shown, as part of the SAFARI-92 experiment in southern Africa, how re counts as determined from AVHRR satellite imagery can be calibrated, using high resolution data, to areas burned and thus used to determine the quantity of biomass consumed. Their estimates are smaller than those calculated using
Global and regional land cover characterization
1299
non-remotely sensed data, but they believe they are more realistic, even though re counts are not as accurate as direct measurements of area burned. Research into determining suitable algorithms to detect and quantify burned areas using satellite data at regional and global scales is ongoing (Barbosa et al. 1998, Pereira 1998, Roy et al. 1998). A number of international interdisciplinary projects have expressed a need for biomass burning related information. The GFP provides one piece of this complex jigsaw puzzle. The International Global Atmospheric Chemistry (IGAC) project needs information to quantify trace gas emissions and to determine their spatial and temporal patterns of occurrence (Scholes et al. 1996) and the impact of aerosols on the atmospheric radiation budget (Andreae 1997). Analysis of the role of re in land cover maintenance and change is one of the research aims of the Land-Use and Land-Cover Change (LUCC) Project (IGBP 1995), while the Global Change and Terrestrial Ecosystems (GCTE) project looks at the role of re as a disturbance factor in ecosystem dynamics (IGBP 1992). We are currently investigating the relationship between climatic conditions and re patterns observed. This is an important rst step in helping us to determine how current re regimes may be modi ed under a changed climate. Although remote sensing o ers an unprecedented opportunity to carry out global monitoring, there are a number of limitations in re detection using the AVHRR sensor alone. AVHRR imagery only represents a snapshot of the total number of res which burn in any 24-hour period, re counts may be either overestimated or underestimated due to confusion with hot surfaces and Sun glint from re ective surfaces such as water and clouds. Although aming res with fronts as short as 50 m can be detected, in general no information on the re characteristics (e.g. size, temperature) is available. However, this single observation system approach will soon be qualitatively and quantitatively improved by combining global data sets of both active res and burned areas from di erent Earth observing systems such as the Japanese Earth Resources Satellite (J-ERS) Synthetic Aperture Radar (SAR), the Along Track Scanning Radiometer (ATSR) data set from the European Space Agency (ESA) ERS, the VEGETATION instrument on SPOT, the Moderate Resolution Imaging Spectroradiometer (MODIS) data set from the Earth Observing System (EOS) and other small satellites speci cally designed for re detection. Acknowledgments The satellite data processed and analysed in this study were provided by the USGS EDC Sioux Falls (US) and ESA/ESRIN Frascati (Italy) in the framework of IGBP-DIS activities. The assistance of J. Eidenshink in securing the data is acknowledged. E.D. was supported by a doctoral grant from the European Commission’s TMR programme. References Andreae, M. O., 1992, Biomass burning: its history, use, and distribution and its impact on environmental quality and global climate. In Global Biomass Burning, Atmospheric, Climatic, and Biospheric Implications, edited by J. Levine (Cambridge, MA: MIT Press), pp. 3–21. Andreae, M. O., 1997, Raising dust in the greenhouse. Nature, 380, 389–390. Arino, O., and Melinotte, J. M., 1995, Fire Index Atlas. Earth Observation Quarterly, 50, 11–16. Barbosa, P. M., GreÁ goire, J.-M., and Pereira, J. M. C., 1999, An algorithm for extracting
1300
E. Dwyer et al.
burned areas from time series of AVHRR GAC data applied at a continental scale. Remote Sensing of the Environment, 69, 253–263. Brustet, J. M., Vickos, J. B., Fontan, J., Podaire, A., and Lavenu, F., 1992, Characterization of active res in west African savannas by analysis of satellite data: Landsat Thematic Mapper. In Global Biomass Burning, Atmospheric, Climatic, and Biospheric Implications, edited by J. Levine (Cambridge, MA: MIT Press), pp. 53–60. Cahoon, D. R., Stocks, B. J., Levine, J. S., Cofer, W. R., and Barber, J. A., 1996, Monitoring the 1992 forest res in the boreal ecosystem using NOAA AVHRR satellite imagery. In Biomass Burning and Global Change, Vol. 2, edited by J. Levine (Cambridge, MA: MIT Press), pp. 795–801. Cahoon, D. R., Stocks, B. J., Levine, J. S., Cofer, W. R., and O’ Neill, K. P., 1992, Seasonal distribution of African savanna re. Nature, 359, 812–815. Cofer, W. R., Winstead, E. L., Stocks, B. J., Overbay, L. W., Goldammer, J. G., Cahoon, D. R., and Levine, J. S., 1996, Emissions from boreal forest res: are the atmospheric impacts underestimated? In Biomass Burning and Global Change, Vol. 2, edited by J. Levine (Cambridge, MA: MIT Press), pp. 834–839. Cooke, W. F., Koffi, B., and GreÁ goire, J.-M., 1996, Seasonality of vegetation res in Africa from remote sensing data and application to a global chemistry model. Journal of Geophysical Research, 101, 21051–21065 Crutzen, P. J., and Andreae, M. O., 1990, Biomass burning in the tropics: impact on atmospheric chemistry and biogeochemical cycles. Science, 250, 1669–1788. Crutzen, P. J., and Goldammer, J. G., (editors), 1993, Fire in the environment: the ecological, atmospheric, and climatic importance of vegetation res. Environmental Sciences Research Report, Vol. 13 (Chichester: Wiley). Dwyer, E., GreÁ goire, J.-M., and Malingreau, J.-P., 1998, A global analysis of vegetation res using satellite images: spatial and temporal dynamics. Ambio, 27, 175–181. Eidenshink, J. C., and Faundeen, J. L., 1994, The 1-km AVHRR global land data set: rst stages in implementation. International Journal of Remote Sensing, 15, 3443–3462. EOS (Earth Observation Sciences), 1995, Global Vegetation Fire Product nal report. Report No. EOS-95/125-FR-001, GUM Unit, JRC, Ispra, Italy. Eva, H., and Flasse, S., 1996, Contextual and multiple-threshold algorithms for regional active re detection with AVHRR data. Remote Sensing Reviews, 14, 333–351. Fishman, J., Logan, J., Artaxo, P. E., Cachier, H., Carmichael, G. R., Dickinson, R., Fosberg, M. A., Helas, G., Kanakidou, M., Lacaux, J.-P., and Rohrer, F., 1993, Group report: what is the impact of res on atmospheric chemistry, climate, and biogeochemical cycles? In Fire in the environment: the ecological, atmospheric, and climatic importance of vegetation res. Environmental Sciences Research Report, Vol. 13, edited by P. J. Crutzen and J. G. Goldammer (Chichester: Wiley), pp. 345–356. Flasse, S., and Ceccato, P., 1996, A contextual algorithm for AVHRR re detection. International Journal of Remote Sensing, 17, 419–424. Giglio, L., Kendall, J. D., and Justice, C. O., 1999, Evaluation of global re detection algorithms using simulated AVHRR infrared data. International Journal of Remote Sensing, 20, 1947–1985. Goldammer, J. G., and Furyaev, V. V., (editors), 1996, Fire in Ecosystems of Boreal Eurasia (Dordrecht: Kluwer). Goldammer, J. G., and Pen~afiel, S. R., 1990, Fire in the pine-grassland biomes of tropical and subtropical Asia. In Fire in the T ropical Biota, edited by J. G. Goldammer (Berlin: Springer-Verlag), pp. 45–62. Hao, W. M., and Liu, M.-H., 1994, Spatial and temporal distribution of tropical biomass burning. Global Biogeochemical Cycles, 8, 495–503. Hein, R., Crutzen, P. J., and Heinmann, M., 1997, An inverse modeling approach to investigate the global atmosphere methane cycle. Global Biogeochemical Cycles, 11, 43–76. IGBP, 1992, Global Change and Terrestrial Ecosystems: the Operational Plan. IGBP Global Change Report No. 21, IGBP, Stockholm. IGBP, 1995, Land-Use and Land-Cover Change, Science/Research Plan. IGBP Global change Report No. 35 and HDP Report No. 7, Stockholm and Geneva. IGBP, 1996, The IGBP-DIS re algorithm workshop 2, IGBP-DIS Working Paper No. 14, IGBP, Toulouse, France.
Global and regional land cover characterization
1301
Jones, S. H., 1997, Vegetation re in mainland Southeast Asia: spatio-temporal analysis of AVHRR 1 km data for the 1992/93 dry season. Report No. EUR 17282 EN, European Commission, Luxembourg. Joshi, V., 1992, Biomass burning in India. In Global Biomass Burning, Atmospheric, Climatic and Biospheric Implications, edited by J. Levine (Cambridge, MA: MIT Press), pp. 185–193. Justice, C. O., Kendall, J. D., Dowty, P. R., and Scholes, R. J., 1996, Satellite remote sensing of res during the SAFARI campaign using NOAA advanced very high resolution radiometer data. Journal of Geophysical Research, 101, 23851–23863. Kasischke, E. S., 1996, Fire, climate change, and carbon cycling in Alaskan boreal forests. In Biomass Burning and Global Change, Vol. 2, edited by J. (Cambridge, MA: MIT Press), pp. 827–833. Kendall, J. D., Justice, C. O., Dowty, P. R., Elvidge, C. D., and Goldammer, J. G., 1997, Remote sensing of res in Southern Africa during the SAFARI 1992 campaign. In: Fire in Southern Af rican Savannas. Ecological and Atmospheric Perspectives, edited by B. van Wilgen, M. O. Andreae, J. G. Goldammer and J. Lindesay (Johannesburg: University of Witwatersrand Press), pp. 89–133. Kim, J. H., and Newchurch, M. J., 1998, Biomass-burning in uence on troposphere ozone over New Guinea and South America. Journal of Geophysical Research, 103, 1455–1461. Koffi, B., GreÁ goire, J.-M., and Eva, H. D., 1996, Satellite monitoring of vegetation res on a multiannual basis at continental scale in Africa. In Biomass Burning and Global Change, Vol. 1, edited by J. Levine (Cambridge, MA: MIT Press), pp. 225–235. Langaas, S., 1992, Temporal and spatial distribution of savanna res in Senegal and the Gambia, West Africa 1989–90, derived from multi-temporal AVHRR night images. International Journal of W ildland Fire, 2, 21–36. Levine, J. S., 1992, Introduction: global biomass burning: atmospheric, climatic, and biospheric implications. In Global Biomass Burning, Atmospheric, Climatic, and Biospheric Implications, edited by J. Levine (Cambridge, MA: MIT Press), pp. xxv–xxx. Loveland, T. R., and Belward, A. S., 1997, The IGBP-DIS global 1 km land cover data set, DISCover: rst results. International Journal of Remote Sensing, 18, 3289–3296. Maass, J. M., 1995, Conversion of tropical dry forest to pasture and agriculture. In Seasonally Dry T ropical Forests, edited by S. H. Bullock, H. A. Mooney and E Medina (Cambridge: Cambridge University Press), pp. 399–422. Menaut, J.-C., Abbadie, L., Lavenu, F., Loudjani, P., and Podaire, A., 1992, Biomass burning in west African savannas. In Global Biomass Burning, Atmospheric, Climatic, and Biospheric Implications, edited by J. Levine (Cambridge, MA: MIT Press), pp. 133–142. Menaut, J.-C., Abbadie, L., and Vitousek, P. M., 1993, Nutrient and organic matter dynamics in tropical ecosystems. In Fire in the environment: the ecological, atmospheric, and climatic importance of vegetation res. Environmental Sciences Research Report, Vol. 13, edited by P. J. Crutzen and J. G. Goldammer (Chichester: Wiley), pp. 215–231. Miranda, E. E. de, Setzer, A. W., and Takeda, A. M., 1994, Monitoramento orbital das queimadas no Brasil (Remote Sensing of Fires in Brazil) (Campinas: ECOFORC ¸ A). Moula, M., 1996, Mode´lisation des feux de biomasse en savane africaine et e´valuation des e´missions dans l’atmosphere de constituants en trace. Doctoral Thesis, Universite´ Paul Sabatier, Toulouse, France. Order Number 2262. Pereira, J. M. C., 1999, A comparative evaluation of NOAA/AVHRR vegetation indices for re scar detection and mapping in the Mediterranean-type region. IEEE T ransactions on Geoscience and Remote Sensing, 37, 217–226. Prins, E. M., and Menzel, W. P., 1994, Trends in South American biomass burning detected with the GOES visible infrared spin scan radiometer atmospheric sounder from 1983 to 1991. Journal of Geophysical Research, 99, 16719–16735. Robinson, J., 1992, Problems in global re evaluation: is remote sensing the solution? In Global Biomass Burning, Atmospheric, Climatic, and Biospheric Implications, edited by J. Levine (Cambridge, MA: MIT Press), pp. 67–73. Rosborough, G., Baldwin, D., and Emery, W. J., 1994, Precise AVHRR image navigation. IEEE T ransactions on Geoscience and Remote Sensing, 32, 644–657. Roy, D. P., Giglio, L., Kendall, J. K., and Justice, C. O. 1999, Multitemporal active- re based burn scar detection algorithm. International Journal of Remote Sensing, 20, 1031–1038.
1302
Global and regional land cover characterization
Saunders, R. W., and Kriebel, K. T., 1988, An improved method for detecting clear-sky and cloud radiances from AVHRR data. International Journal of Remote Sensing, 9, 123–150. Scholes, R. J., Kendall, J., and Justice, C. O., 1996, The quantity of biomass burned in southern Africa. Journal of Geophysical Research, 101, 23667–23676. Setzer, A., and Pereira, M., 1991, Amazonia biomass burnings in 1987 and an estimate of their tropospheric emissions. Ambio, 20, 19–22. Stocks, B. J., 1992, The extent and impact of forest res in northern circumpolar countries. In Global Biomass Burning, Atmospheric, Climatic, and Biospheric Implications, edited by J. Levine (Cambridge, MA: MIT Press), pp. 197–202. Stocks, B. J., and Trollope, W. S. W., 1993, Fire management: principles and options in the forested and savanna regions of the world. In Fire in the environment: the ecological, atmospheric, and climatic importance of vegetation res. Environmental Sciences Research Report, Vol. 13, edited by P. J. Crutzen and J. G. Goldammer (Chichester: Wiley), pp. 315–326. Stroppiana, D., Pinnock, S., and GreÁ goire, J.-M., 2000, The Global Fire Product: daily re occurrence from April 1992 to December 1993 derived from NOAA AVHRR data. International Journal of Remote Sensing, 21, 1279–1288. Tapper, N. J., Garden, G., Gill, J., and Fernon, J., 1993, The climatology and meteorology of high re danger in the northern territory. Rangeland Journal, 15, 339–351. Zhuang, Y.-H., Cao, M., Wang, X., and Yao, H., 1996, Spatial distribution of trace-gas emissions from burning crop residue in China. In Biomass Burning and Global Change, Vol. 2, edited by J. Levine (Cambridge, MA: MIT Press), pp. 764–770.