letters to nature 13. Antoniadis, I., Bachas, C., Ellis, J. & Nanopoulos, D. V. Comments on cosmological string solutions. Phys. Lett. B 257, 278–284 (1991). 14. Lukierski, J., Nowicki, A. & Ruegg, H. Classical and quantum-mechanics of free k-relativistic systems. Ann. Phys. 243, 90–116 (1995). 15. Amelino-Camelia, G. Enlarged bound on the measurability of distances and quantum k-Poincare´ group. Phys. Lett. B 392, 283–286 (1997). 16. ‘t Hooft, G. Quantization of point particles in (2 + 1)-dimensional gravity and space-time discreteness. Class. Quant. Grav. 13, 1023–1039 (1996). 17. Amelino-Camelia, G., Ellis, J., Mavromatos, N. E. & Nanopoulos, D. V. Distance measurement and wave dispersion in a Liouville string approach to quantum gravity. Int. J. Mod. Phys. A 12, 607–623 (1997). 18. Amelino-Camelia, G. Limits on the measurability of space-time distances in the semi-classical approximation of quantum gravity. Mod. Phys. Lett. A 9, 3415–3422 (1994). 19. Baring, M. G. Gamma-ray bursts above 1 GeV. in Towards a Major Atmospheric Cerenkov Detector (ed. de Jager, O. C.) (Proc. Kruger National Park TeV Workshop, Westprint, Potchefstroom, in the press); also as preprint astro-ph/9711256. 20. Rees, M. J. Gamma-ray bursts: challenges to relativistic astrophysics. in Proc. 18th Texas Symp. on Relativistic Astrohysics 1996 (eds Olinto, A., Friemann, J. & Schramm, D. N.) (World Scientific, in the press); also as preprint astro-ph/9701162. 21. Me´sza´ros, P. Theoretical models of gamma-ray bursts. in Gamma-Ray Bursts (eds Meegan, C., Preece, R. & Koshut, T.) (Proc. 4th Huntsville Symp., Am. Inst. Phys., in the press); also as preprint astro-ph/ 9711354. 22. Bhat, C. L. et al. Evidence for sub-millisecond structure in a g-ray burster. Nature 359, 217–216 (1992). 23. Scargle, J. D., Norris, J. & Bonnell, J. Attributes of GRB pulses: Bayesian blocks analysis of TTE data; a microburst in GR920229. in Gamma-Ray Bursts (eds Meegan, C., Preece, R. & Koshut, T.) (Proc. 4th Huntsville Symp., Am. Inst. Phys., in the press); also as preprint astro-ph/9712016. 24. Barnett, R. M. et al. Review of particle properties. Phys. Rev. D 54, 207–720 (1996). 25. Witten, E. Strong coupling expansion of Calabi-Yau compactification. Nucl. Phys. B 471, 135–158 (1996). 26. Paczynski, B. Gamma-ray bursts at cosmological distances. Astrophys. J. 308, L43–L46 (1986). 27. Nemiroff, R. J. et al. Searching gamma-ray bursts for gravitational lensing echoes—Implications for compact dark matter. Astrophys. J. 414, 36–40 (1994). 28. Krawczynski, H. et al. Search for TeV counterparts of gamma-ray bursts with the HEGRA experiment. in Proc. Int. School of Cosmic-Ray Astrophysics (World Scientific, in the press); also as preprint astroph/9611044. 29. Boyle, P. J. et al. in Proc. 25th Int. Cosmic ray Conf. Vol. 3 (eds Potgieter M. S. et al.) 61 (Westprint, Potchefstroom, 1998); also as preprint astro-ph/9706132. 30. Hurley, K. et al. Detection of a g-ray burst of very long duration and very high energy. Nature 372, 652–654 (1994). Acknowledgements. G.A.-C. thanks J. Binney and other members of the Oxford Theoretical Astrophysics group for discussions. This work was supported in part by the Foundation Blanceflor BoncompagniLudovisi (G.A.-C), a PPARC advanced fellowship (N.E.M.) and the US Department of Energy (D.V.N.) Correspondence and requests for materials should be addressed to G.A.-C. at the University of Neuchatel (e-mail:
[email protected]).
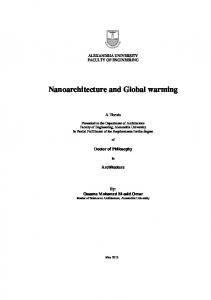
as Tycho 651672 and GSC6321−01030) was successfully observed with the Hubble Space Telescope (HST) in daylight over the northwest Pacific Ocean; Astrometer 3 of the Fine Guidance Sensors (FGS) was used to record the event5. Details of the HST data are given in Table 1 along with information about other observing stations; the immersion and emersion data (disappearance and reappearance of the star) are shown in Fig. 1. A central flash (the focusing of light rays by Triton’s atmosphere6,7) was recorded, but will be presented and analysed elsewhere. We modelled the HST light curve with a standard small-planet model that allows for a power-law temperature gradient8 (Table 2). The background from dark counts and Triton (determined by the FGS in September and adjusted for Triton’s different distance) was subtracted, and the remainder was divided by the flux from the star (also determined by the FGS in September) so that the full range of stellar flux corresponded to values between 0.0 and 1.0. In the lightcurve model fits, the zero level was fixed, but the full-scale signal from the star was a free parameter. The difference of the fitted values from 1.0 shows that our calibration error is only a few tenths of one per cent. From fitting the entire light curve, the closest-approach distance between the centre of Triton’s shadow and the HST was determined to be 224 6 4 km (first column of results in Table 2). This value places the shadow somewhat further north than predicted, but it is consistent with no detectable occultation at our Oahu station (Table 1). Using the closest-approach distance determined from the entire light curve, we fitted the main immersion and emersion sections of the light curve both separately and together (next three columns of results in Table 2). As a test of the self-consistency of our light-curve models, we fixed the atmospheric model parameters (‘‘half-light radius’’, ‘‘lambda at half-light,’’ and the ‘‘thermalgradient exponent’’; see ref. 8) at their values determined from
8
1.00
J. L. Elliot*†‡, H. B. Hammel*, L. H. Wasserman‡, O. G. Franz‡, S. W. McDonald*, M. J. Person*, C. B. Olkin‡, E. W. Dunham‡, J. R. Spencer‡, J. A. Stansberry‡, M. W. Buie‡, J. M. Pasachoff§, B. A. Babcockk & T. H. McConnochie§ * Department of Earth, Atmospheric, and Planetary Sciences, † Department of Physics, Massachusetts Institute of Technology, Cambridge, Massachusetts 02139-4307, USA ‡ Lowell Observatory, Flagstaff, Arizona 86001, USA § Astronomy Department, k Physics Department, Williams College, Williamstown, Massachusetts 01267-2565, USA
0.75 Normalized stellar signal
Global warming on Triton
0.50 0.25
a
b
c
d
0.01 0.00 -0.01
-2,100 -1,800 -1,500
1,300
1,600
1,900
Distance along path (km)
.........................................................................................................................
Figure 1 Triton occultation light curves from the HST. Data before and after the
Triton, Neptune’s largest moon, has been predicted to undergo significant seasonal changes that would reveal themselves as changes in its mean frost temperature1–3. But whether this temperature should at the present time be increasing, decreasing or constant depends on a number of parameters (such as the thermal properties of the surface, and frost migration patterns) that are unknown. Here we report observations of a recent stellar occultation by Triton which, when combined with earlier results, show that Triton has undergone a period of global warming since 1989. Our most conservative estimates of the rate of temperature and surface-pressure increase during this period imply that the atmosphere is doubling in bulk every 10 years—significantly faster than predicted by any published frost model for Triton2,3. Our result suggests that permanent polar caps on Triton play a dominant role in regulating seasonal atmospheric changes. Similar processes should also be active on Pluto. The 4 November 1997 occultation of the star Tr180 (also known
occultation were used to establish the modulation of the signal due to the
NATURE | VOL 393 | 25 JUNE 1998
astrometer scan, which was then removed from the entire data set. The zero and full-scale stellar flux levels were established with photometric data from an earlier FGS visit to these objects on 11 September 1997. At that time, Triton’s magnitude as observed by the FGS was 13.4 and the magnitude of Tr180 was 10.6. The FGS data have been averaged at 1.0 s; a, immersion data (filled circles) and light-curve model fit (line); b, emersion data (filled circles) and light-curve model fit (line; see fits in Table 2). The zero point of the abscissa is arbitrary. The light-curve model8 used a power-law thermal gradient; residuals from the fit in a are shown in c, and the residuals from the fit in b are shown in d. The r.m.s. residual along the full signal is ,0.0022 for a 1-s average, and is the result of photon noise. The remaining residuals that occur when the star is partially occulted are the result of unmodelled structure in Triton’s atmosphere and rarely exceed 0.01. The effect of these on our determination of the 1,400-km pressure can be estimated by differences among the fits in Table 1. The omitted central portion of the light curve (see text) corresponds to radii ,1,400 km (altitudes ,48 km); the atmosphere below that does not affect the 1,400-km pressure.
Nature © Macmillan Publishers Ltd 1998
765
letters to nature the combined immersion and emersion fit (second to last column in Table 2), and then fit the entire light curve again (last column in Table 2). Although the agreement is not perfect between all model fits for the atmospheric parameters at a radius of 1,400 km, it is very good. In particular, the close agreement between the immersion and emersion atmospheric parameters for two widely separated locations on Triton supports the idea that the sublimation and condensation of nitrogen maintains the surface frost at the same temperature. The pressure at 1,400 km, 2:3 6 0:1 mbar, is derived from the fit to the immersion and emersion data (the error bar includes the systematic differences between the fits in Table 1). This is significantly greater than the 1,400-km pressure of 1:4 6 0:1 mbar measured with stellar occultations in 19959 and the value of 0:8 6 0:1 mbar extrapolated from a surface pressure of 14 6 1 mbar measured by Voyager in 198910,11. The pressure at 1,400 km has certainly increased between 1995 and 1997, based on the two sets of stellar occultation data; the temperature at 1,400 km has also increased from 47 6 1 K (ref. 9) to 50:3 6 0:5 K. As these temperatures are consistent with the 1,400km temperature predicted by atmospheric models based on Voyager data12,13, a surface-pressure increase between the 1989 and more recent measurements is the most likely explanation for the difference (rather than using an inappropriate model for extrapolating the pressure from the surface to 1,400 km).
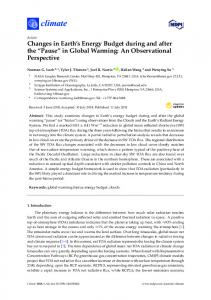
This surface-pressure increase implies a temperature increase of the surface frost, as the principal constituent of the tenuous atmosphere, nitrogen, is presumed to be in vapour-pressure equilibrium with the surface frost. The surface pressures and corresponding equilibrium temperatures for N2 are plotted in Fig. 2, where two cases are shown. In the first case, we have extrapolated the occultation pressures from a radius of 1,400 km to the surface radius of 1,352 km (an average of published values14,15) using a multiplicative factor of 17.5, which is valid under the assumption that the shape of the thermal profile12 has not significantly changed since the Voyager encounter (filled symbols in Fig. 2). We justify this assumption by the consistency of the atmospheric temperature at 1,400 km (Table 2) with the models12,13. These measurements show a steady increase in pressure and surface-frost temperature. At this rate the atmosphere has tripled in bulk since the time of the Voyager encounter, which would require ,0.9% of the total solar energy incident on Triton during the intervening time to sublime the frost. In the second case, we make a more conservative estimate of the surface pressure derived from the stellar occultation data by assuming an isothermal atmosphere below 1,400 km (open symbols in Fig. 2). Even for this case, the atmosphere has nearly doubled in bulk since the time of Voyager. Triton’s atmosphere is supported by surface frosts, which at any instant are expected to be at the same temperature everywhere, due
Table 1 Observations Site
Telescope aperture (m)
Detector
2.5 0.3
4 PMTs‡ CCD
Filter
Recording interval (UT on 4 Nov. 1997)
Integration time (s)
Aperture (arcsec)
S/N*
04:59:32–05:24:44 05:10:55–05:27:35
0.025 0.125
535 15 3 15
630 33
...................................................................................................................................................................................................................................................................................................................................................................
HST† LCC§
F583Wk Nonek
................................................................................................................................................................................................................................................................................................................................................................... * S/N refers to the signal-to-noise ratio of the occultation light curve (when the star is unocculted) over a time interval that corresponds to 20 km (approximately a scale height) of relative motion between the telescope and Triton’s shadow. † HSTwas located (in J2000 coordinates, km relative to the centre of the Earth) at ðx; y; zÞ ¼ ð 2 3;906; 2 5;752; 761Þ for immersion, and ðx; y; zÞ ¼ ð 2 1;898; 2 6;484; 1; 806Þ for emersion. Centreline observations with NASA’s Lear Jet Observatory were attempted, but failed due to target acquisition and tracking problems. Simultaneous optical and infrared observations with NASA’s Infrared Telescope Facility on Mauna Kea (MKO) and optical observations with a 0.4-m portable telescope on Tern Island were foiled by clouds; other groups had similar bad weather on the University of Hawaii 2.2-m telescope on MKO and on Kauai (more details are provided at http://occult.mit.edu/tr180plans/). ‡ The four photomultiplier tubes (PMTs) of Astrometer 3 of the Fine Guidance Sensors were used in ‘‘TRANS’’ mode. We generated the light curve by adding the signals from all four PMTs5. § The telescope at Leeward Community College (LCC) is located at longitude −1578 599 60 E, latitude 218 239 300 N, and an altitude of 10 m. The data are a continuous series of CCD frames (each 60 by 57 pixels). The light curve was generated from these frames with synthetic aperture photometry of the blended image of Triton and the star. This station recorded data through the time of the event but saw no obvious occultation, which indicates that Triton’s shadow path went somewhat north of the prediction (provided at http://occult.mit.edu/tr180.html). k The effective wavelength of the F583W filter was 583 nm; the open CCD used at LCC had an effective wavelength of 670 nm.
Table 2 Models for the Triton occultation light curve obtained with the HST Data selection All
Immersion*
Emersion*
Immer. & emer.
All
0.00 5.360.7 0.996860.0003 3.82860.034 1,456.360.6 65.360.4 1.960.3 22464‡
0.00 0.00 0.995760.0004 3.808 1,456.360.3 65.560.4 1.760.5 224
0.00 0.00 0.997460.0003 3.808 1,456.460.2 66.460.3 4.460.4 224
0.00 2.260.8 0.996660.0002 3.80860.015 1,456.360.2 67.460.2 2.960.3 224
0.00 4.960.6 0.997160.0003 3.81760.034 1,456.3 67.4 2.9 21962
3.2360.06 2.2460.04 50.460.3 0.0660.02
3.4260.04 2.3660.03 50.160.2 0.1660.01
3.3160.04 2.3060.03 50.360.2 0.1060.01
3.31 2.30 50.3 0.10
,25 3964
46 3964
46 4164
46 4064
1,504 17.8
321 8.94
321 4.22
644 6.77
...................................................................................................................................................................................................................................................................................................................................................................
Model parameters Background level Background slope (10−7 km−1) Star signal Closest approach time† Half-light radius (km) Lambda (isothermal) at half-light Thermal-gradient exponent Minimum centre distance (km)
...................................................................................................................................................................................................................................................................................................................................................................
Derived quantities at r ¼ 1;400 km (altitude ¼ 48 km) 3.2360.09 Number density (1014 cm−3) Pressure (mbar) 2.2560.06 Temperature (K) 50.660.3 0.0760.01 Temperature gradient (K km−1)
...................................................................................................................................................................................................................................................................................................................................................................
Other derived quantities Minimum altitude probed (km)§ Surface pressure (mbar)
,26 40
...................................................................................................................................................................................................................................................................................................................................................................
Fit information Degrees of freedom x2 per degree of freedomk
1,507 18.1
................................................................................................................................................................................................................................................................................................................................................................... These models are for a pure N2 atmosphere. Model parameters with error bars were fitted; those without were held constant. * The immersion data included the interval from 05:01:03 to 05:06:27 UT on 4 Nov.1997; the emersion interval was 05:10:06 to 05:15:30 UT. Immersion probed the atmosphere above −5.18 latitude and 10.48 longitude on Triton; emersion probed the atmosphere above −8.48 latitude and 206.48 longitude. † Seconds after 05:08:00 UT on 4 Nov. 1997. ‡ The minimum centre distance is primarily controlled by the amplitude of the central flash, which will be discussed elsewhere. § For the fits to all the data, the ‘minimum altitude probed’ refers to the light-curve centre. A surface radius of 1,352 km was used14,15. k x2 per degree of freedom is much greater than 1.0 for all fits, indicating that the deviations of the atmospheric structure from a power-law thermal gradient8 (rather than photon noise) are the primary source of error (note the behaviour of the residuals in the lower panels of Fig. 1).
766
Nature © Macmillan Publishers Ltd 1998
NATURE | VOL 393 | 25 JUNE 1998
8
letters to nature to efficient transfer of latent heat through the atmosphere16,17. This global frost temperature determines atmospheric pressure through vapour-pressure equilibrium; thus a frost temperature increase from 37.5 K (in 1989) to 39.3 K (in 1997) can be inferred from the observed increase in atmospheric pressure (the non-isothermal case in Fig. 2). The mechanisms that can cause a change in frost temperature (and hence surface pressure) are: (1) non-static (migrating) surfacefrost distribution; (2) changes in the optical properties of the surface frost; and (3) changing insolation on a static surface-frost distribution. (Although subsurface heat flow—geothermal or seasonal— can affect the energy balance, it is unlikely to have varied rapidly in the past decade.) Simple seasonal models of long-term frost migration, with uniform frost albedo and emissivity1,3, show monotonic long-term transfer of most of Triton’s nitrogen frost to the poles, which have the minimum seasonally averaged insolation. In most of these models, the remaining seasonal frost migrates between hemispheres in response to the seasonal insolation cycle, and all frosts should be almost exhausted from the southern hemisphere during the current extreme southern summer. This would result in a rapid decrease in atmospheric pressure, the opposite of what our 1995 and 1997 observations indicate has occurred. A substantial decrease of mean frost albedo or emissivity could account for the pressure change. For instance, model ‘‘F’’ of Spencer and Moore3, which assumes unit emissivity, can account for the atmospheric change if the mean frost Bond albedo dropped by 0.12 between 1989 and 1997. Observational18,19 and theoretical20,21 work suggests that large changes in frost optical properties may indeed occur on Triton. The frost’s total absorbed insolation may have increased, due to the increase in the southerly subsolar latitude in the past decade. We computed the change in surface pressure that would result solely from the change in subsolar latitude from August 1989 (47.88 south) to November 1997 (51.08 south), under the assumption that no volatile transport had occurred in the intervening 8 years. Five different maps of the 1989 N2-ice distribution on Triton were generated based on the albedos measured by Voyager. The emissiv100
Surface pressure (µbar)
60 50
With troposphere (Strobel et al. 1996) O
Isothermal, no troposphere
40
Voyager 2
40
39
30 O 20
38
O
15 10
1990
1992
1994
1996
1998
Surface frost temperature (K)
41
80
37
Year
Figure 2 Triton’s global warming. The surface pressure and the corresponding vapour-pressure equilibrium temperature is plotted versus year of measurement. The measurement in 1989 refers to the results of an atmospheric model12 based on several measurements made by Voyager 2. The 1995 data are from stellar occultations of Tr148A and Tr148B9, and the 1997 data refer to the present work. Each occultation datum has been plotted twice along with a corresponding leastsquares fit: assuming that the atmosphere follows the model of Strobel et al.12 (filled circles, solid line), and making the conservative assumption that the
ity of the N2 ice was taken as a free parameter in each of these frost models, and was adjusted such that the temperature of the N2 was equal to 37.5 K (corresponding to 14 mbar surface pressure) in 1989. The N2-ice thermal balance was then recomputed using the subsolar latitude appropriate for Triton in late 1997, under the assumption that the distribution of N2 ice was unchanged (albedos did change slightly, due to the illumination-angle dependence of the bolometric albedo, and the rotation of some N2-ice-covered portions of the globe into darkness). Several of these models result in pressure increases comparable to the measured increase. Thus, the observed global warming of Triton may be due to increased insolation of a M permanent south polar cap.
8
Received 12 February; accepted 14 April 1998. 1. Spencer, J. R. Nitrogen frost migration on Triton: a historical model. Geophys. Res. Lett. 17, 1769–1772 (1990). 2. Hansen, C. J. & Paige, D. A. A thermal model for the seasonal nitrogen cycle on Triton. Icarus 99, 273– 288 (1992). 3. Spencer, J. R. & Moore, J. M. The influence of thermal inertia on temperatures and frost stability on Triton. Icarus 99, 261–272 (1992). 4. McDonald, S. W. & Elliot, J. L. Triton stellar occultation candidates: 1995–1999. Astron. J. 109, 1352– 1362 (1995). 5. Holfeltz, S. T. FGS Instrument Handbook (Space Telescope Science Institute, Baltimore, 1996). 6. Elliot, J. L. et al. Occultation of e Geminorum by Mars. II. The structure and extinction of the Martian upper atmosphere. Astrophys. J. 217, 661–679 (1977). 7. Elliot, J. L., Stansberry, J. A., Olkin, C. B., Agner, M. A. & Davies, M. E. Triton’s distorted atmosphere. Science 278, 436–439 (1997). 8. Elliot, J. L. & Young, L. A. Analysis of stellar occultation data for planetary atmospheres. I. Model fitting, with application to Pluto. Astron. J. 103, 991–1015 (1992). 9. Olkin, C. B. et al. The structure of Triton’s atmosphere: Results from the entire ground-based occultation data set. Icarus 129, 178–201 (1997). 10. Tyler, G. L. et al. Voyager radio science observations of Neptune and Triton. Science 246, 1466–1473 (1989). 11. Gurrola, E. M. Interpretation of Radar Data from the Icy Galilean Satellites and Triton Thesis, Stanford Univ. (1995). 12. Strobel, D. F., Zhu, X., Summers, M. E. & Stevens, M. H. On the vertical thermal structure of Pluto’s atmosphere. Icarus 120, 266–289 (1996). 13. Krasnopolsky, V. A., Sandel, B. R., Herbert, F. & Vervack, R. J. Temperature, N2, and N density profiles of Triton’s atmosphere: observations and model. J. Geophys. Res. 98, 3065–3078 (1993). 14. Davies, M. E., Rogers, P. G. & Colvin, R. R. A control network of Triton. J. Geophys. Res. 96, 15675– 15681 (1991). 15. Marouf, E. A., Tyler, G. L., Eshleman, V. R. & Rosen, P. A. Voyager radio occultation of Triton: surface topography and radius. Bull. Am. Astron. Soc. 23, 1207 (1991). 16. Trafton, L. Large seasonal variations on Triton. Icarus 58, 312–324 (1984). 17. Ingersoll, A. P. Dynamics of Triton’s atmosphere. Nature 344, 315–317 (1990). 18. Smith, B. A. et al. Voyager 2 at Neptune: Imaging science results. Science 246, 1422–1449 (1989). 19. Buratti, B. J., Goguen, J. D., Gibson, J. & Mosher, J. Historical photometric evidence for volatile migration on Triton. Icarus 110, 303–314 (1994). 20. Eluszkiewicz, J. On the microphysical state of the surface of Triton. J. Geophys. Res. 96, 19217–19230 (1991). 21. Duxbury, N. S. & Brown, R. H. The phase composition of Triton’s polar caps. Science 261, 748–751 (1993). Acknowledgements. We thank E. Nelan and B. McArthur for help in reducing our data; the IRTF staff, the staff of the Lear Jet Observatory at NASA Ames, F. Osell, M. Kakkala, J. Kern, R. Meserole, C. Dahn and R. Stone for assistance; and D. Strobel for discussions. This work was supported, in part, by NASA, NSF, and the National Geographic Society. The NASA/ESA Hubble Space Telescope observations were supported by STScI, which is operated by Association of Universities for Research in Astronomy, Incorporated. Correspondence and requests for materials should be addressed to J.L.E. at the Department of Earth, Atmospheric, and Planetary Sciences, MIT.
Superconductivity in oxygen K. Shimizu*†, K. Suhara*, M. Ikumo*, M. I. Eremets† & K. Amaya*†‡ * Department of Material Physics, Faculty of Engineering Science, Osaka University, Toyonaka, Osaka 560-8531, Japan † CREST of Japan Science and Technology Corporation, Kawaguchi, Saitama 332-0012, Japan ‡ Advanced Science Research Center, Japan Atomic Energy Research Institute, Naka, Ibaraki 319-1195, Japan
atmosphere is isothermal below 1,400 km (open circles, dashed line). For the
.........................................................................................................................
conservative assumption, the pressure increase is 1:4 6 0:4 mbar yr 2 1 ; it is
Among the simple diatomic molecules, oxygen is of particular interest because it shows magnetism at low temperatures. Moreover, at pressures exceeding 95 GPa (,0.95 Mbar), solid molecular oxygen becomes metallic, accompanied by a structural transition1. The metallization process is characterized by an increase in optical reflectivity2, and a change in the slope of the resistance–
2:8 6 0:8 mbar yr 2 1 for the other case. In both cases, the pressure is seen to steadily increase, indicating that Triton has been undergoing a period of global warming. The distance of the points from the lines is larger than their error bars, which indicates that the warming of the surface frost may not have occurred linearly with time. NATURE | VOL 393 | 25 JUNE 1998
Nature © Macmillan Publishers Ltd 1998
767