Oct 18, 2018 - Institute of Medical Education and Research (PGIMER), Chandigarh, India; 3Department of Community Medicine, Vardhman Mahavir Medical ...
Original Article Healthc Inform Res. 2018 October;24(4):300-308. https://doi.org/10.4258/hir.2018.24.4.300 pISSN 2093-3681 • eISSN 2093-369X
Google Search Trends Predicting Disease Outbreaks: An Analysis from India Madhur Verma, MD1, Kamal Kishore, PhD2, Mukesh Kumar, MD3, Aparajita Ravi Sondh, MD4, Gaurav Aggarwal, MPH5, Soundappan Kathirvel, MD6 1 Department of Community Medicine, Kalpana Chawla Government Medical College and Hospital, Karnal, India; 2Department of Biostatistics, Post Graduate Institute of Medical Education and Research (PGIMER), Chandigarh, India; 3Department of Community Medicine, Vardhman Mahavir Medical College and Safdarjung Hospital, New Delhi, India; 4State Integrated Disease Surveillance Project (IDSP) Cell, Department of Health, Haryana, India; 5Integrated Disease Surveillance Project (IDSP), Chandigarh Administration, Chandigarh, India; 6Department of Community Medicine, School of Public Health, Post Graduate Institute of Medical Education and Research (PGIMER), Chandigarh, India
Objectives: Prompt detection is a cornerstone in the control and prevention of infectious diseases. The Integrated Disease Surveillance Project of India identifies outbreaks, but it does not exactly predict outbreaks. This study was conducted to assess temporal correlation between Google Trends and Integrated Disease Surveillance Programme (IDSP) data and to determine the feasibility of using Google Trends for the prediction of outbreaks or epidemics. Methods: The Google search queries related to malaria, dengue fever, chikungunya, and enteric fever for Chandigarh union territory and Haryana state of India in 2016 were extracted and compared with presumptive form data of the IDSP. Spearman correlation and scatter plots were used to depict the statistical relationship between the two datasets. Time trend plots were constructed to assess the correlation between Google search trends and disease notification under the IDSP. Results: Temporal correlation was observed between the IDSP reporting and Google search trends. Time series analysis of the Google Trends showed strong correlation with the IDSP data with a lag of –2 to –3 weeks for chikungunya and dengue fever in Chandigarh (r > 0.80) and Haryana (r > 0.70). Malaria and enteric fever showed a lag period of –2 to –3 weeks with moderate correlation. Conclusions: Similar results were obtained when applying the results of previous studies to specific diseases, and it is considered that many other diseases should be studied at the national and sub-national levels. Keywords: Disease Outbreaks, Communicable Diseases, Information Technology, Public Health Surveillance, Epidemiological Monitoring
Submitted: August 15, 2018 Revised: September 30, 2018 Accepted: October 18, 2018 Corresponding Author Soundappan Kathirvel, MD Department of Community Medicine, School of Public Health, Post Graduate Institute of Medical Education and Research (PGIMER), Chandigarh, India. Tel: +917087003412, E-mail: selvkathir@gmail. com (https://orcid.org/0000-0002-4839-0138) This is an Open Access article distributed under the terms of the Creative Commons Attribution Non-Commercial License (http://creativecommons.org/licenses/bync/4.0/) which permits unrestricted non-commercial use, distribution, and reproduction in any medium, provided the original work is properly cited.
ⓒ 2018 The Korean Society of Medical Informatics
I. Introduction Prompt detection is a cornerstone for the control and prevention of infectious diseases. The Integrated Disease Surveillance Programme (IDSP) of India (http://www.idsp.nic. in) was launched in November 2004 as a project and was later converted to a programme. The IDSP is a one-stop portal where almost 97% of Indian districts report disease surveillance data for 22 notifiable epidemic-prone diseases. This portal has facilities for surveillance and monitoring of disease trends and responds to outbreaks through trained rapid response teams (RRTs) [1]. The data obtained using S (syndrome), P (presumptive), and L (laboratory) forms
Google Trends Predicting Disease Outbreaks flow from bottom to top, i.e., community to state/central level. It takes at least 7 to 10 days for the central surveillance unit to recognise an outbreak through the current process of reporting. Therefore, any system that can supplement the existing system in gathering timely intelligence on infectious diseases may reduce the impact of unwarranted outbreaks. An Internet-based novel surveillance system led by Internet search behaviour of the community has recently emerged as a promising technique [2]. In the present decade, teledensity in India is rapidly increasing, and the internet has emerged as an indispensable need of people [3,4]. A large proportion of internet users go online to search for medical or healthrelated information [5]. Recent studies have also shown that the Internet is among the primary sources of information for the population actively using the Internet [6-9]. Data generated from queries fed into search engines is recorded and can be used for surveillance purposes as it is used for marketing purpose. Targeted sources include Internet-search metrics, online news stories, social network data, and blog/microblog data [2]. The application of this data for monitoring systems of interest is called ‘nowcasting’ [10]. It can estimate the magnitude of outbreaks in their prodromal stages and produce timely information. Additionally, this near real-time technique can be implemented within the scope of existing infrastructure and human resources. Therefore, this approach is becoming more relevant in the context of resource-constrained countries with already overburdened health systems. Studies from other parts of the world suggest that Google Trends can be a useful tool for disease surveillance [11,12]. It is crucial to study the application of this tool for the surveillance of communicable diseases in India, particularly those listed under the IDSP. This is first study of its kind to assess the feasibility of using Internet-based surveillance systems for the prediction of disease outbreaks in India. This study was conducted with the primary aim of evaluating the temporal correlation between Google Trends and conventional surveillance data generated for diseases reported under the IDSP in Haryana and Chandigarh, India.
II. Methods 1. Study Design A cross-sectional study design was used. 2. Study Setting 1) General setting Under the IDSP, three types of forms are to be submitted,
Vol. 24 • No. 4 • October 2018
namely 'S', 'P', and 'L' forms. The 'S' form includes suspected cases based on syndromic surveillance done by health workers at a health subcentre and its community, which covers a population of 3,000 to 5,000. The 'P' or the presumptive form is filled by medical officers of various health facilities (from primary health centres to tertiary care hospitals), including private medical practitioners, based on clinical examination. The 'P' form reports around 22 diseases. The 'L' or laboratory form is filled at laboratories (both public and private) and reports 12 types of laboratory confirmed cases. The cases identified from Monday to Sunday are reported using different forms on successive Mondays. The reporting units submit their reports to the next level every Monday. After verification and compilation, the data reaches the District Surveillance Units by Wednesday. It is further transmitted to the State Surveillance Units (SSU) at all State/UT headquarters, and finally, it is sent to the Central Surveillance Unit (CSU) in New Delhi. 2) Specific setting Haryana is one of the northern states of India. It is amongst the wealthiest states in India and has the third highest per capita income in the country. The wireless teledensity (number of telephone connections for every hundred individuals living within an area) in the state is around 117.53. Chandigarh, a union territory, is the common capital of Haryana and Punjab, and the teledensity is around 107.88 [4]. The Internet is accessible to around 36% and 52% of the population in Haryana and Chandigarh, respectively. The two study areas regularly report diseases using all three forms of the IDSP. In this study, only four major febrile illnesses (i.e., dengue, chikungunya, malaria, and enteric fever) reported in 'P' form were considered. 3) Google search trends Google is one of the most commonly used search engines, where a very high volume of queries is carried out every day. The current market share of Google among the existing search engines is around 97% [13]. Google answers queries and keeps a record of such search queries. The data is compiled to display trends automatically. The weekly trends can be accessed from Google Trends, a special open-access domain of Google (https://trends.google.com/trends/). Google Trends data is a randomly collected sample of real time (of the last 7 days) and non-real time (data from 2004 to 36 hours prior to search) Google search queries. After removal of personal information, each piece of data is categorized and tagged with a topic. Each data point is divided
www.e-hir.org
301
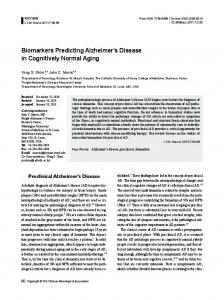
Madhur Verma et al by the total searches in a specific geographical area over a period of time to compare relative popularity. Google Trends depicts search frequency output as a normalized data series, and the resulting numbers are scaled on a range of 0 to 100 based on a topic’s proportion to all searches on all topics (Figure 1). Numbers represent search interest relative to the highest point on the graph for that time and place. A value of 100 is the peak popularity of a term. A value of 50 indicates that the term is half as popular as it was at its peak of popularity. Likewise, a score of 0 means the term was less than 1% as popular as it was at the peak. This data can be downloaded in a ‘.CSV’ format for further analysis and interpretation. Searches made by very few people, duplicate searches, and searches linked with special characters are excluded from the creation of Google Trends. 4) Google Correlate A query is searched using different forms, due to differences in education, primary language, ethnicity, pronunciations, etc. The Google search engine takes these differences into account and gives results from every possible related query. Identification of different queries or terms meant for searching a single disease has been obtained using Google Correlate. Google Correlate is another domain of Google (https:// www.google.com/trends/correlate), and it functions just like Google Trends, but in reverse. With Google Trends, a query is an input and output is a series of its frequency (over time, or area-wise). With Google Correlate, input is a data series (the target) and output is a set of queries whose frequency follows a similar pattern. When a data set (a time series, for
instance) is uploaded, Google Correlate will compute the Pearson correlation coefficient (r) between this time series and the frequency time series for every query in the Google database. The queries that Google Correlate shows are the ones with the highest correlation coefficient (i.e., closest to r = 1.0). 5) Identified search terms In our study, the similar search terms for each of the four diseases (dengue, chikungunya, malaria, and typhoid) used in study areas were obtained using Google Correlate. The top 5 search queries having maximum correlation with the main disease under the IDSP were downloaded from Google Correlate for each notifiable disease and were further used for retrieving the trend data through Google Trends. For example, the top 5 terms for dengue included dengue (r = 0.9487), dengue symptoms (r = 0.9391), prevent dengue (r = 0.9232), dengue fever (r = 0.9224), and symptoms of dengue (r = 0.9134). The top 5 terms extracted from Google Correlate that showed maximum correlation with the diseases under study are presented as a Supplementary Table S1 along with their correlation coefficients. 3. Study Period and Population Data reported in 'P' form of the IDSP on four diseases, namely, dengue, chikungunya, malaria, and enteric fever from January to December 2016 for Haryana and Chandigarh was used. For the above study period, the Google Trends data reported for Haryana and Chandigarh was used.
Interest by city ?
Query dengue
Search term
+ Compare
Geographical region Chandigarh
2016
Field of interest Health
Time of interest Interest over time ?
Web Search
Area of interest: searches, news, images
Data downloads
100 75 50 25
3 Jan 2016
302
www.e-hir.org
24 Apr 2016
14 Aug 2016
4 Dec 2016
Figure 1. �Screen shot of Google Trends website depicting the search strategy used for observing the pattern generated for the searches related to dengue in Chandigarh, 2016 (Map shows the geographical pattern of the searches made).
https://doi.org/10.4258/hir.2018.24.4.300
Google Trends Predicting Disease Outbreaks 4. Data Collection and Analysis The week-wise compiled number of cases at SSU of Haryana and Chandigarh pertaining to all four diseases was entered in Microsoft Excel 2016. Google Trends weekly search metrics for each disease were downloaded in the .CSV format. Data from both sources was then exported to RStudio (https://www.rstudio.com/) for analysis and display of febrile illnesses. Scatter plots, Spearman rank correlation, and time series analysis were applied to assess the association between the two datasets. Cross-correlation results are obtained as product-moment correlations between the two time series. The advantage of using cross-correlations is that it accounts for time dependence between two time-series variables. The time dependence between two variables is termed as lag. Lag values indicate the degree and direction of associations. A lag of –1 for assessing correlation suggests that Google Trends data has been shifted backward by one-week from the IDSP data and the opposite is true for +1. Positive correlations for lag vales of ≥1 week were considered significant. Considering the objectives of this study, a positive association between the two time-series (Google Trends data preceding the presumptive disease notification under the IDSP) verifies its suitability for use as an early warning tool. A pvalue less than 0.05 was considered statistically significant.
III. Results Table 1 shows the aggregate number of cases reported through the P-form of the IDSP for the four diseases under study. In both Haryana and Chandigarh, the maximum number of reported cases was malaria, followed by enteric fever, dengue, and chikungunya. 1. Correlation between IDSP and Google Trends Data The results of the correlational analysis between the IDSP
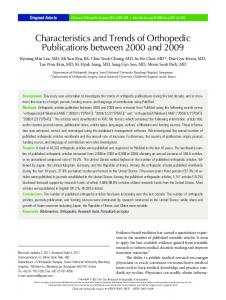
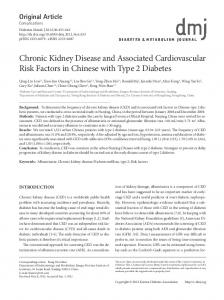
data and Google Trends are presented in Figure 2, where Figure 2A presents results for Haryana, and Figure 2B presents the results for Chandigarh. In both figures, the lower half of the matrix gives information about the spread/scatter of the data. The upper half of each matrix displays the correlation coefficient along with its statistical significance. In Haryana, the strongest correlation was observed between notified cases and search queries for chikungunya (rs = 0.82), followed by moderate correlation for malaria (rs = 0.56). Dengue showed weak positive correlation (r s = 0.40) in Haryana, whereas enteric fever had the weakest correlation (rs = 0.37). In Chandigarh, the highest correlation was observed for chikungunya (rs = 0.87) followed by dengue (rs = 0.73) as compared to very weak positive correlation for enteric fever (rs = 0.11). 2. Time Trends and Time-Series Cross-Correlations Time trend graphs for surveillance data and Google Trends data for the respective diseases for the study areas are presented in Figure 3. The time trends for both Chandigarh and Haryana showed spikes in Internet searches as seen in the Google Trends for the considered diseases before spikes in the P-form data of the IDSP. The linear association between disease surveillance and Google Trends pattern was assessed using time-series crosscorrelations as shown in Table 2. In Chandigarh, Google Trends Internet search data showed strong correlation at a lag of –2 to –3 weeks (r > 0.80) with the IDSP data for chikun gunya and dengue. Malaria and enteric fever also showed a lag of –2 to –3 weeks but with moderate correlation (0.41 < r < 0.52). Similarly, in Haryana, the maximum correlation was observed for chikungunya (>0.7) and dengue (>0.6) with lag periods of –2 to –3 weeks. A lag period of –2 to –3 weeks with moderate correlation (0.61 < r < 0.65) for malaria and enteric fever was noted. Chandigarh displayed stronger correlation for chikungunya and dengue in comparison to
Table 1. Burden of major febrile illnesses (chikungunya, dengue, malaria, and enteric fever) as per the P-form of the IDSP records of Haryana and Chandigarh in 2016 Haryana
Diseases reported under IDSP
Total number of cases
Chandigarh
Number of cases observed in a week (min–max)
Total number of cases
Number of cases observed in a week (min–max)
Chikungunya
2,195
0–957
1,063
0–151
Dengue
2,955
0–660
4,134
0–614
84,123
672–3,633
17,674
17–1,398
1,19,083
1,045–5,525
57,109
31–3,792
Enteric fever Malaria
IDSP: Integrated Disease Surveillance Programme.
Vol. 24 • No. 4 • October 2018
www.e-hir.org
303
Madhur Verma et al A
1,000
3,000
Typhoid.G
1,000 *
** 0.37
4,000
0 300 600
***
400 100
**
0.46
0.32
0
0.41
0.22
0.12
60
0.027
20 3,000
***
Typhoid.R
***
***
0.88
0.63
0.67
***
***
0.66
0.61
***
0.67
1,000 ***
Malaria.G
***
0.56
0.51
**
***
0.52
0.36
** 80
0.43
40 0
***
Malaria.R
4,000
0.65
***
***
0.66
0.68
***
0.58
1,000 Dengue.G
**
*** 80 40
***
0.63
0.40
0.49
0
600
***
Dengue.R
0.67
300
***
0.72
0 Chikungunya.G
*** 80
0.82
40 0
Chikungunya.R
400 0 20 60 100
B
0
40 80
200 800
0 500
Typhoid.G
** 0.11
0.39
40 80
2,500
0
40 80
0 300 600
***
0 50
150 100
*
0.61
0.27
0.13
0.10
60
0.027
20 **
Typhoid.R
800
0.20
***
***
0.59
0.51
0.42
***
0.57
***
0.57
200 Malaria.G
***
***
0.53
0.46
**
*
0.39
0.29
*
100 60
0.29
20 ***
Malaria.R
2,500
0.53
***
***
0.56
0.47
* 0.29
500 Dengue.G
***
***
0.73
0.72
*** 80 40
0.64
0
600
***
Dengue.R
0.79
300
***
0.78
0 Chikungunya.G
*** 80
0.87
0
150
Chikungunya.R
50 0 20 60 100
304
40
www.e-hir.org
20 60 100
0
40 80
0
40 80
Figure 2. �Correlational plots between Google Trends and IDSP (Integrated Disease Surveillance Programme) data for Haryana (A) and Chandigarh (B) in 2016.
https://doi.org/10.4258/hir.2018.24.4.300
Google Trends Predicting Disease Outbreaks 160
Number of cases as per IDSP records
140 120
Chikungunya IDSP data Search results
100 80 60 40 20
Number of weeks
600 500
Dengue IDSP data Search results
400 300 200 100
F
700 600 500
Dengue IDSP data Search results
400 300 200 100 0
Number of weeks
5,000 4,000 3,000 2,000 1,000
G
4,000 3,500
Malaria
3,000 2,500 2,000 1,500 1,000 500 0
1 3 5 7 9 11 13 15 17 19 21 23 25 27 29 31 33 35 37 39 41 43 45 47 49 51 53 55
0
100 90 80 70 60 50 40 30 20 10 0
Relative search results as per Google Trends
Number of cases as per IDSP records
Malaria
IDSP data Search results
Number of weeks
3,000 2,500 2,000 1,500 1,000 500 1 3 5 7 9 11 13 15 17 19 21 23 25 27 29 31 33 35 37 39 41 43 45 47 49 51 53 55
0
H Relative search results as per Google Trends
100 90 80 70 60 50 40 30 20 10 0
Enteric fever
IDSP data Search results 1,600
Enteric fever
1,400 1,200 1,000 800 600 400 200 0 1 3 5 7 9 11 13 15 17 19 21 23 25 27 29 31 33 35 37 39 41 43 45 47 49 51 53
4,000 3,500
Number of cases as per IDSP records
Number of weeks
IDSP data Search results
Number of cases as per IDSP records
D
100 90 80 70 60 50 40 30 20 10 0
1 3 5 7 9 11 13 15 17 19 21 23 25 27 29 31 33 35 37 39 41 43 45 47 49 51 53
6,000
Number of weeks
Number of cases as per IDSP records
C
IDSP data Search results
100 90 80 70 60 50 40 30 20 10 0
1 3 5 7 9 11 13 15 17 19 21 23 25 27 29 31 33 35 37 39 41 43 45 47 49 51 53
1 3 5 7 9 11 13 15 17 19 21 23 25 27 29 31 33 35 37 39 41 43 45 47 49 51 53 55
0
100 90 80 70 60 50 40 30 20 10 0
Number of weeks
100 90 80 70 60 50 40 30 20 10 0
Number of cases as per IDSP records
700
Relative search results as per Google Trends
Number of cases as per IDSP records
B
100 90 80 70 60 50 40 30 20 10 0
1 3 5 7 9 11 13 15 17 19 21 23 25 27 29 31 33 35 37 39 41 43 45 47 49 51 53
0
1 3 5 7 9 11 13 15 17 19 21 23 25 27 29 31 33 35 37 39 41 43 45 47 49 51 53 55
Number of cases as per IDSP records
E
Relative search results as per Google Trends
IDSP data Search results
100 90 80 70 60 50 40 30 20 10 0
Relative search results as per Google Trends
Chikungunya
Relative search results as per Google trends
900 800 700 600 500 400 300 200 100 0
Relative search results as per Google Trends
1,000
Relative search results as per Google trends
A
Number of weeks
Number of weeks
Figure 3. L� ine diagram depicting Google Trends and IDSP data for major febrile illnesses for Haryana (left) and Chandigarh (right) in 2016.
Haryana, but the reverse was true for malaria and enteric fever. Cross-correlation analysis also showed that the number of searches for the considered diseases decreased gradually over time in a uniform pattern (Table 2).
Vol. 24 • No. 4 • October 2018
IV. Discussion The Google Trends-based prediction system has the capability to identify disease outbreaks well in advance for the studied diseases with modest reliability [14]. Real-time disease monitoring may alert respective health departments and other stakeholders in the early phases of a disease outbreak, www.e-hir.org
305
Madhur Verma et al Table 2. Time series bi-directional cross-correlation coefficients for 4 weeks displaying relationships between Google Trends records of Haryana and Chandigarh in 2016 District
Chandigarh
Haryana
Disease
Lag in weeks -4
-3
-2
-1
0
+1
+2
+3
+4
Chikungunya
0.735
0.792
0.832
0.931
0.861
0.684
0.563
0.460
0.361
Dengue
0.762
0.836
0.877
0.890
0.867
0.764
0.605
0.481
0.332
Malaria
0.286
0.344
0.482
0.516
0.609
0.539
0.423
0.419
0.331
Enteric fever
0.411
0.463
0.380
0.366
0.216
0.243
0.127
-0.007
-0.202
Chikungunya
0.590
0.782
0.716
0.547
0.372
0.315
0.225
0.178
0.066
Dengue
0.563
0.618
0.733
0.654
0.472
0.365
0.324
0.204
0.152
Malaria
0.470
0.647
0.614
0.535
0.599
0.663
0.523
0.434
0.320
Enteric fever
0.488
0.605
0.566
0.504
0.458
0.304
0.234
0.155
0.122
empowering them to initiate adequate response measures, including case finding, disease containment, and treatment accessibility, thus limiting the disease burden [15,16]. The application of disease surveillance has been tried in both communicable and non-communicable diseases in developing countries, with robust reporting systems and quick response teams. Bragazzi [11] reported the feasibility of webbased surveillance system for monitoring non-suicidal selfinjuries. Since the launch of Google Flu Trends in 2009, much needed attention and respect has been devoted to the new evolving branch of ‘digital epidemiology’ [17,18]. The investigation and application of internet-based surveillance is widely recognised [19,20]. To date, it has not been used for any surveillance system in India. This is the first study reported from India that assessed the potential use of internet search trends for disease surveillance. The use of 'P' form data represents cases notified from both public and private health facilities and provides a holistic picture of the disease burden in the community on a weekly basis. The present study demonstrates that an Internet-searchbased surveillance system has the potential to effectively contribute to the control of various diseases. However, correlations alone should not be viewed as definitive evidence of impending outbreaks or epidemics as the analyses performed were univariate and exploratory in nature. The results of this study should be interpreted with caution keeping in mind the biological plausibility and natural history of the disease concerned. The Internet-based surveillance system collects data and provides necessary information, instantly circumventing traditional administrative structures that impede information flow [10]. The epidemic curves for chikungunya and dengue in Haryana and Chandigarh are associated with the rainy season in Northern India and showed sharp peaks during 306
www.e-hir.org
2016. Malaria also showed a similar trend, with a broader curve than those of chikungunya and dengue. Enteric fever, on the other hand, is transmitted via the faecal–oral route or urine–oral route; thus, cases were reported throughout the year, with a peak around the rainy season. Also, the IDSP reporting of all the febrile illnesses included in the study showed good positive correlation with each other, and this adds to the robustness of the IDSP data retrieved from the Pforms. The lag period used in this study was –4 to +4 weeks. This range was nearly two times the incubation period of any febrile illness studied. The negative lag period will help to understand the approximate time of primary case occurrence and further analysis to look for biologically plausible associations. The observed maximum correlation 2 to 3 weeks before the actual outbreak provides sufficient time to deploy RRTs for timely action. Similarly, the positive lag period may support the surveillance team to ensure that the outbreak is over. The spike of Internet searches, for example, for ‘chikungunya’ may be attributed to various factors. It may be due to increased number of cases in the community and increased attention given by the social media. Media can be a source of bias, as it may seriously affect the trending of searches for a particular disease [21,22]. In northern India, increase in the chikungunya cases was first reported from the national capital and adjoining areas which was highlighted by the media, and later they were reported from Haryana and Chandigarh during the study period. Thus, it may be possible that this increased the interest of people in the adjoining states about chikungunya, which may be responsible for a sudden surge in Google Trends. The studied febrile illnesses are common in India. Therefore, whenever a patient with fever visits any health facility, https://doi.org/10.4258/hir.2018.24.4.300
Google Trends Predicting Disease Outbreaks a battery of lab investigations are conducted depending on the previous experience from the community. This list also serves as a driver for the searches related to the diseases. However, these two processes, i.e., Internet searches as per the Google Trends and the actual number of cases in community and their notification may not be mutually exclusive. The study had following limitations. The study used only the 'P' form data of malaria, enteric fever, chikungunya, and dengue. This study did not use the 'S' form data because the form did not differentiate the fever cases reported. Similarly, 'L' form data also was not included in the analysis because case reporting is usually delayed for laboratory confirmation. There is also a need to test and establish the correlation of Internet search data with other diseases and other forms of IDSP data. Similarly, there is a need to demonstrate the applicability of this internet search data to be used by all states. Second, in a country like India with varied culture, we have a variety of languages that are used as primary languages by the mobile and Internet users. However, only English was used as the main language to retrieve the search results, which may have caused underreporting of cases and thus errors in the correlation. Third, the established correlation may not help to identify the exact place of an outbreak or epidemic at intrastate and intra-district level because the Google Trends does not provide data at these levels. Fourth, this study assessed the performance of only one term that had the maximum correlation with the febrile illnesses included in the study. Other search terms may also add to the burden of the searches related to the particular disease. Despite this, we observed a positive correlation with all the febrile illnesses, though the strength varied. Finally, seasonal differencing could not be applied to cross correlations to remove cyclic seasonal trends as IDSP data was available for only 1 year. We recommend the use of an Internet-based surveillance system to supplement the existing IDSP system. Such a system can be tested at the field level for taking timely action, especially for epidemic prone diseases. Future studies should focus on forecasting epidemics and outbreaks for various other diseases by using mathematical modelling that adjusts for other parameters. The search trends from social media platforms can also be assessed further along with Google or other portal site trends for disease surveillance. In conclusion, similar results were obtained when applying the results of previous studies to specific diseases, and it is considered that many other diseases should be studied at national and sub-national levels. Internet-based surveillance systems have broader applicability for the surveillance
Vol. 24 • No. 4 • October 2018
of infectious diseases than is currently recognised, especially in resource-constrained areas. Despite the huge potential of this approach, this method cannot be used as an alternative to traditional surveillance systems and can only be used to supplement the existing system. However, the results of this study suggest that internet-based surveillance systems have potential role in forecasting of emerging infectious disease events.
Conflict of Interest No potential conflict of interest relevant to this article was reported.
Supplementary Materials Supplementary materials can be found via http://doi. org/10.4258/hir.2018.24.4.300. Table S1. Top 5 terms extracted from Google Correlate for each of the four febrile illnesses.
References 1. Ministry of Health & Family Welfare, Government of India. Integrated Disease Surveillance Programme [Internet]. New Delhi: Ministry of Health & Family Welfare; c2018 [cited at 2018 Jul 4]. Available from: http:// www.idsp.nic.in/. 2. Milinovich GJ, Williams GM, Clements AC, Hu W. Internet-based surveillance systems for monitoring emerging infectious diseases. Lancet Infect Dis 2014;14(2):160-8. 3. Hoffman DL, Novak TP, Venkatesh A. Has the Internet become indispensable? Commun ACM 2004;47(7):3742. 4. Telecom Regulatory Authority of India. The Indian Telecom Services Performance Indicators, April–June 2017 [Internet]. New Delhi: Telecom Regulatory Authority of India; 2017 [cited at 2018 Jul 4]. Available from: http:// trai.gov.in/sites/default/files/Performance_Indicator_ Reports_28092017.pdf. 5. Hellawell GO, Turner KJ, Le Monnier KJ, Brewster SF. Urology and the Internet: an evaluation of internet use by urology patients and of information available on urological topics. BJU Int 2000;86(3):191-4. 6. Tonsaker T, Bartlett G, Trpkov C. Health information on the Internet: goldmine or minefield? Can Fam Physician 2014;60(5):407-8.
www.e-hir.org
307
Madhur Verma et al 7. Hesse BW, Moser RP, Rutten LJ. Surveys of physicians and electronic health information. N Engl J Med 2010;362(9):859-60. 8. Diaz JA, Griffith RA, Ng JJ, Reinert SE, Friedmann PD, Moulton AW. Patients' use of the Internet for medical information. J Gen Intern Med 2002;17(3):180-5. 9. Moretti FA, Oliveira VE, Silva EM. Access to health information on the Internet: a public health issue? Rev Assoc Med Bras (1992) 2012;58(6):650-8. 10. Choi H, Varian H. Predicting the present with Google Trends. Econ Rec 2012;88:2-9. 11. Bragazzi NL. A Google Trends-based approach for monitoring NSSI. Psychol Res Behav Manag 2013;7:1-8. 12. Kang M, Zhong H, He J, Rutherford S, Yang F. Using Google Trends for influenza surveillance in South China. PLoS One 2013;8(1):e55205. 13. StatCounter Global Stats. Search Engine Market Share India [Internet]. Dublin: StatCounter; 2017 [cited at 2018 Sep 27]. Available from: http://gs.statcounter.com/ search-engine-market-share/all/india/2016. 14. Cervellin G, Comelli I, Lippi G. Is Google Trends a reliable tool for digital epidemiology? Insights from different clinical settings. J Epidemiol Glob Health 2017;7(3):185-9. 15. Longini IM Jr, Nizam A, Xu S, Ungchusak K, Hanshaoworakul W, Cummings DA, et al. Containing pandemic influenza at the source. Science 2005;309(5737):1083-7.
308
www.e-hir.org
16. Ferguson NM, Cummings DA, Cauchemez S, Fraser C, Riley S, Meeyai A, et al. Strategies for containing an emerging influenza pandemic in Southeast Asia. Nature 2005;437(7056):209-14. 17. Ginsberg J, Mohebbi MH, Patel RS, Brammer L, Smolinski MS, Brilliant L. Detecting influenza epidemics using search engine query data. Nature 2009;457(7232):10124. 18. Polgreen PM, Chen Y, Pennock DM, Nelson FD. Using internet searches for influenza surveillance. Clin Infect Dis 2008;47(11):1443-8. 19. Samaras L, Garcia-Barriocanal E, Sicilia MA. Syndromic surveillance models using web data: the case of scarlet fever in the UK. Inform Health Soc Care 2012;37(2):106-24. 20. Desai R, Hall AJ, Lopman BA, Shimshoni Y, Rennick M, Efron N, et al. Norovirus disease surveillance using Google Internet query share data. Clin Infect Dis 2012;55(8):e75-8. 21. Ortiz JR, Zhou H, Shay DK, Neuzil KM, Fowlkes AL, Goss CH. Monitoring influenza activity in the United States: a comparison of traditional surveillance systems with Google Flu Trends. PLoS One 2011;6(4):e18687. 22. Hulth A, Rydevik G. Web query-based surveillance in Sweden during the influenza A(H1N1)2009 pandemic, April 2009 to February 2010. Euro Surveill 2011;16(18):19856.
https://doi.org/10.4258/hir.2018.24.4.300
Supplementary Materials Healthc Inform Res. 2018 October;24(4):300-308. https://doi.org/10.4258/hir.2018.24.4.300 pISSN 2093-3681 • eISSN 2093-369X
Table S1. Top 5 terms extracted from Google Correlate for each of the four febrile illnesses Term
Dengue
Chikungunya
Malaria
Enteric fever
Correlation coefficient
Dangu
0.9487
Dengue symptoms
0.9391
Prevent dengue
0.9232
Dengue fever
0.9223
Symptoms of dengue
0.9134
What is chikungunya
0.8687
Chikungunya symptoms
0.8424
Chikungunya treatment
0.8320
Treatment for chikungunya
0.8132
Chikungunya fever
0.8124
Essays
0.8783
Festivals
0.8731
Importance
0.8723
Importance of
0.8708
History
0.8631
Platelet count
0.7954
Viral fever
0.7812
Platelets
0.7781
Fever
0.7618
Typhoid fever
0.7528