Graph cut segmentation with a statistical shape model in cardiac MRI
,
´ ome ˆ Damien Grosgeorge1, Caroline Petitjean1, Su Ruan1, Jer Caudron2, Jean-Nicolas Dacher2 1LITIS EA 4108, Universite ´ de Rouen
22 bd Gambetta, 76183 Rouen Cedex, France 2INSERM U1096, Universite ´ de Rouen, France and Department of Radiology, University Hospital of Rouen 1 rue de Germont, 76031 Rouen Cedex, France
Abstract Segmenting the right ventricle (RV) in magnetic resonance (MR) images: a difficult task. ▸ A shape prior is incorporated into the graph cut framework in order to guide the segmentation process. ▸ Evaluation on 16 cardiac MRI datasets provided by the MICCAI 2012 Right Ventricle Segmentation Challenge (RVSC). ▸
Context Overview of the method
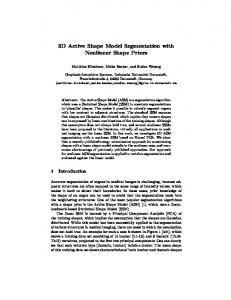
MR images with RV ground truth RV segmentation: a challenging application [2]
Fuzziness of the cavity borders ▸ Presence of trabeculations (wall irregularities) ▸ Complex crescent shape of the RV ▸
Red: Endocardium, Green: Epicardium ED: End Diastole, ES: End Systole P03-0060 (ED)
P03-0140 (ED)
P01-0188 (ES)
⇒ Shape prior to guide the segmentation process: Principal Component Analysis (PCA) with Signed Distance Function (SDF) representation. ⇒ Graph cut framework: global optimization, very computationally efficient in 2D.
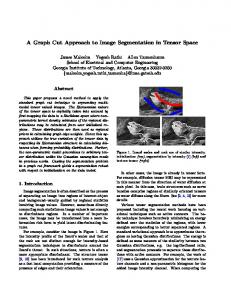
Shape Model Construction
Graph cut based segmentation with shape prior
PCA on shape variations
Original graph cut (as proposed in [1])
N binary shapes, aligned on a reference (from two anatomical landmarks on the interventricular septum) ▸ φi the N signed distance map to the contour of binary shapes N 1 ¯ ▸ Mean shape : Φ = N ∑i=1 φi , reset to the SDF to the contour ▸ PCA : k eigenshapes Φi , k eigenvalues λi
▸
▸
Image I considered as a graph G =< V, E > ▸ Each pair of nodes (p, q) ∈ E in a neighborhood N is connected by a segment called n-link: ▸
(Ip − Iq )2 1 Bp,q ∝ exp (− ). 2 2σ dist(p, q) ▸
√ ¯ Φ + 2 λ1Φ1
¯ Φ
√ ¯ Φ − 2 λ2Φ2
¯ Φ
▸
p Rp (B)
q Rq (B)
S (object)
(6)
E(C) = ∑ Rp (ωp ) + λ ∑ Bp,q .δ(ωp ≠ ωq )
Highly deformed shape instances for each axis: √ ¯ ± 3 λi Φi , for all i = 1..k γ± = Φ
p∈V
(1)
i
Areas of variation of the mean shape for eigenmode i: ¯ ⊕ H(γ −), for all i = 1..k ¯ ⊕ H(γ +) + H(Φ) Γi (p) = H(Φ) i i ¯ ▸ Superimposition to the distance values of the mean shape Φ:
▸
▸
(2)
¯ for all i = 1..k PMi (p) = Γi (p) ⋅ Φ, ▸
Bp,q
The energy of a cut C is defined by:
Our aim : isolate area of variations of the mean shape ▸
Rq (O)
weighted by a region term Rp : Rp (ω) = − ln Pr (Ip ∣ω)
√ ¯ Φ + 2 λ2Φ2
Rp (O)
(5)
Each node p ∈ V is connected to the terminal nodes S and T by a segment called t-link: ▸
√ ¯ Φ − 2 λ1Φ1
weighted by a boundary term Bp,q :
T (background)
(3)
p,q∈N
The optimal segmentation: cut of minimal energy (mincut-maxflow algorithm).
Integration of the prior map
Registration of the model: user is required to point out two landmarks. ▸ We suggest that the shape prior contribute to weighting both t-links and n-links ▸
▸
T-links:
⎧ ⎪ − ln(1 − Pr (O∣Ip )) if PS (p) ≠ 0 ⎪ ⎪ ⎪ ⎪ S ¯ Rp (O) = ⎨0 if PS (p) = 0 and H(Φ(p)) = 1 (Background) ⎪ ⎪ ⎪ ¯ ⎪ +∞ if PS (p) = 0 and H(Φ(p)) = 0 (Object) ⎪ ⎩ ▸ N-links: PS (p) + PS (q) S Bp,q = 2
Single distance map by averaging: 1 k PS (p) = ∑ PMi (p) k i=1
(4)
▸
p,q∈N H(γ2+)
Γ2
PM1
PM2
PS
(8)
(9)
The final energy of a cut C for a graph integrating a shape prior is then: S E(C) = λ ∑ (Bp,q + γBp,q ).δ(ωp ≠ ωq ) + ∑ RpS (ωp )
H(γ2−)
(7)
(10)
p∈V
Epicardium: derived of endocardium by morphological dilatation.
Experimental results RVSC database ▸
Training set: ▸
▸
Test1 set: ▸
▸
16 patients, 243 images.
Pt 29 ED
Table: Mean (± standard deviation) Dice Metric (DM) and Hausdorf Distance (HD, in mm) between automatic and manual delineation by an expert of the contour, on Test1 set.
16 unseen patients, 248 images.
Shape model construction and parameterization 6 slice models created at ED, 5 at ES. ▸ Parameters: σ = 10, λ = 100 (ED and ES) ▸ γ = 0.001 for ED and γ = 0.005 for ES ▸ Dilatation: disk of radius 4. ▸ Computation time : 45 seconds by patient. ▸
Conclusion and perspectives An original prior term is integrated into the graph cut cost function. ▸ If results are satisfying for basal and mid-ventricular slices, room for improvement is left in apical slices. ▸ Future works will consist in making the registration step automatic. ▸
http://www.litislab.eu
Pt 29 ES
Endocardium DM HD Epicardium DM HD
End-diastole 0.83 ± 0.15 9.48 ± 5.41 0.86 ± 0.10 9.84 ± 5.49
End-systole 0.69 ± 0.23 10.56 ± 5.54 0.78 ± 0.15 11.09 ± 5.34
References [1] Y. Boykov and M. Jolly. Interactive graph cuts for optimal boundary and region segmentation of objects in n-d images. International Conference on Computer Vision, 1:105–113, July 2001. [2] D. Grosgeorge, C. Petitjean, J. Caudron, J. Fares, and J.-N. Dacher. Automatic cardiac ventricle segmentation in MR images: a validation study. International Journal of Computer Assisted Radiology and Surgery, 6(5):573–581, 2011.
[email protected]