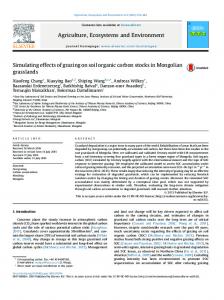
Jan 20, 2004 - days in two of the three years, whereas, grazing in July re- duced CO2 flux ... 2001, Manley and others 1995, Schuman and others. 1999, 2001 ...
DOI: 10.1007/s00267-003-9154-x
Grazing Effects on Carbon Dynamics in the Northern Mixed-Grass Prairie MARSHALL R. HAFERKAMP M. D. MACNEIL USDA-Agricultural Research Service Fort Keogh Livestock and Range Research Laboratory 243 Fort Keogh Road Miles City, Montana 59301, USA ABSTRACT / The role of rangelands in the regulation of atmospheric CO2 concentrations is a critical issue in global climate change research. Rangelands are complex ecosystems that occupy about 50% of the land area in the world and USA. We studied the effects of seasonal grazing on CO2 flux on small plots located on a silty range site in the northern mixed-grass prairie with an Eapa fine loam soil. Treatments were no grazing or short-duration intensive grazing during mid-May or midJuly in 1996, 1997, and 1998. Data were collected from mid-
Rangelands (including grasslands, shrublands, deserts, and tundra) occupy about 50% of the world’s land area and contain more than 33% of aboveground and belowground terrestrial C reserves (Allen-Diaz 1996). Follett and others (2001) suggest that, given the size of the C pool in US rangeland, a better understanding is needed of the current and potential effects of management practices on C storage. Since 1990 researchers have been actively studying the potential role of grasslands for C sequestration with research in seeded pastures (Franzluebbers and others 2000); tall grass prairie (Verma and others 1989, 1992, Kim and others 1992, Ham and Knapp 1998, Mielnick and Dugas 2000, Dugas and others 1999, Rice and Owensby 2001, Suyker and Verma 2001); mixed-grass prairie (Dormaar and others 1995, Frank and others 1995, 2001, Manley and others 1995, Schuman and others 1999, 2001, 2002, LeCain and others 2000, Meyers 2001, Frank and Dugas 2001, Sims and Bradford 2001, Frank 2002, Reeder and Schuman 2002; shortgrass KEY WORDS: Northern Great Plains; Grazing; Carbon sequestration; Grasslands; CO2 flux; Montana The paper is a contribution from the USDA-ARS and Montana Agricultural Experiment Station, Miles City, Montana, USA. Mention of any trade name or proprietary product does not constitute a guarantee or warranty by the authors or USDA-ARS nor does it imply the approval of these products to the exclusion of others. Published online January 20, 2004.
April to mid-October at about 30-day intervals to estimate standing crop, leaf area, soil organic C, root mass to a 30-cm soil depth, and diurnal variation of CO2 flux and soil respiration (at 08:00, 12:00, 16:00, and 24:00 hr) in closed chambers. Uptake of CO2 was greatest during spring and early summer, peak periods of precipitation and green biomass. Grazing removed an average of about 70% of the green standing crop with a subsequent reduction in CO2 uptake of 175% in May and 109% in July. Grazing in May reduced CO2 uptake for 30 days in two of the three years, whereas, grazing in July reduced CO2 flux only in 1998. Residual effects of grazing, however, declined in late summer and autumn with the onset of plant maturation. The potential C sink in the mixed-grass prairie of the Northern Great Plains appears to be small and will vary through time with intensity and timing of grazing as it interacts with climatic conditions.
steppe (Reeder and Schuman 2002; Reeder and others this issue); and sagebrush steppe (Angell and others 2001). Inherent in all rangeland ecosystems are both diurnal and seasonal variation in CO2 flux, with the direction of flux controlled by the balance between photosynthesis and respiration during the growing and dormant seasons (Norman and others 1992, Bremer and others 1998, Dugas and others 1999, Mielnick and Dugas 2000, Frank and Dugas 2001, Frank 2002). Rangelands are also resource limited, particularly for nitrogen and water (Willms and Jefferson 1993). Severity, duration, and timing of grazing and drought in relation to plant phenology are important in determining the status of prairie vegetation as a C source or sink. Inconsistent responses of soil organic C to grazing have been reported on rangelands. Many of these differences appear to be the result of variations in climate, soil properties, landscape position, plant community composition, grazing management practices, soil organic matter, depth of soil profile, and depth of the soil profile sampled (Johnston and others 1971, Smoliak and others 1972, Dormaar and others 1977, Bauer and others 1987, Milchunas and Lauenroth 1993, Frank and others 1995, Manley and others 1995, Biondini and Manske 1996, Derner and others 1997, Povirk and others 2001, Schuman and others 1999, Wienhold and others 2001, Reeder and Schuman 2002). Some have suggested that grazing leads to an increase in soil microbial biomass that is related to changes in root exu-
Environmental Management Vol. 33, Supplement 1, pp. S462–S474
©
2004 Springer-Verlag New York, LLC
Grazing Effects on CO2 in Mixed-Grass Prairie
S463
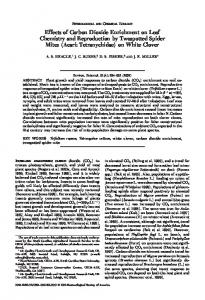
Figure 1. Climate diagram developed for a 96-year period for Miles City, Montana. Mean monthly temperature (°C) and precipitation (mm) indicate mesic spring, early summer, and autumn periods interrupted by late summer and early autumn drought (stippling). Winter precipitation occurs as snow. Months shaded in black have average minimum temperatures ⬍ 0°C. Those with diagonal lines have absolute minimum temperatures ⬍ 0°C. Figure follows standard form of Walter (1985).
dation patterns following defoliation (Guitian and Bardgett 2000, Hamilton and Frank 2001). Grazing can also affect the redistribution of C within the system (Reeder and Schuman 2002) through changes in rate of recycling aboveground plant C into the soil, changes in plant species composition, and the rate of incorporation of litter into the soil (Naeth and others 1991). Excluding grazing allows litter to accumulate, which may reduce rate of C incorporation into the soil. Litter accumulation will also affect soil temperature (LeCain and others 2000) and soil water content, which in turn will affect soil organic matter decomposition rates, and C and N cycling (Reeder and others 2001). Lateral and vertical spatial variability on rangelands associated with soil organic matter, soil aggregation, and other resources poses challenges and opportunities for managers trying to enhance C storage (Bird and others 2001). The objective of this research was to determine the impact of short-duration intensive grazing in May or July on CO2 flux and C dynamics in the Northern Great Plains. We hypothesized that intensive short-duration grazing in May or July would have no effect on CO2 flux or C dynamics relative to environmental stress.
Study Area Research was conducted at the Fort Keogh Livestock and Range Research Laboratory (46°22’N 105°5'W) near Miles City, Montana, USA. Regional topography varies from rolling hills to broken badlands with small intersecting ephemeral streams flowing into rivers in broad, nearly level valleys. The area is representative of
the semi arid mixed-grass prairie of the Northern Great Plains. Indigenous vegetation on the 22,500-ha research station is a grama–needlegrass–wheatgrass (Bouteloua–Stipa–Agropyron) mix (Ku¨chler 1964). Annual precipitation averages 343 mm, with about 60% received from April through September (Figure 1). Daily temperatures range from ⬎ 38°C during summer to below ⫺40°C during winter. The average frost-free growing season is 150 days. This 1-hectare study site was a nearly level silty range site, which is a common range site in the Northern Great Plains. Soil was an Eapa (fine-loamy, mixed, superactive, frigid Aridic Argiustoll). Vegetation was dominated by a C3 annual grass, Japanese brome (B. japonicus Thunb.); C3 perennial grasses, prairie Junegrass [Koeleria macrantha (Ledeb.) J.A.], needleandthread [Hesperostipa comata (Trin. & Rupr.) Barkworth], and western wheatgrass [Pascopyrum smithii (Rydb.) A. Love]; a C3 sedge, thread-leaf sedge (Carex filifolia Nutt.); C4 perennial grasses, blue grama [Bouteloua gracilis (Willd. ex Kunth) Lag. ex Griffiths] and red threeawn [Aristida purpurea Nutt. var. longiseta (Steud.) Vasey]; a succulent, prickly pear (Opuntia spp.); halfshrubs, fringed sagewort (Artemisia frigida Willd), common sagewort (A. campestris L.), and phlox (Phlox hoodii Richards); and forbs, western salsify (Tragopogon dubius Scop.) and hairy goldaster [Heterotheca villosa (Pursh.) Shinners var. villosa]. Perennial cool-season grasses and sedges generally made up greater than 60% of the green standing crop during April through July each year. Perennial warm-season grasses and sageworts be-
S464
M. R. Haferkamp and M. D. MacNeil
gin to increase in dominance during July. Elevation at the study site was 719 m.
Methods Environment Long-term and current precipitation and temperature records were obtained from a weather station located at Frank Wiley Field, Miles City, MT, 12.5 km from the study site. Precipitation data for 1996 and early 1997 were also obtained from a study area located 6 km from the study site. These supplemental data were used because malfunction of the nearby Bowen Ratio system prevented continuous precipitation measurements during 1996 and 1997. Precipitation was monitored on site during the remainder of 1997 and 1998. Soil water was estimated during measurement periods on an adjacent site using gravimetric methods for the 0to 8-cm depth and a dielectric soil water probe for the 15-, 30-, 60-, and 90-cm depths. Gravimetric samples were oven-dried at 105°C for 48 hr. Treatments Three treatments were imposed on replicated plots. Treatments were: no grazing (control), intensively grazed by sheep in mid-May (May), and intensively grazed by sheep in mid-July (July). Treatments were arranged in a randomized complete-block design with four blocks of three treatment plots (15 m ⫻ 15 m). The study was conducted during 1996, 1997, and 1998. Sheep (28 –35 head) were used to impose grazing treatments. Grazing events were normally about 3 hr in duration beginning early morning (05:00 to 08:00 hr). The desired level of grazing (60 –70% removal) was generally attained in one grazing bout, and only rarely were the plots grazed again the next morning. Two of the four blocks were grazed during the same week, thus requiring two weeks to complete the treatment application in May and July each year. Measurements Seasonal and diurnal effects of grazing and environment were measured from mid-April to mid-October (weather permitting) at about 30-day intervals each year. As with the application of grazing treatments, two blocks were sampled during the same week during each 30-day period. CO2 flux. Net CO2 flux between the soil surface and atmosphere was measured over one randomly located 1-m2 sampling quadrat per replication. The 1-m2 area was located at the beginning of the study in early spring of 1996, and the same plot was used each year. The plot
was delineated by pressing a 1-m2 angle iron frame into the soil. At 08:00, 12:00, 16:00, and 24:00 hr on designated days, we sampled CO2 flux with a portable CO2 measurement system (LI-COR 6200, LI-COR Inc., Lincoln, NE, USA) connected to a 1-m3 chamber placed over each plot (Angell and Svejcar 1999, Angell and others 2001). We also measured CO2 flux at 12:00 hr on control and grazed plots the day of grazing. The chamber was constructed and operated according to methods presented in Angell and Svejcar (1999). An air-tight seal was maintained by setting the chamber on a gasket of closed cell foam resting on the angle iron frame and sealing any gaps around the metal angle iron frame by tamping loose soil. Before obtaining a measurement, the chamber was placed on the foam gasket, the chamber fan was turned on, and ventilation doors were left open to maintain near-ambient conditions within the chamber until data logging was initiated. To obtain a measurement, the doors were closed and after a 30-sec mixing interval, the measurement period began, and CO2 concentration was measured for three 20-sec or two 30-sec periods. During measurements of CO2 concentration, we monitored leaf and air temperature with thermocouples and photosynthetic active solar radiation (PAR) with a quantum sensor. Measurement periods were brief to minimize chamber effects, and the chamber was covered when moving between plots to reduce heating. Net CO2 fluxes above the canopy (positive flux values indicating movement of CO2 from the atmosphere to the terrestrial surface) were calculated from rate of change in CO2 concentration. Soil CO2 flux was measured just before the large chamber measurements using a 1-liter LI-COR 6000-09 soil respiration chamber (Norman and others 1992) connected to a LI-COR 6200 infrared gas analyzer. Measurements were taken in two soil respiration rings (polyvinyl chloride 10.4-cm diameter, 5-cm depth) per replication. These were located near the 1-m2 frames. After CO2 was drawn below ambient concentrations within the chamber, the CO2 concentration was measured for four 15-sec or three 20-sec periods. Rings were pressed into the soil in a new location each spring to a depth of 2.5 cm, and then left in place during the entire April–October sampling period. Emerging seedlings were plucked from inside each ring at least 48 hr before taking measurements. Soil temperature was measured using a temperature probe placed 8 cm deep at the time of soil flux measurements. Soil samples were collected to a 4-cm depth from each replication for gravimetric soil water determinations on each sample date. Samples were oven-dried at 105°C for 48 hr.
Grazing Effects on CO2 in Mixed-Grass Prairie
Aboveground biomass. On each sample date, standing crop was clipped to ground level and sorted by plant species, within one 0.25-m2 quadrat (50 ⫻ 50 cm) randomly located within each replication. Litter was also collected from this same plot. The standing crop sample was refrigerated and sorted into live, current dead (i.e., this year’s senesced biomass), and dead (i.e., previous year’s senesced biomass) tissue. Leaf area of the green standing crop was then determined with a LI-COR 3050-A leaf area meter for determination of leaf area index (LAI). Biomass samples were dried at 60°C for 48 hr and then ground before laboratory analyses. During 1996, quadrats were located randomly throughout the entire study area prior to grazing. Sampling began in the individual May and July plots after grazing. The assumption was made that these samples collected before grazing were representative of the biomass in plots. During 1997 and 1998, samples were collected within each plot on all dates before and after grazing. Belowground biomass. On each sample date two soil cores were obtained (4.2-cm diameter, 30-cm depth) within each 0.25-m2 frame to estimate root mass. Additional soil cores were obtained to a 60-cm depth within each 0.25-m2 frame in July each year to determine bulk density, root biomass, and soil C. Bulk density was determined by the core method (Blake 1965). Roots were washed from each soil core using a hydropneumatic root washer, dried at 60°C for 48 hr, and ground prior to laboratory analysis. Soil samples for C determinations were stored in a freezer until they were processed by removal of roots from soil by gentle grinding and sieving of samples through a 1-mm screen. Small root particles passing through the screen were removed by hand. Laboratory analyses of soils and biomass. All samples were removed from storage and dried at 60°C for 16 hr before they were weighed for chemical analyses. Soil and plant samples were analyzed for total C with a Carlo/Erba automated dry combustion analyzer, and inorganic soil C was determined by the modified pressure-calcimeter method (Sherrod and others 2002). Root samples were ashed, and weights corrected for organic matter content. Soil C values were corrected for bulk density. Net primary production of total C was determined for aboveground biomass by summing increases in C in live and current dead biomass. Data Summary and Analysis The fundamental design of the experiment was a randomized complete block with repeated observations collected through time. Data were analyzed using analysis of variance models in which block, treatment, and
S465
block ⫻ treatment interactions comprised the whole plot. The significance of treatment effects was tested using the mean square of the block ⫻ treatment interaction. The subplot varied according to the sampling strategy for the particular dependent variable, as described previously. In general, the subplot contained a set of nested effects describing the time course of data collection (e.g., year, date within year, time within date within year for those data collected more than once per day), each of which interacted with the treatment effects.
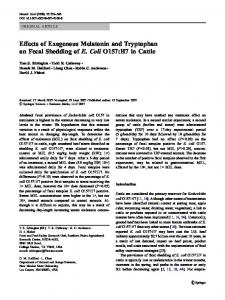
Results Impact of Environment The amount and distribution of precipitation varied during the three years of our study (Figure 2). Precipitation was above average at Frank Wiley Airfield during January, March, May, October, and November in 1996; April and July in 1997; and March, June, July, August, and October in 1998. Although May 1996 was very wet, precipitation was below average thereafter until the following October. Precipitation was below average in May and June in 1997 and from August 1997 through February 1998. April and May were dry in 1998, but rainfall was above average the remainder of the summer. Average monthly temperatures were near normal during all three years of our study. Soil water varied by sample date (Figure 3) in response to wet and dry periods. Impact of Grazing Grazing immediately reduced leaf area index (LAI), aboveground biomass, and net CO2 flux. Leaf area index was reduced from 0.29 ⫾ 0.03 before grazing to 0.06 ⫾ 0.03 after grazing. Live aboveground biomass was reduced (P ⬍ 0.05) with grazing in all three years whether grazing occurred in May or July (Table 1). Current dead was similar before and after grazing in May but was reduced by grazing in July. Dead biomass was reduced (P ⬍ 0.05) from 26 ⫾ 2 to 9 ⫾ 2 g/m2 averaged across years. Grazing did not affect (P ⬎ 0.05) litter. CO2 flux measurements, taken before and after grazing events on both May and July plots and the corresponding control plot at 12:00 hr, revealed variation among years (Table 2). There were, however, no significant (P ⬎ 0.05) differences in CO2 flux between control plots and May or July treatment plots before grazing, and no differences between control plots measured before or after grazing (Table 2). In contrast, CO2 flux was significantly reduced by grazing in May and July.
S466
M. R. Haferkamp and M. D. MacNeil
Figure 2. A combination of precipitation data recorded at the Frank Wiley Airfield (National Oceanic and Atmospheric Administration 1996 –1998) located about 12.5 km from the study site, on another study area located 6 km from the study site, and onsite during 1996, 1997, and 1998. Horizontal lines above the precipitation bars denote time of sampling, and asterisks denote time of grazing.
Seasonal and Diurnal CO2 Fluxes Net. April fluxes, measured at 12:00 and 24:00 hr in 1998, averaged 0.8 ⫾ 0.2 and ⫺0.6 ⫾ 0.2 m CO2/m2/ sec, with no differences among treatments. In May 1996, fluxes that were measured only at 12:00 hr were greater than fluxes measured at 12:00 hr in 1997 or 1998 (Figure 4). Grazing in May reduced (P ⬍ 0.05) CO2 fluxes for at least 30 days in 1996 and 1998, but not in 1997. Grazing in July only reduced (P ⬍ 0.05) CO2 flux for at least 30 days in 1998. Fluxes were only greater in grazed than control plots in July 1997. Seasonal fluxes were generally greatest in May and June, intermediate in July, and near or below zero in August,
September, and October. Diurnal fluxes (Figure 5) were generally greatest at 08:00 hr, intermediate at 12:00 and 16:00 hr, and least at 24:00 hr. The greatest difference in diurnal measurements occurred during May, June, and July, whereas diurnal measurements were similar during August, September, and October. Soil. Seasonal soil flux varied significantly with treatment ⫻ date-within-year (P ⬍ 0.05) and time-withindate and year (P ⬍ 0.05). April fluxes at 12:00 and 24:00 hr in 1998 averaged ⫺0.9 ⫾ 0.1 and ⫺0.6 ⫾ 0.1 m CO2/m2/sec, with no differences among treatments. Some treatment differences occurred during May, June, and July, when soil flux was less on grazed than nongrazed plots in June and July 1997 and 1998. Although the differences were significant (P ⬍ 0.05), they were small, averaging ⫺2.6 vs ⫺2.2 m CO2/m2/ sec in June 1997, ⫺2.8 vs ⫺2.6 m CO2/m2/sec in July 1997, and ⫺1.6 vs ⫺1.4 m CO2/m2/sec in both June and July 1998. Variation among times was related to season of the year (Figure 6). During spring and autumn, highest rates were generally during the warmer periods at 12:00 and 16:00 hours, but during summer no clear trends were found. The significant (P ⬍ 0.05) date-within-year interaction accounted for 67% of the total sum of squares. Respiration was generally greatest in June and July. Although the relationships between soil flux and soil temperature and soil water were significant (P ⬍ 0.05), less than 20% of the variation was explained by either variable. Leaf area index (LAI). Average LAI was reduced (P ⬍ 0.05) from 0.18 ⫾ 0.01 with no grazing to 0.14 ⫾ 0.01 with May grazing and 0.12 ⫾ 0.01 with July grazing. Leaf area index varied significantly (P ⬍ 0.05) among dates within years (Figure 7). Maximum values were generally recorded during May, June, and July. During 1998, however, LAI in June was significantly lower than in May or July. Carbon Dynamics Aboveground C. The live component of ungrazed and July-grazed treatments peaked in May, June, and July (Figure 8). Current dead (CDED) increased as the growing season progressed in nongrazed and Maygrazed plots, but increased early and then decreased abruptly after grazing in July. The dead component was greatest early in the season, then gradually decreased through time without grazing, and decreased abruptly after grazing events in May or July. Grazing reduced the live component for at least 60 days after grazing in May and 90 days in July (Figure 8). Compared to nongrazed control plots, grazing in May and July reduced current dead for the remainder of the season. July-grazed plots contained less dead than con-
Grazing Effects on CO2 in Mixed-Grass Prairie
S467
Figure 3. Percent soil water as measured on adjacent Bowen Ratio plots. Soil water for the 0 to 8-cm depth was determined gravimetrically from cores. Soil water at the 15, 30, and 60 cm depths was determined with a dielectric soil water probe. Sampling occurred on selected dates in 1996, 1997, and 1998.
trol plots for the entire season, whereas May grazing reduced this component from June onward. Litter was similar (P ⬎ 0.05) in the nongrazed control (15.5 ⫾ 0.6 g C/m2) and May-grazed plots (14.8 ⫾ 0.6 g C/m2), but was reduced with grazing in July (12.7 ⫾ 0.6 g C/m2). In general, the amount of aboveground C was greatest in 1996 and least in 1997 or 1998, particularly for live biomass and current dead (Figure 9). No clear trends were found for the dead component, but litter was consistently less in 1998. Net primary production of C was similar (P ⬎ 0.05) among grazing treatments for the May to October period (49.6 ⫾ 4.3 g C/m2). Significantly more carbon was, however, produced in 1996
(66.8 ⫾ 4.3 g C/m2) than in 1997 (46.2 ⫾ 4.3 g C/m2) or 1998 (35.8 ⫾ 4.3 g C/m2). Belowground C. Due to missing data it was not possible to examine the effects of belowground C in 1996. As a result, only the data for 1997–1998 root C and soil organic C were analyzed. Both the date ⫻ treatmentwithin-year interaction and date ⫻ depth-within-year interaction were significant (P ⬍ 0.05) for root C biomass. Treatment differences occurred in only 20% of the comparisons for the three years, and no consistent trends were detected in these differences. When means for the date ⫻ depth-within-year interaction were compared, we found greater root C biomass in the 0- to
S468
M. R. Haferkamp and M. D. MacNeil
Table 1. Immediate effect of grazing in May or July on aboveground biomass Biomass component (g/m2) at time of measurement relative to grazing year/treatment date Livea 1996 1997 1998 SE Current deadb 1996 May July 1997 May July 1998 May July SE
Before
After
71 44 41 3
17 14 9
7 39
4 17
4 17
1 5
6 10 2
2 4
a
Least-square means and standard error (SE) for the significant timing/year interaction for the live biomass component. b Least square means and standard error (SE) for the significant timing/ treatment/year interaction for the current dead biomass component.
Table 2. Immediate effects of grazing in May and July on CO2 fluxa (CO2m m2/sec) atTime of measurement relative to grazing Year/treatment date
Before
After
1996 Controlb May 1997 Control May 1998 Control May SE Controlc July SE
3.0 3.5 1.5 1.2 2.0 2.2 0.4 0.6 0.6 0.2
3.2 ⫺0.9 1.2 ⫺0.4 1.1 ⫺0.3 0.7 ⫺1.0 1.0
a
Measurements taken at 12:00 hr the day before and the day of grazing in May or July. b Least-square means and standard error (SE) for the significant year/ treatment/timing interaction for the control and May grazing treatment. c Least square means and standard errors (SE) for the treatment/ timing interaction for the control and July grazing treatment.
10-cm depth compared to the 10- to 30-cm depth in 65% of the comparisons. The average root C content for 1997–1998 was 313 ⫾ 9 g C/m2 in the 0- to 10-cm depth and 156 ⫾ 9 g C/m2 in the 10- to 30-cm depth.
Figure 4. Least-square means for CO2 flux ⫾ standard errors as affected by the significant treatment/date-within-year (P ⬍ 0.05) interaction. May 1996 value is only for 12:00 hr.
Soil organic C measured from soil samples collected in July each year was not affected (P ⬎ 0.05) by grazing treatment. The depth ⫻ year interaction was significant (P ⬍ 0.05) (Table 3).
Discussion and Conclusions Short-duration intensive grazing reduced potential CO2 uptake in this study. Maximum CO2 flux generally coincided with periods of maximum green biomass, which agrees with findings of others (Kim and others 1992, Dugas and others 1999, LeCain and others 2000, Sims and Bradford 2001, Frank 2002, this issue). In our study, as in others, green biomass and CO2 flux increased in early spring, peaked in early to mid-summer, and decreased during mid-summer to early autumn. Soil flux in this study followed similar patterns to those
Grazing Effects on CO2 in Mixed-Grass Prairie
S469
Figure 5. Least-square means for CO2 flux ⫾ standard errors as affected by the significant time-within-date and -year (P ⬍ 0.05) interaction.
found by Frank and others (2002), where soil CO2 flux peaked with biomass production in late June and July in central North Dakota. Whether due to defoliation or senescence, once green biomass is reduced, CO2 uptake is at least temporarily reduced. This reduction may be mitigated, however, if grazing enhances photosynthesis by increasing the amount of light reaching green tissue and occurs when soil water and temperature are optimum for plant regrowth (LeCain and others 2000). Timing and intensity of defoliation are also important in determining response to grazing. Haferkamp and others (1998) found western wheatgrass regrowth measured in July was twofold greater for plots clipped in May compared to plots clipped in June. They found that clipping or grazing at an earlier date allowed plants to replace leaf area sooner, whereas delayed clipping gave plants a longer period of uninterrupted growth. This is similar to responses observed in the current study. As LAI increased, photosynthesis and growth rate presumably increased, if environmental conditions were conducive for growth. The magnitude of the reduction in CO2 flux from grazing in May or July varied seasonally and annually, due to variation in solar radiation, temperature, and precipitation. The importance of annual climate can not be ignored, since it may be as important as grazing for limiting CO2 sequestration in this region of the Northern Great Plains. Many have shown a reduction of CO2 flux with the onset of drought (Kim and others 1992, Verma and others 1992, Meyers 2001, Sims and Bradford 2001, Suyker and Verma 2001, Frank 2002, this issue). Environment may override the effects of grazing, as occurred on most dates in 1997 and after August of most years of this study. The potential period for growth is relatively short in the Northern Great Plains, as reported by Frank and others (2002) and
shown in Figure 1. Most herbaceous plants in this area grow during late spring and early summer, and normally an average of 91% of the year’s perennial coolseason grass production and 76% of the perennial warm-season grass production is completed by the end of June (R. K. Heitschmidt unpublished file data, USDA-ARS, Miles City, MT, USA). The region also frequently experiences periods of below average precipitation (Hurtt 1951, Reed and Peterson 1961, Olson and others 1985, Haferkamp and others 1993, Heitschmidt and others 1995, 1999). The impact of environmental stress on reducing plant growth in this region cannot be overemphasized and has been documented by others (Sims and Singh 1978, Olson and others 1985, White 1985, Sala and others 1988, Frank 1988). Data from this study do not totally agree with data collected on grazed and ungrazed rangelands in other locations in the mixed-grass prairie (LeCain and others 2000) and shortgrass steppe (LeCain and others 2002). They found that early season CO2 exchange rates were generally greater in grazed pastures than in nongrazed areas. In contrast, we generally found a sharp decline in CO2 uptake with grazing. They did not report sharp declines in CO2 uptake with continuous season-long grazing as we observed with intensive short-duration grazing. The most likely reasons for differences among locations are variations in season and severity of defoliation and availability of soil water for potential regrowth. Heavy stocking rates reported by LeCain and others (2000, 2002) only removed about 50% of the forage during the growing season on the mixed-grass prairie and 60% of the forage on the shortgrass steppe. With these grazing regimes half the leaf blades were never grazed and many were grazed only once. Precip-
S470
M. R. Haferkamp and M. D. MacNeil
Figure 7. Least-square means for leaf area index (LAI) ⫾ standard errors as affected by the significant date-within-year (P ⬍ 0.05) interaction.
Figure 6. Least-square means for soil CO2 flux ⫾ standard errors as affected by the significant time within date and year (P ⬍ 0.05) interaction.
itation at the Colorado sites of LeCain and others (2002) was at or above normal for the study period. Environmental differences and their effects on biomass production were the likely causes for the smaller CO2 fluxes in this study than at other locations in the mixed-grass prairie (LeCain and others 2000, Sims and Bradford 2001, Frank 2002, this issue), shortgrass steppe (LeCain and others 2002), and tall-grass prairie (Kim and others 1992, Verma and others 1992, Dugas and others 1999, Suyker and Verma 2001). We cannot make direct comparisons because our measurements were made in a closed chamber at several points in
time, whereas data from other studies, except LeCain and others (2000, 2002), were from continuous measurements derived from Bowen Ratio energy balance or eddy correlation methods. We assumed that pressure within the large chamber allows total respiration from the soil surface. Based on Norman and others (1992), this assumption may be flawed. Although the magnitude of any single value may be biased upward by our assumption, all treatments were treated similarly. Angell and others (2001) also cautioned that chamber effects may be increased when temperatures are high and soil water is low, thus increasing plant stress to a level that causes stomata to close. Although this may have been a factor during measurements at 12:00 and 16:00 hr during July and August, treatments were contrasted in similar conditions. We did not detect greater amounts of soil C due to grazing during the three-year study, as has been re-
Grazing Effects on CO2 in Mixed-Grass Prairie
Figure 8. Least- square means for C standing crop as affected by the significant treatment/date (P ⬍ 0.05) interaction for aboveground biomass components. CDED refers to current year’s senesced material and dead refers to previous year’s senesced material. Litter was the only component for which the interaction was not significant.
ported by others comparing areas that had been grazed for longer periods of time (Frank and others 1995, Manley and others 1995, Schuman and others 2001, Reeder and Schuman 2002). As discussed earlier many differences reported on the impact of grazing on soil C appear to be the result of variations in climate, soil properties, landscape position, plant community composition, and grazing management practices, as well as variations in soil organic matter, and depth of soil profile. In the short-time span of three years in our study, reduced green, current dead, and dead biomass as well as reduced CO2 flux after intensive short-duration grazing suggest that intensive grazing could lead to reduced soil C after many years. Fluxes at 12:00 hr decreased to below zero with grazing in either May or
S471
Figure 9. Least-square means for C standing crop as affected by the significant date-within-year (P ⬍ 0.05) interaction for aboveground biomass components. CDED refers to current year’s senesced material and dead refers to previous year’s senesced material.
Table 3.
Effects of year and depth on soil organic Ca (C g/m2)
Depth (cm)
1997
1998
0 –10 10 –30 30 – 60 SE
1419 1805 1620 93
1155 1824 2068
a
Least-square means and standard error (SE) for the significant year/ depth interaction.
July. Average fluxes for the May-grazed plots tended to rebound during the next 30 – 60 days, whereas fluxes from July-grazed plots remained near or below zero. Although we found reductions in various vegetation components due to grazing, we did not measure C inputs from livestock defecation, which could increase C content in soils through time. Baron and others (2002) found that adding estimated fecal C to the
S472
M. R. Haferkamp and M. D. MacNeil
residual soil C significantly increased total C on a grazed pasture of meadow bromegrass (Bromus riparius Rhem). Grazing may reduce or cause little change in C sequestration in the mixed-grass prairie of the Northern Great Plains. The exact influence on CO2 flux will depend upon the degree of defoliation and its interaction with climatic variables, particularly temperature and precipitation. Based on findings from this and other studies (Frank 2002, this issue), the potential C sink in the mixed-grass prairie of the Northern Great Plains appears to be small and will vary in time with intensity and timing of grazing and its interaction with climate.
Acknowledgements The authors express appreciation to personnel of USDA-ARS and Montana Agricultural Experiment Station located at Fort Keogh Livestock and Range Research Laboratory for their diligent efforts in helping carry out this research. We also appreciate constructive reviews of earlier versions of this manuscript provided by Drs. William Dugas, Rodney Heitschmidt, Douglas Johnson, Jean Reeder, and Lance Vermeire.
References Allen-Diaz, B. 1996. Rangelands in a changing climate: impacts, adaptations, and mitigation. Pages 131–158. in R. T. Watson, M. C. Zinyowera, and R. H. Moss. Eds, Climate change 1995, impacts, adaptations, and mitigation of climate change: scientific–technical analyses. Cambridge University Press, Cambridge, UK. Angell, R., and T. Svejcar. 1999. A chamber design for measuring net CO2 exchange on rangeland. Journal of Range Management 52:27–31. Angell, R. F., T. Svejcar, J. Bates, N. Z. Saliendra, and D. A. Johnson. 2001. Bowen ratio and closed chamber carbon dioxide flux measurements over sagebrush steppe vegetation. Agricultural and Forest Meteorology 108:153–161.
mitigate the greenhouse effect. Lewis Publishers, Boca Raton,Florida. Blake, G. R. 1965. Bulk density. Pages 374 –390. in C. A. Black, D. D. Evans, J. L. White, L. E. Ensminger, and F. E. Clark. Eds, Methods of soil analysis, agronomy number 9, part 1. American Society of Agronomy, Madison, WI. Bremer, D. J., J. M. Ham, C. E. Owensby, and A. K. Knapp. 1998. Responses of soil respiration to clipping and grazing in a tallgrass prairie. Journal of Environmental Quality 27:1539 –1548. Derner, J. D., D. D. Briske, and T. W. Boutton. 1997. Does grazing mediate soil carbon and nitrogen accumulation beneath C4, perennial grasses along an environmental gradient?. Plant and Soil 191:147–156. Dormaar, J. F., A. Johnston, and S. Smoliak. 1977. Seasonal variation in chemical characteristics of soil organic matter of grazed and ungrazed mixed prairie and fescue grassland. Journal of Range Management 30:195–198. Dormaar, J. F., M. A. Naeth, W. D. Willms, and D. S. Chanasyk. 1995. Effect of native prairie, crested wheatgrass [Agropyron cristatum (L.) Gaertn.] and Russian wildrye (Elymus junceus Fisch.) on soil chemical properties. Journal of Range Management 48:258 –263. Dugas, W. A., M. L. Heuer, and H. S. Mayeux. 1999. Carbon dioxide fluxes over bermuda grass, native prairie, and sorghum. Agricultural and Forest Meteorology 93:121–139. Follett, R. F., J. M. Kimble, and R. Lal. 2001. The potential of U.S. grazing lands to sequester soil carbon. Pages 401– 430. in R. F. Follett, J. M. Kimble, and R. Lal. Eds, The potential of U.S. grazing lands to sequester carbon and mitigate the greenhouse effect. Lewis Publishers, Boca Raton, Florida. Frank, A. B. 1988. Physiological and morphological responses of forage grasses. Pages 16 –20. in R. S. White, and R. E. Short. Eds, Achieving efficient use of rangeland resources. Papers presented at Fort Keogh research symposium, September 1987. Montana State University Agricultural Experiment Station, Bozeman, MT and Fort Keogh Livestock and Range Research Laboratory, Miles City, MT. Frank, A. B. 2002. Carbon dioxide fluxes over a grazed prairie and seeded pasture in the Northern Great Plains. Environmental Pollution 116:397– 403. Frank, A. B., and W. A. Dugas. 2001. Carbon dioxide fluxes over a northern, semiarid, mixed-grass prairie. Agricultural and Forest Meteorology 108:317–326.
Baron, V. S., E. Mapfumo, A. C. Dick, M. A. Naeth, E. K. Okine, and D. S. Chanasyk. 2002. Grazing intensity impacts on pasture carbon and nitrogen. Journal of Range Management 55:535–541.
Frank, A. B., D. L. Tanaka, L. Hofmann, and R. F. Follett. 1995. Soil carbon and nitrogen of Northern Great Plains grasslands as influenced by long-term grazing. Journal of Range Management 48:470 – 474.
Bauer, A., C. V. Cole, and A. L. Black. 1987. Soil property comparisons in virgin grasslands between grazed and nongrazed management systems. Soil Science Society American Journal 51:176 –182.
Frank, A. B., P. L. Sims, J. A. Bradford, P. C. Mielnick, W. A. Dugas, and H. S. Mayeux. 2001. Carbon dioxide fluxes over three Great Plains grasslands. Pages 167–187. in R. F. Follett, J. M. Kimble, and R. Lal. Eds, The potential of U.S. grazing lands to sequester carbon and mitigate the greenhouse effect. Lewis Publishers, Boca Raton, Florida.
Biondini, M. E., and L. Manske. 1996. Grazing frequency and ecosystem processes in a northern mixed prairie, USA. Ecological Applications 6:239 –256. Bird, S. B., J. E. Herrick, and M. Wander. 2001. Exploiting heterogeneity of soil organic matter in rangelands. Pages 121–138. in R. F. Follett, J. M. Kimble, and R. Lal. Eds, The potential of U.S. grazing lands to sequester carbon and
Frank, A. B., M. A. Liebig, and J. D. Hanson. 2002. Soil carbon dioxide fluxes in northern semiarid grasslands. Soil Biology and Biochemistry 34:1235–1241. Franzluebbers, A. J., J. A. Stuedemann, H. H. Schomberg, and S. R. Wilkinson. 2000. Soil organic C and N pools under
Grazing Effects on CO2 in Mixed-Grass Prairie
S473
long-term pasture management in the Southern Piedmont USA. Soil Biology and Biochemistry 32:469 – 478.
effects of grazing on vegetation and soils over a global range of environments. Ecological Monographs 63:327–366.
Guitian, R., and R. D. Bardgett. 2000. Plant and soil microbial responses to defoliation in temperate semi-natural grassland. Plant and Soil 220:271–277.
Naeth, M. A., A. W. Bailey, D. S. Chanasyk, and D. J. Pluth. 1991. Water holding capacity of litter and soil organic matter in mixed prairie and fescue grassland ecosystems of Alberta. Journal of Range Management 44:13–17.
Haferkamp, M. R., J. D. Volesky, M. M. Borman, R. K. Heitschmidt, and P. O. Currie. 1993. Effects of mechanical treatments and climatic factors on the productivity of Northern Great Plains rangelands. Journal of Range Management 46:346 –350.
National Oceanic and Atmospheric Administration. ⬙1996 – 1998.⬙ Climatological data annual summary, Montana. 99 – 101:13. National Climatic Data Center, Asheville, North Carolina.
Haferkamp, M. R., R. K. Heitschmidt, and M. G. Karl. 1998. Clipping and Japanese brome reduce western wheatgrass standing crop. Journal of Range Management 51:692– 698.
Norman, J. M., R. Garcia, and S. B. Verma. 1992. Soil surface CO2 fluxes and the carbon budget of a grassland. Journal of Geophysical Research 97:18, 845–18, 853.
Ham, J. M., and A. K. Knapp. 1998. Fluxes of CO2, water vapor, and energy from a prairie ecosystem during the seasonal transition from carbon sink to carbon source. Agricultural and Forest Meteorology 89:1–14.
Olson, K. C., R. S. White, and W. B. Sindelar. 1985. Response of vegetation of the Northern Great Plains to precipitation amount and grazing intensity. Journal of Range Management 38:357–361.
Hamilton, E. W.III, and D. A. Frank. 2001. Can plants stimulate soil microbes and their own nutrient supply? Evidence from a grazing tolerant grass. Ecology 82:2397–2402. Heitschmidt, R. K., E. E. Grings, M. R. Haferkamp, and M. G. Karl. 1995. Herbage dynamics on 2 Northern Great Plains range sites. Journal of Range Management 48:211–217.
Povirk, K. L., J. M. Welker, and G. F. Vance. 2001. Carbon sequestration in Arctic and Alpine tundra and mountain meadow ecosystems. Pages 189 –228. in R. F. Follett, J. M. Kimble, and R. Lal. Eds, The potential of U.S. grazing lands to sequester carbon and mitigate the greenhouse effect. Lewis Publishers, Boca Raton, Florida.
Heitschmidt, R. K., M. R. Haferkamp, M. G. Karl, and A. L. Hild. 1999. Drought and grazing: I. Effects on quantity of forage produced. Journal of Range Management 52:440 – 446.
Reed, M. J., and Peterson, R. A. 1961. Vegetation, soil, and cattle responses to grazing on Northern Great Plains Range. USDA Tech. Bull. No. 1252.
Hurtt, L. C. 1951. Managing Northern Great Plains ranges to minimize the effects of drought. United States Department of Agriculture Circular 865.
Reeder, J. D., and G. E. Schuman. 2002. Influence of livestock grazing on C sequestration in semi-arid mixed-grass and short-grass rangelands. Environmental Pollution 116:457– 463.
Johnston, A., J. F. Dormaar, and S. Smoliak. 1971. Long-term grazing effects on fescue grassland soils. Journal of Range Management 24:185–188.
Reeder, J. D., C. D. Franks, and D. G. Milchunas. 2001. Root biomass and microbial processes. Pages 139 –166. in R. F. Follett, J. M. Kimble, and R. Lal. Eds, The potential of U.S. grazing lands to sequester carbon and mitigate the greenhouse effect. Lewis Publishers, Boca Raton, Florida.
Kim, J., S. B. Verma, and R. J. Clement. 1992. Carbon dioxide budget in a temperate grassland ecosystem. Journal of Geophysical Research 97:6057– 6063. Ku¨chler, A. W. 1964. Potential natural vegetation of the conterminous United States. American Geographic Society special publication 36. American Geographic Society, New York. LeCain, D. R., J. A. Morgan, G. E. Schuman, J. D. Reeder, and R. H. Hart. 2000. Carbon exchange rates in grazed and ungrazed pastures of Wyoming. Journal of Range Management 53:199 –206. LeCain, D. L., J. A. Morgan, G. E. Schuman, J. D. Reeder, and R. H. Hart. 2002. Carbon exchange rates and species composition of grazed and ungrazed pastures in the shortgrass steppe of Colorado. Agriculture, Ecosystems and Environment 93:421– 435. Manley, J. T., G. E. Schuman, J. D. Reeder, and R. H. Hart. 1995. Rangeland soil carbon and nitrogen responses to grazing. Journal of Soil and Water Conservation 50:294 –298. Meyers, T. P. 2001. A comparison of summertime water and CO2 fluxes over rangeland for well watered and drought conditions. Agricultural and Forest Meteorology 106:205–214. Mielnick, P. C., and W. A. Dugas. 2000. Soil CO2 flux in a tallgrass prairie. Soil Biology and Biochemistry 32:221–228. Milchunas, D. G., and W. K. Lauenroth. 1993. Quantitative
Rice, C. W., and C. E. Owensby. 2001. The effects of fire and grazing on soil carbon in rangelands. Pages 323–342. in R. F. Follett, J. M. Kimble, and R. Lal. Eds, The potential of U.S. grazing lands to sequester carbon and mitigate the greenhouse effect. Lewis Publishers, Boca Raton, Florida. Sala, O. E., W. J. Parton, L. A. Joyce, and W. K. Lauenroth. 1988. Primary production of the central grassland region of the United States. Ecology 69:40 – 45. Schuman, G. E., H. H. Janzen, and J. E. Herrick. 2002. Soil carbon dynamics and potential carbon sequestration by rangelands. Environmental Pollution 116:391–396. Schuman, G. E., LeCain, D. R., Reeder, J. D., and Morgan, J. A. 2001. Carbon dynamics and sequestration of a mixedgrass prairie as influenced by grazing. Pages 67–75 in SSSA Special Publication No. 57, Soil Science Society of America, Madison, Wisconsin. Schuman, G. E., J. D. Reeder, J. T. Manley, R. H. Hart, and W. A. Manley. 1999. Impact of grazing management on the carbon and nitrogen balance of a mixed-grass rangeland. Ecological Applications 9:65–71. Sherrod, L. A., G. Dunn, G. A. Peterson, and R. L. Kolberg. 2002. Inorganic carbon analysis by modified pressure-calcimeter method. Soil Science Society of America Journal 66:299 –305.
S474
M. R. Haferkamp and M. D. MacNeil
Sims, P. L., and J. A. Bradford. 2001. Carbon dioxide fluxes in a southern plains prairie. Agricultural and Forest Meteorology 109:117–134.
water vapor, and carbon dioxide exchange at a centrally located prairie site during FIFE. Journal of Geophysical Research 97:18, 629 –18, 639.
Sims, P. L., and J. S. Singh. 1978. The structure and function of ten western North American grasslands. III. Net primary production, turnover and efficiencies of energy capture and water use. Journal of Ecology 66:573–597.
Walter, H. 1985. Vegetation of the earth and ecological systems of the geobiosphere 3rd, revised and enlarged edition. Translated from the fifth, revised German edition by O. Muise. Springer-Verlag, New York.
Smoliak, S., J. F. Dormaar, and A. Johnston. 1972. Long-term grazing effects on Stipa-Bouteloua prairie soils. Journal of Range Management 25:246 –250.
White, L. M. 1985. Stand age, precipitation, and temperature effects on forage yield. Journal of Range Management 38:39 – 43.
Suyker, A. E., and S. B. Verma. 2001. Year-round observations of the net ecosystem exchange of carbon dioxide in a native tallgrass prairie. Global Change Biology 7:279 –289.
Wienhold, B. J., J. R. Hendrickson, and J. F. Karn. 2001. Pasture management influences on soil properties in the Northern Great Plains. Journal of Soil and Water Conservation 56:27–34.
Verma, S. B., J. Kim, and R. J. Clement. 1989. Carbon dioxide, water vapor, and sensible heat fluxes over a tallgrass prairie. Boundary Area Meteorology 46:53– 67. Verma, S. B., J. Kim, and R. J. Clement. 1992. Momentum,
Willms, W. D., and P. G. Jefferson. 1993. Production characteristics of the mixed prairie: constraints and potential. Canadian Journal of Animal Science 73:765–778.