ECOSYSTEMS
Ecosystems (2002) 5: 217–231 DOI: 10.1007/s10021-001-0067-3
© 2002 Springer-Verlag
ORIGINAL ARTICLES
Greater Soil Carbon Sequestration under Nitrogen-fixing Trees Compared with Eucalyptus Species Sigrid C. Resh,1* Dan Binkley,1,2 and John A. Parrotta3 1 Department of Forest Sciences, Colorado State University, Fort Collins, Colorado 80523, USA; 2Graduate Degree Program in Ecology and Natural Resource Ecology Laboratory, Colorado State University, Fort Collins, Colorado 80523, USA; and 3United States Department of Agriculture–Forest Service, International Institute of Tropical Forestry, P.O. Box 25,000, Rio Piedras, Puerto Rico 00928, USA
ABSTRACT Forests with nitrogen-fixing trees (N–fixers) typically accumulate more carbon (C) in soils than similar forests without N–fixing trees. This difference may develop from fundamentally different processes, with either greater accumulation of recently fixed C or reduced decomposition of older soil C. We compared the soil C pools under N–fixers with Eucalyptus (non–N–fixers) at four tropical sites: two sites on Andisol soils in Hawaii and two sites on Vertisol and Entisol soils in Puerto Rico. Using stable carbon isotope techniques, we tracked the loss of the old soil organic C from the previous C4 land use (SOC4) and the gain of new soil organic C from the C3, N–fixer, and non–N–fixer plantations (SOC3). Soils beneath N–fixing trees sequestered 0.11 ⫾ 0.07 kg m⫺2 y⫺1 (mean ⫾ one standard
error) of total soil organic carbon (SOCT) compared with no change under Eucalyptus (0.00 ⫾ 0.07 kg m⫺2 y⫺1; P ⫽ 0.02). About 55% of the greater SOCT sequestration under the N–fixers resulted from greater retention of old SOC4, and 45% resulted from greater accretion of new SOC3. Soil N accretion under the N–fixers explained 62% of the variability of the greater retention of old SOC4 under the N–fixers. The greater retention of older soil C under N–fixing trees is a novel finding and may be important for strategies that use reforestation or afforestation to offset C emissions.
INTRODUCTION
in atmospheric carbon dioxide (CO2) (Schlesinger 1990, 1999; Nadelhoffer and others 1999). Deforestation may contribute to the loss of soil C by changing the balance between biomass production and decomposition. Tropical deforestation may be a net source of 0.2 ⫻ 1015 g C y⫺1, with up to 25% coming from soils (Houghton 1994, 2000). Intensive cultivation can also decrease soil C, contributing to terrestrial net fluxes of C to the atmosphere and decreased net primary productivity (Burke and others 1989; Johnson 1992). Some land-use practices (such as low-tillage, legumebased, or manure application agriculture) can increase soil C storage relative to conventional agri-
Key words: carbon accretion; carbon retention; carbon sequestration; Eucalyptus; Hawaii; isotopes; nitrogen-fixing trees; Puerto Rico; soil organic carbon.
Soils store 1.5 ⫻ 1018 g of organic carbon (C) globally—about twice as much C as is found in the atmosphere and three times the quantity contained in terrestrial vegetation (Schlesinger 1997). Soil organic C is intricately linked to the cycling of soil nutrients that influence ecosystem productivity (Van Cleve and Powers 1995). Thus, changes in this huge pool of C could mitigate or exacerbate the rise Received 12 March 2001; accepted 5 October 2001. *Corresponding author; present address: 3342A Kauhana Place, Honolulu, Hawaii 96816, USA; e-mail:
[email protected]
217
218
S. Resh and others
cultural systems (Paustian and others 1997; Drinkwater and others 1998), but reforestation and afforestation may have the greatest potential for changes in land use to offset increasing CO2 emissions (Vitousek 1991; Brown and others 1992; Moffat 1997; Bruce and others 1999). Reforestation and afforestation of agricultural land increase C storage in plant biomass relative to pasture or annual-crop vegetation, but it is still unclear what differences they exert on the storage of soil C (Bashkin and Binkley 1998; Binkley and Resh 1999; Richter and others 1999; Post and Kwon 2000). Moreover, the effect may differ among tree species (Lugo and others 1990). Tree species differ in biomass production and tissue nutrient concentrations and in their effects on soil properties such as pH, nutrient cycling, and soil biota (Binkley 1996; Binkley and Giardina 1998). All comparisons of N–fixers and non–N–fixers have found 20%– 100% more soil C under N–fixers (Johnson 1992; Cole and others 1995; Rhoades and others 1998); this would equate to 0.05– 0.12 kg m⫺2 y⫺1 greater soil C accumulation under N–fixer forests than under comparable non–N–fixer forests (Tarrant and Miller 1963; Binkley and others 1982; Binkley 1983; Binkley and Sollins 1990; Cole and others 1995; Rhoades and others 1998; Kaye and others 2000). Despite the very consistent and large effect of N–fixing trees on the storage of soil C, the fundamental processes that yield the higher C storage remain unexplained; we do not even know if the higher C storage derives from greater C inputs or reduced C outputs. We used a change in land use from C4 agriculture to C3 forest plantations to determine how N–fixers increase total soil C storage relative to non–N–fixers. Stable carbon isotope techniques allowed us to separate the effects of N–fixers on the storage of older soil C derived from C4 vegetation (SOC4) from the accretion of newer soil C derived from the C3 trees (SOC3). We compared the soil C dynamics under N–fixers with those of non–N–fixing species of Eucalyptus across four sites in Hawaii and Puerto Rico with differing precipitation regimes and soils. We also conducted long-term laboratory incubations of the surface soils from the N–fixer and non– N–fixer stands from three of our study sites to determine whether recently added SOC3 was more or less labile in soils beneath N–fixing trees.
METHODS Study Sites The study sites consisted of 7- to 16-year-old plantations of N–fixers and Eucalyptus species (non–N–
fixers) with three to six replicated plots of each species at each site (Table 1). At the Hawaii sites, the plantation species were Albizia falcataria (L.) Fosberg (also known as Paraserianthes falcataria (L.) Nielsen and Falcataria moluccana (Miquel) Barneby & Grimes) and Eucalyptus saligna (Sm.). At the Puerto Rico sites, the plantation species were Casuarina equisetifolia (L.), Leucaena leucocephala (Lam.) de Wit variety K636, and Eucalyptus robusta J.E. Smith. Albizia and Leucaena belong to the Fabaceae, subfamily Mimosoideae, and Casuarina belongs to the Casuarinaceae. Albizia is nodulated by the Rhizobia and Bradyrhizobia bacteria and also hosts vesicular–arbuscular mycorrhizae (VAM) (Turk and Keyser 1992). Albizia is native to the eastern islands of the Indonesian archipelago and is widely grown in tropical plantations for fuel, pulp, and light construction (Binkley and Giardina 1997). Albizia trees grow very rapidly to 25–30 m tall and up to 1 m in diameter at rates of 6 –18 Mg ha⫺1 y⫺1 of stem increment with N–fixing rates of 65–140 kg N ha⫺1 y⫺1 (Little and Skolmen 1989; Binkley and Giardina 1997). Leucaena is nodulated by Rhizobia bacteria and hosts VAM (Binkley and Giardina 1997). Leucaena is native to Central America, and Leucaena leucocephala is planted extensively in tropical plantations for fuel, roundwood, pulp and paper, and soil improvement (Parrotta 1992; Zabala 1997). Leucaena trees grow rapidly up to 20 m in height and 0.5 m in diameter with aboveground biomass production of 5–55 Mg ha⫺1 y⫺1 (Parrotta 1992) and N–fixation rates of 70 –150 kg N ha⫺1 y⫺1 (Little and Skolmen 1989; Parrotta and others 1996; Binkley and Giardina 1997). Casuarina is nodulated by Frankia actinomycetes and also hosts VAM and ectomycorrhizae (Binkley and Giardina 1997). Casuarina is native to Australia, Malaysia, and Polynesia (Subbarao and Rodrı´guezBarrueco 1995). It is grown throughout the tropics for land reclamation, sand dune stabilization, and wind breaks, as well as timber (Parrotta 1993; Binkley and Giardina 1997). Casuarina grows to 30 – 40 m tall and 0.5 m in diameter with wood increments on good sites of 10 –15 Mg ha⫺1 y⫺1 and N–fixation rates of 60 –95 kg N ha⫺1 y⫺1 in pure stands (Parrotta 1993; Parrotta and others 1994, 1996; Subbarao and Rodrı´guez-Barrueco 1995; Binkley and Giardina 1997). The two species of Eucalyptus are native to southeastern Australia. Both species may grow to 40 – 60 or more m in height and diameters of 1.2 m or more. E. robusta grows well in Puerto Rico and was also planted extensively in Hawaii until the 1960s, when planting shifted to E. saligna and E. grandis.
Albizia Eucalyptus saligna 4000 mm y⫺1 21°C Typic Hydrudands 5.0a 4, 1.8, and 3.3 g/m2 N, P, and K, respectively, at planting, 4 and 8 mo (and at 12, 18, 24, and 36 mo for Eucalyptus seedlings)
Albizia Eucalyptus saligna 4000 mm y⫺1 21°C Typic Hydrudands 4.6a 11 and 5 g/m2 N and P at planting
a Garcia-Montiel and Binkley (1998) See text for primary references for each site
September 1982 16 yr Fallow sugarcane
September 1982 15 yr Fallow sugarcane
Plantation establishment Age at sampling Land use at time of planting Species N–fixer(s) non–N–fixer Climate Precipitation Temperature Soils Classification Surface soil pH (CaCl2) Fertilization regimes
Chinchuck, HI 20°N, 155°W
Kamae, HI 20°N, 155°W
Characteristic
Table 1. Description of the Four Study Sites
Typic Haplusterts 5.6 11.2 g/m2 N before planting and 6-mo intervals for initial 2 yr
1100 mm y⫺1 25°C
Casuarina, Leucaena Eucalyptus robusta
February 1980 16 yr Fallow sugarcane
Lajas, PR 18°N, 76°W
Typic Troposamments 7.0 1.0 g/m2 N at 6-mo intervals from March 1990 to 1992
1600 mm y⫺1 27°C
Casuarina, Leucaena Eucalyptus robusta
September 1989 7 yr Pasture
Toa Baja, PR 18°N, 66°W
N-fixing Trees Sequester Soil Carbon
219
220
S. Resh and others
Eucalyptus wood is used for housing, pulp, fuel, charcoal, and pallets (Little and Skolmen 1989). The Hawaii study sites are located on the northeast coast of Hawaii (Table 1). These sites are described in greater detail as “Upper Kamae” and “Chinchuck” in Binkley (1997) and Garcia-Montiel and Binkley (1998). In the 1920s, both sites were converted from wildland forest (C3 species) to sugarcane (Saccharum officinarum) (C4 species). Sugarcane production at the Kamae site was abandoned in 1960 due to low production. Sugarcane production at the Chinchuck site continued until 1980. In 1981, old vegetation was cleared on both sites, soils were plowed, and new growth was treated with herbicide. In 1982, pure species trials of Albizia and Eucalyptus were planted in a randomized complete block design with four blocks (eight plots total). The trees were planted at a spacing of 1.5 ⫻ 1.5 m in 12 ⫻ 18 m plots for both Albizia and Eucalyptus at the Kamae site and at a spacing of 2 ⫻ 2 m in 15 by 30 ⫻ plots for Albizia and 30 ⫻ 30 m plots for Eucalyptus at the Chinchuck site, with no buffers between plots for either site. These sites are within 1 km on similar soils, but they differed substantially in tree biomass and total soil N (Garcia-Montiel and Binkley 1998). Based on these differences, we treated the sites as independent units for statistical purposes. At the time of soil sampling, the Kamae and Chinchuck tree plantations were 15 and 16 years old, respectively. One Puerto Rico site is located in the Lajas Valley in southwest Puerto Rico (Table 1) (Lugo and others 1990; Wang and others 1991). The site was plowed and treated with herbicide before planting. In February 1980, seedlings of six taxa were planted in pure species plots; we used three of these for this study. Weeding and fertilization were used for the first 6 months, and irrigation was applied when necessary to ensure initial survival. Pure plots of Casuarina, Leucaena, and Eucalyptus were planted in a complete block design with six blocks. The trees were planted at an original spacing of 1 ⫻ 1 m which was thinned to 2 ⫻ 2 m by age 1.5 years. Plot size was 10 ⫻ 10 m with a 3-m buffer between plots and a 5-m buffer between blocks. At the time of planting, the site was fallow following long-term sugarcane management. When we sampled the plantation in December 1996, the area outside the plantation was dominated by a C4 grass (Panicum maximum) with some herbaceous C3 species. Woody species have not dominated this site for the past 100 years prior to these tree plantations (A. E. Lugo, personal communication). Trees were 16 years old at the time of sampling. The second Puerto Rico site is located on the
northern coast at the University of Puerto Rico’s Toa Baja experimental farm (Parrotta and others 1996; Parrotta 1999). The site has had many disturbances that included leveling of the original forested dunes, sand extraction, and cultivation. Pasture grasses, mostly Panicum maximum, were the dominant vegetation at plantation establishment. Site preparation consisted of disking the soil to a depth of 20 cm. The control plots, which remained in pasture grass, were also disked. Pure and mixed plots of Casuarina, Leucaena, and Eucalyptus were established in a randomized complete block design with three blocks. For this current study, only the pure species plots were used. Trees were planted at a spacing of 1 ⫻ 1 m in 16 ⫻ 16 m plots. There was a 5-m buffer between plots and blocks. Recent samples (December 1996) and archived soils from just prior to tree plantation establishment were analyzed from this site. Trees were 7 years old at the time of sampling.
Sample Collection and Processing We collected soil samples in January 1997 from Kamae, in January 1998 from Chinchuck, and in December 1996 from the Puerto Rico sites. We used a 6-cm– diameter soil core lined with a butyrate plastic liner for soil sampling at the Hawaii and Lajas sites. For soil sampling at the Toa Baja site, we used a 5.1-cm– diameter soil corer. In each of the eight plots at the Kamae site, we collected one soil sample to a depth of 40 cm and two samples to a depth of 20 cm near the plot center in a triangular pattern 1 m apart. Three 40-cm cores were collected from neighboring sugarcane fields to be analyzed as a proxy for pre-forest plantation conditions. In each of the eight plots at the Chinchuck site, we collected two soil samples to a depth of 50 cm. Data for neighboring sugarcane soil carbon was provided by M. Bashkin (unpublished). In each of the 18 plots at the Lajas site, we collected one 40-cm soil sample near each plot center. Control plots were located at the end of each of the six blocks, and a 40-cm soil sample was collected at least 5 m from the plantation edge to use as a proxy for pre-plantation conditions for this site. The same sampling design used at Kamae was used for the Toa Baja plantation in Puerto Rico. However, at this site, control plots of pre-plantation vegetation were included in the experimental design and were sampled in the same way as the forest soils; one 40-cm and two 20-cm samples were taken from each of the three control plots. Upon collection, we immediately processed the Kamae, Chinchuck, and Toa Baja soils at a field lab. Lajas soils were stored in the butyrate soil core
N-fixing Trees Sequester Soil Carbon liners for less than 5 days for transport back to Colorado State University (CSU) before processing. In the lab, we divided all soils into 10-cm segments, with the exception of the Chinchuck soils, which we divided into 0 –20- and 20 –50-cm segments. Where we had more than one sample per plot, we composited all soil samples into one sample per plot. Roots larger than 2 mm were removed by hand before any analyses were done. Bulk density (Table 2) was determined for each of the soil segments by over-drying a known fresh mass to a constant dry mass at 105°C; rock mass was negligible. We treated the soils from Kamae and the two Puerto Rico sites with a 0.2N HCl wash to remove CaCO3 that would affect ␦13C values (Ehleringer 1991). There was no evidence of CaCO3 in the Chinchuck soils when 0.2N HCl solution was applied to 10 subsamples. We oven-dried the soils at 105°C and ground them to flour texture for analysis of total C, N, and C isotopes. Soil organic C and N concentrations (Table 2) were determined by dry combustion (LECO-1000; LECO Corporation, St. Joseph, MI, USA). We corrected the C and N concentrations to account for the added salt mass from the acidification process. The ␦13C values of the soils were measured using a VG isochrom-NA stable isotopic ratio mass spectrometer (VG, Middlewich, UK). The mass spectrometer is operated in automatic continuous flow mode using helium as the carrier gas after combustion. The ␦13C values, measured in ‰ (parts per thousand), were calculated as: ␦ 13C ⫽ [(R sample/R PDB)⫺1] ⫻ 10 3
(1)
where R ⫽ 13C/12C and PDB ⫽ Pee Dee Belemnite standard for carbon. We used archieved soils taken at plantation establishment (1989) from the Toa Baja site as preplantation estimates of soil ␦13C. The archived soil samples were air-dried at the time of sampling, stored in plastic containers, and then analyzed concurrently with the fresh soil samples for the procedures described above.
Soil Incubations We conducted 4- and 8-month soil incubations to determine whether SOC3 derived from N–fixing trees decomposed more rapidly than SOC3 derived from Eucalyptus. Surface soils (0 –10-cm) from each tree plot from Kamae, Lajas, and Toa Baja were coarsely sieved (6-mm). We incubated fresh soil samples equivalent to 15 g of oven-dried soil. Each soil sample was brought to – 0.01 MPa water potential using a pressure plate; the samples were
221
weighed and checked twice weekly and brought back to the initial – 0.01 MPa mass. Soils were incubated at 35°C inside loosely covered 1-L glass jars, which also contained a vessel of water to maintain a high humidity environment. The jars were opened to ambient atmosphere twice weekly to ensure adequate availability of oxygen for decomposition. To determine relative loss of SOC3, pre- and postincubation SOC concentration and ␦13C values were measured for each sample, and Eqs. (2) and (3) were used to determine the %C3 and mass of the pre- and postincubation SOC3. The SOC3 change over time was determined by subtracting the postincubation values from the preincubation values and dividing by the preincubation values to get a relative C3 loss comparison (mg C3 loss/g initial C3). We analyzed for the effect of species (that is, N–fixer vs non–N–fixer) on the relative loss of SOC3 using a split-plot statistical design.
Corrections for Bulk Density Bulk density did not differ between species for the Hawaii sites (Table 2A and B). However, bulk density differed for soils under the pasture and forest at Lajas and over time at Toa Baja (Table 2C and D). This means that a 0 –10-cm sample taken at one place or time represented a different mass of soil at another place or time. To correct for the bulk density differences, Lajas forest soil mass was adjusted to an equivalent pasture soil mass and Toa Baja 1996 soil masses were adjusted to 1989 equivalent masses to reflect equivalent soil mass comparisons. Concentrations of C and N and ␦13C values were all corrected for the depth adjustments. For simplicity, depths will be addressed as 0 –10, 10 –20, 20 –30, and 30 – 40 cm. The bulk density adjustments for Lajas increased the average SOCT (kg/m2) under the trees by 4%.
Calculations The percent of total soil organic carbon (SOCT) coming from pasture grasses or sugarcane (C4) was calculated as: % C 4 ⫽ [共␦ 13C sample ⫺ ␦ 13C 3)/␦ 13C 4 ⫺ ␦ 13C 3)] ⫻ 100 (Cerri and others 1985)
(2)
where ␦13C3 is the ␦13C of a composite sample of pure forest litterfall and roots and ␦13C4 is the ␦13C of a composite of pure C4 grass or sugarcane litter, leaves, and roots. The C3 and C4 endpoints were different for each site and for each tree species within the Toa Baja and Lajas sites (Table 3). The
222
S. Resh and others
Table 2. Soil Bulk Density, pH, Effective Cation Exchange Capacity (ECEC), Base Saturation (BS), N, C, and 13C Concentrations for A the Kamae Site, B the Chinchuck Site, C the Lajas Site, and D the Toa Baja Site A Kamae Depth (cm)
Bulk Density (kg L–1)
0–10 10–20 20–30 30–40
pHa (in Water)
ECECa (mmolc kg–1)
0.51 ⫾ 0.08 0.37 ⫾ 0.13 0.24 ⫾ 0.04 0.27 ⫾ 0.03
4.8 ⫾ 0.1
Eucalyptus (n ⫽ 3) 40.4 ⫾ 3.3 22.3 ⫾ 4.3
0–10 10–20 20–30 30–40
0.49 ⫾ 0.06 0.40 ⫾ 0.14 0.28 ⫾ 0.06 0.26 ⫾ 0.07
4.7 ⫾ 0.04
Albizia (n ⫽ 4) 39.4 ⫾ 2.2 20.0 ⫾ 4.7
0–10 10–20 20–30 30–40
0.44 ⫾ 0.10 0.43 ⫾ 0.12 0.32 ⫾ 0.04 0.34 ⫾ 0.07
no data
BSa (%)
Cane (n ⫽ 3) no data no data
N (g kg–1)
C (g kg–1)
␦13C (‰)
8.2 ⫾ 0.3 6.4 ⫾ 1.4 4.5 ⫾ 0.2 4.6 ⫾ 0.2
133.4 ⫾ 10.5 102.5 ⫾ 15.4 81.7 ⫾ 5.4 82.4 ⫾ 3.1
–22.8 ⫾ 1.2 –22.5 ⫾ 1.1 –24.1 ⫾ 0.3 –23.9 ⫾ 0.7
9.4 ⫾ 0.4 7.5 ⫾ 0.7 5.3 ⫾ 0.6 4.6 ⫾ 0.4
142.4 ⫾ 5.0 113.8 ⫾ 7.0 85.5 ⫾ 9.7 77.5 ⫾ 12.5
–22.9 ⫾ 0.5 –23.1 ⫾ 0.8 –23.5 ⫾ 0.6 –23.8 ⫾ 0.6
6.9 ⫾ 0.3 5.3 ⫾ 0.9 4.9 ⫾ 0.8 3.2 ⫾ 1.3
103.7 ⫾ 7.0 85.9 ⫾ 11.5 82.4 ⫾ 15.7 57.0 ⫾ 21.2
–20.4 ⫾ 0.7 –22.2 ⫾ 1.3 –23.7 ⫾ 0.7 –24.0 ⫾ 0.3
N (g kg–1)
C (g kg–1)
␦13C (‰)
6.2 ⫾ 0.8 3.7 ⫾ 1.1
112.0 ⫾ 12.8 69.6 ⫾ 19.7
–24.3 ⫾ 0.4 –24.7 ⫾ 0.3
7.4 ⫾ 1.1 4.4 ⫾ 0.6
114.6 ⫾ 16.6 77.3 ⫾ 7.5
–23.9 ⫾ 0.7 –24.9 ⫾ 0.4
N (g kg–1)
C (g kg–1)
␦13C (‰)
1.6 ⫾ 0.2 1.1 ⫾ 0.2 0.9 ⫾ 0.2 0.6 ⫾ 0.3
21.1 ⫾ 2.7 14.8 ⫾ 1.5 10.2 ⫾ 2.8 6.8 ⫾ 2.9
–18.7 ⫾ 1.1 –16.3 ⫾ 0.7 –17.5 ⫾ 0.8 –18.0 ⫾ 1.1
2.1 ⫾ 0.5 1.1 ⫾ 0.2 0.9 ⫾ 0.2 0.7 ⫾ 0.4
29.9 ⫾ 7.0 15.7 ⫾ 3.4 12.6 ⫾ 4.1 9.4 ⫾ 5.9
–20.0 ⫾ 1.7 –17.1 ⫾ 0.7 –17.3 ⫾ 1.1 –17.3 ⫾ 1.4
2.9 ⫾ 1.3 1.2 ⫾ 0.3 1.0 ⫾ 0.3 0.8 ⫾ 0.3
34.2 ⫾ 13.7 15.9 ⫾ 3.4 12.6 ⫾ 4.0 10.0 ⫾ 5.4
–20.7 ⫾ 1.3 –16.2 ⫾ 2.0 –17.2 ⫾ 1.5 –18.3 ⫾ 3.4
B Chinchuck Depth (cm)
Bulk Density (kg L–1)
0–20 20–50 0–20 20–50
pHa (in Water)
ECECa (mmolc kg–1)
0.34 ⫾ 0.07 0.28 ⫾ 0.10
5.2 ⫾ 0.2
Eucalyptus (n ⫽ 4) 19.5 ⫾ 3.9 52.3 ⫾ 18.6
0.39 ⫾ 0.07 0.27 ⫾ 0.04
5.0 ⫾ 0.1
Albizia (n ⫽ 4) 24.3 ⫾ 3.3 36.3 ⫾ 3.1
pHa (in Water)
ECECa (mmolc kg–1)
BSa (%)
C Lajas Depth (cm)
Bulk Density (kg L–1)
0–10 10–20 20–30 30–40
1.09 ⫾ 0.11 1.24 ⫾ 0.10 1.26 ⫾ 0.09 1.36 ⫾ 0.16
no data
Eucalyptus (n ⫽ 6) 460 ⫾ 10 14.7
0–10 10–20 20–30 30–40
0.96 ⫾ 0.12 1.27 ⫾ 0.08 1.29 ⫾ 0.10 1.40 ⫾ 0.12
no data
Casuarina (n ⫽ 6) 490 ⫾ 30 14.1
0–10 10–20 20–30 30–40
1.00 ⫾ 0.06 1.21 ⫾ 0.11 1.33 ⫾ 0.06 1.33 ⫾ 0.07
no data
Leucaena (n ⫽ 6) 500 ⫾ 20 14.4
BSa (%)
N-fixing Trees Sequester Soil Carbon
223
Table 2. (Continued) C Lajas Depth (cm)
Bulk Density (kg L–1)
0–10 10–20 20–30 30–40
1.27 ⫾ 0.11 1.35 ⫾ 0.07 1.37 ⫾ 0.05 1.39 ⫾ 0.06
pH (in Water)
ECECb (mmolc kg–1)
no data
Pasture (n ⫽ 6) no data no data
pHd (in Water)
ECECd (mmolc kg–1)
BSb,c (%)
N (g kg–1)
C (g kg–1)
␦13C (‰)
1.4 ⫾ 0.1 1.2 ⫾ 0.1 1.0 ⫾ 0.2 0.8 ⫾ 0.1
18.0 ⫾ 1.5 16.3 ⫾ 1.6 13.5 ⫾ 2.4 10.5 ⫾ 2.6
–16.5 ⫾ 0.8 –16.1 ⫾ 0.4 –16.2 ⫾ 0.8 –17.2 ⫾ 1.1
N (g kg–1)
C (g kg–1)
␦13C (‰)
1.1 ⫾ 0.4 0.9 ⫾ 0.4 0.6 ⫾ 0.3 0.5 ⫾ 0.2
11.4 ⫾ 2.7 7.7 ⫾ 2.4 5.6 ⫾ 3.3 4.3 ⫾ 2.6
–23.6 ⫾ 0.6 –21.9 ⫾ 1.6 –22.0 ⫾ 1.0 –21.6 ⫾ 0.7
1.1 ⫾ 0.3 0.9 ⫾ 0.3 0.9 ⫾ 0.4 0.5 ⫾ 0.1
12.6 ⫾ 5.0 7.9 ⫾ 2.9 7.0 ⫾ 3.4 3.6 ⫾ 0.1
–24.8 ⫾ 1.3 –21.6 ⫾ 0.9 –20.4 ⫾ 1.0 –21.0 ⫾ 0.4
1.5 ⫾ 0.2 1.0 ⫾ 0.4 0.8 ⫾ 0.4 0.5 ⫾ 0.3
13.9 ⫾ 1.8 8.1 ⫾ 3.0 6.8 ⫾ 2.7 4.1 ⫾ 2.0
–24.3 ⫾ 1.4 –21.5 ⫾ 1.3 –20.3 ⫾ 1.1 –20.6 ⫾ 0.6
1.4 ⫾ 0.6 1.3 ⫾ 0.3 0.9 ⫾ 0.6 0.6 ⫾ 0.7
13.7 ⫾ 5.7 11.7 ⫾ 4.0 7.6 ⫾ 4.7 5.9 ⫾ 5.1
–19.2 ⫾ 1.2 –20.3 ⫾ 0.8 –20.2 ⫾ 1.7 –23.1 ⫾ 2.9
D Toa Baja Depth (cm)
Bulk Density (kg L–1)
0–10 10–20 20–30 30–40
1.21 ⫾ 0.19 1.28 ⫾ 0.10 1.24 ⫾ 0.13 1.41 ⫾ 0.19
7.77
0–10 10–20 20–30 30–40
1.16 ⫾ 0.05 1.29 ⫾ 0.06 1.49 ⫾ 0.16 1.50 ⫾ 0.13
7.93
0–10 10–20 20–30 30–40
1.10 ⫾ 0.08 1.23 ⫾ 0.12 1.40 ⫾ 0.26 1.42 ⫾ 0.24
7.95
0–10 10–20 20–30 30–40
1.16 ⫾ 0.09 1.27 ⫾ 0.10 1.42 ⫾ 0.16 1.45 ⫾ 0.19
7.70
BSe (%)
Eucalyptus (n ⫽ 3) 98.7 99.0 98.8 99.2 Casuarina (n ⫽ 3) 83.4 98.3 99.0 99.0 99.1 Leucaena (n ⫽ 3) 93.0 98.5 98.7 98.8 99.4 Pasture (n) ⫽ 3) 97.3 98.9 99.4 98.7 99.2 68.6
Standard deviations are provided where applicable. At the Kamae site, one Eucalyptus plot is excluded from analysis due to the predominance of rock in the last 20 cm of the 0 – 40-cm soil core. a Data from Garcia-Montiel and Binkley (1998). Data were measured from the surface 20 cm of soil when the plantation was 12 years old. b Data from Wang and others (1991). Data were measured from the top 3 cm of soil when the plantation was 5.5 years old. c Base saturation was calculated as the sum of the basic cations Ca2⫹, Mg2⫹, K⫹, and Na⫹ divided by the CEC. d Data from Parrotta (1999). Data were measured from the surface 20 cm of soil when the plantation was 7.5 years old. e Base saturation was calculated as the sum of the basic cations Ca2⫹, Mg2⫹, K⫹, and Na⫹ divided by the CEC from Parrotta (1999 and unpublished). Data were measured when the plantation was 7.5 years old.
␦13C values for Hawaii are from Bashkin and Binkley (1998). Root ␦13C values are from roots collected throughout all 0 – 40-cm soil cores and composited for each species. Total SOC in kg C/m2 was calculated based on the soil bulk density and C concentration for each sample depth. The equation for SOC4 (kg C/m2) was: SOC 4 ⫽ (%C 4/100) ⫻ SOC T
(3)
Soil C derived from C3 vegetation was calculated by subtracting SOC4 from SOCT. We estimated the net changes in the SOC pools by using initial soil conditions at the time of planting, developed either from pre-plantation sampling (at Toa Baja) or from adjacent areas where land use remained in the prior condition of pasture or sugarcane (other sites). We also evaluated the divergence in SOC and soil N between the N–fixers and
224
S. Resh and others
Table 3. Site and Species C3 and C4 ␦13C Endpoints used for Equation (2) Site b
Hawaii sites Lajas (n ⫽ 6)
Toa Baja (n ⫽3)
Species
C3 Endpointa
C4 Endpoint
Eucalyptus, Albizia, sugarcane Eucalyptus Casuarinac Leucaena Pasture Eucalyptus Casuarinac Leucaena Pasture
–25.11 –27.01 ⫾ 0.53 –26.30 ⫾ 0.17 –26.94 ⫾ 0.50 –26.60 ⫾ 1.13 –28.33 ⫾ 0.10 –29.41 ⫾ 0.59 –28.64 ⫾ 0.27 –28.78d
–11.52
–13.80 ⫾ 0.38
–14.52 ⫾ 0.31
Endpoints are composites of litterfall and roots from each species at each site. a ⫾ are standard deviation where applicable b Bashkin and Binkley (1998) c Casuarina differed significantly from both Eucalyptus and Leucaena (P⬍0.1 for both sites). d Average of the three tree species endpoints
non–N–fixers by contrasting the soils at the time of sampling. Annual changes (kg m⫺2 y⫺1) in SOCT, SOC4, and SOC3 since plantation establishment were estimated using the following equation example: SOC 3 change ⫽ (current SOC 3 ⫺ initial SOC 3)/plantation age
(4)
Separating Pre–Sugarcane/Pasture SOC3 from Contemporary SOC3 The SOC3 pools for each site included both pre-C4 and contemporary C3 components. We assumed no change in the C3 components that predated the establishment of C4 vegetation for two reasons. Because disturbances to the original forest SOC3 occurred several decades ago for all sites, any remaining SOC3 from this period must be very recalcitrant to have remained in the soil for this long. For the Toa Baja site, we also had archived soil samples from before the establishment of the tree and pasture plantations, and there was no discernible loss of this old SOC3 in the plots that were planted with C4 grasses (Resh 1999; S. Resh unpublished). Because the Toa Baja soil is extremely sandy and would be predicted to have the highest SOC turnover rates compared with the other three sites with clay soils (Burke and others 1989; Schimel and others 1994), the Hawaii and Lajas clays also should have no measurable loss of older SOC3. Thus, we attributed any changes in SOC3 (Eq. [4]) since forest plantation establishment to additions of contemporary SOC3. Furthermore, given that the pre–sugarcane/pasture SOC3 turnover would be the same within any one site, SOC3 comparisons between
current plantation species at the site would be affected equally by the older SOC3 turnover. The resulting bias could possibly be an overprediction of the magnitude of contemporary SOC3 pools and changes in those pools for the site by no more than 10% (Schimel and others 1994), but it would not change the relative differences between species presented in this paper. Our estimates of the magnitude of change in the pools of organic matter derived from C3 and C4 sources depend in part on our expectation that the ␦13C of organic matter from prior land use was the same as the values we used for the current C3 (trees) and C4 (grasses) vegetation. We are confident that for the Hawaiian sites the historic SOC3 was similar in ␦13C to SOC derived from Eucalyptus, based on comparisons of native C3 forests and Eucalyptus plantations that had no C4 influence (Bashkin and Binkley 1998). In Puerto Rico, the prior soil organic matter derived from C3 forests may have differed somewhat in ␦13C from the endpoint we used, but any such difference should be minor (less than 2 per mil); it would provide small biases in our estimate SOC4 and SOC3 pool sizes (10%–20%); and it would not affect the test of the differing effects of tree species.
Statistical Analysis All analyses were conducted using SYSTAT version 7.0 (SYSTAT 1997). For each analysis, residual plots of the raw data were inspected visually for nonnormality and heteroscedasticity violations of analysis of variance (ANOVA) assumptions. Species effects on SOC and N pools within site. We used an ANOVA for a general two-factor com-
N-fixing Trees Sequester Soil Carbon
225
pletely randomized block design with two to three levels of species and three to six levels of block (the number of species and block depends on site). To test for the tree species effects on the SOC pools and soil N within a given site, we used species as the main effect with species by block interaction as the error term. For the Puerto Rico sites with more than two tree species, we used Tukey’s multiple comparison for determination of significant differences. Species effects on changes in SOC pools across the four sites. To test for N–fixer vs non–N–fixer differences across sites, annual SOC changes were used (Eq. [4]). For the Lajas and Toa Baja sites, where two N–fixer species were sampled, the species were averaged together into one N–fixer category to test the difference between N–fixing and non–N–fixing species. For each site, the research plantations used a completely randomized block design. However, combining the data into a single analysis is no longer a completely randomized block design due to the species-within-blocks restriction. An ANOVA was used with site as the main effect, blocks as plot effects, and species-within-blocks as the split-plot effects. With this model, site is treated as a fixed effect, and species and block are random effects. The error terms were plot-within-site sum of squares for the main effect and species by plotwithin-site sums of squares for the species effect and the site by species interaction effect (Binkley 1997).
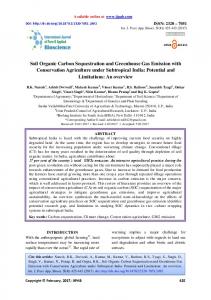
RESULTS Across the four sites, N–fixers sequestered significantly more SOCT than non–N–fixers (0.11 kg m⫺2 y⫺1; P ⫽ 0.02) (Figure 1). This SOCT difference between the N–fixers and the non–N–fixers combines a relatively small loss of old SOC4 (0.05 ⫾ 0.05 kg C4 m⫺2 y⫺1) with a large gain of new SOC3 (0.16 ⫾ 0.05 kg C3 m⫺2 y⫺1) under the N–fixers. In comparison, the non–N–fixers lost significantly much more old SOC4 (0.11 ⫾ 0.05 kg C4 m⫺2 y⫺1; P ⫽ 0.03) and accumulated less new SOC3 (0.11 ⫾ 0.05 kg C3 m⫺2 y⫺1; P ⫽ 0.07). No interactions between site and species were significant (P ⬎ 0.1). SOCT pools in the surface 40 cm ranged from 3 to 16 kg/m2; Toa Baja had the smallest and Hawaii had the largest SOCT pools. Although only statistically significant for Leucaena at the Lajas site, the SOCT and soil N pools under the N–fixers tended to be greater relative to the non–N–fixers for each of the four sites (Figures 2 and 3). At Kamae and Chinchuck in Hawaii, Albizia had 1.16 (P ⫽ 0.97) and 2.1 kg/m2 (P ⫽ 0.28), respectively, more SOCT than Eucalyptus. Soil N was 0.14 (P ⫽ 0.94) and
Figure 1. Aggregated SOC changes (kg C m⫺2 y⫺1) since plantation establishment across the four study sites. The error bars are standard errors of the mean using n ⫽ 4 for non–N–fixer species and n ⫽ 6 for the N–fixer species. The P values are for the test of the species-within-block split-plot effect.
0.23 kg/m2 (P ⫽ 0.13) greater under Albizia than under Eucalyptus at Kamae and Chinchuck. Leucaena consistently had the highest SOCT and soil N in Puerto Rico. At Lajas, Leucaena had 2.6 kg/m2 more SOCT (P ⫽ 0.09) and 0.22 kg/m2 more soil N (P ⫽ 0.05) than Eucalyptus. For Toa Baja, Leucaena had 0.5 kg/m2 more SOCT (P ⫽ 0.96) and 0.10 kg/m2 more soil N (P ⫽ 0.87) than Eucalyptus. Greater SOCT under the N–fixers resulted from a combination of both larger SOC4 pools and larger
226
S. Resh and others
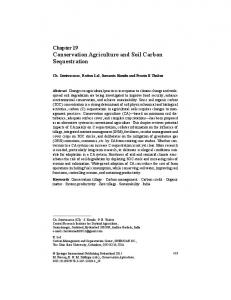
Figure 2. SOC pools to 40 cm (or 50 cm for Chinchuck) for each species at Kamae (n ⫽ 3 for Eucalyptus and sugarcane, n ⫽ 4 for Albizia), Chinchuck (n ⫽ 4 for Eucalyptus and Albizia), Lajas (n ⫽ 6 for all species), and Toa Baja (n ⫽ 3 for all species). The error bars are standard errors of the mean for the total SOC pool. Different letters above the bars indicate significant differences for the total SOC pool between species within a site with P ⬍ 0.1 (see text for specific P values). The sugarcane data for the Chinchuck site are from M. A. Bashkin (unpublished). Note the change in y-axis scale for the Toa Baja site.
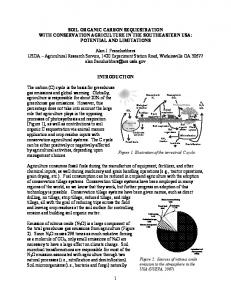
SOC3 pools, but the differences between species for these pools were not statistically significant for any of the sites. The differences in SOC4 pools under the N–fixers compared with the Eucalyptus ranged from 0.04 kg/m2 (P ⫽ 1.00) higher under Albizia at Kamae to 1.07 kg/m2 (P ⫽ 0.44) higher under Leucaena at Lajas (Figure 2). The N–fixers, with one exception, also had greater SOC3 pools than Eucalyptus, ranging from 0.04 kg/m2 (P ⫽ 1.00) higher under Leucaena at Toa Baja to 1.5 kg/m2 (P ⫽ 0.18) higher under Leucaena at Lajas and 1.5 kg/m2 (P ⫽ 0.27) higher under Albizia at Chinchuck (Figure 2). The SOC3 under N–fixing trees decomposed more rapidly than the SOC3 under Eucalyptus, but there were no significant changes in SOC4 for the N–fixers or non–N–fixers during the incubation period. After 8 months of laboratory incubations, N–fixer soil lost 98 mg C3 loss/g C3 initial more than non– N–fixer soil, or a 68% greater loss of the SOC3 (Figure 4). The difference in SOC3 was significant only for the first 4 months (78 mg SOC3 loss/g
Figure 3. Soil N pools to 40 cm (or 50 cm for Chinchuck). The error bars are standard errors of the mean, sample sizes are as given in Figure 1. Different letters above the bars indicate significant differences between species within a site with P ⬍ 0.05 (see text for specific P values). The sugarcane data for the Chinchuck site are from M. A. Bashkin (unpublished).
N-fixing Trees Sequester Soil Carbon
227
Figure 4. Cumulative loss of SOC3 (mg SOC3 loss/g initial SOC3) from N–fixer and Eucalyptus soil during 4-month (n ⫽ 13) and 8-month (n ⫽ 12) laboratory incubations. The 4-month SOC3 loss differed between N–fixers and Eucalyptus (P ⫽ 0.05). The error bars represent standard errors of the mean.
initial SOC3; P ⫽ 0.05). Between 4 and 8 months, the loss of SOC3 slowed for both the N–fixer and non–N–fixers soil and became more variable resulting in an overall greater loss of SOC3 from the N–fixer soil. However, the difference was no longer significant.
DISCUSSION SOC4 Retention under N–fixers Across this set of sites and species, soils beneath N–fixing trees showed greater retention of older, recalcitrant soil C (SOC4). The higher retention of SOC4 related well to the level of N accretion in each plot; N accretion explained 62% of the variability in SOC4 retention under the N–fixers (P ⬍ 0.001) (Figure 5 top). Where the N–fixers lost soil N relative to the non–N–fixers, they also lost more SOC4; conversely, when the N–fixers gained relatively more soil N, the N–fixers retained more SOC4. This correlation points to a consistent C:N stoichiometry across the species and sites. Why might retention of old carbon relate to soil N accretion? Until recently, the dominant paradigm was that N additions to soils increased the microbial decomposition of organic matter (Fog 1988). Because microbes manufacture enzymes to decompose organic substrates and enzymes require N, microbes with more N might produce more enzymes and thus speed decomposition (Aber and Melillo 1991). Studies have shown increased decomposition of litter (Harmon and others 1990; Green and
Figure 5. Soil nitrogen accretion vs SOC4 retention (top) and SOCT difference under the N–fixers (calculated as the difference between N–fixer and Eucalyptus soil N and SOC4 or SOCT). Each datum is a N–fixer species within a block within a site (n ⫽ 25). K ⫽ Kamae site, C ⫽ Chinchuck site, L ⫽ Lajas site, and TB ⫽ Toa Baja site. Linear regression with 95% confidence intervals is shown.
others 1995) and increased microbial activity (Hart and Stark 1997; Carreiro and others 2000) following N additions (that is, urea or ammonium nitrate). However, empirical studies have also shown that N additions can inhibit decomposition (Fog 1988; Berg and Tamm 1991; Camire and others 1991; Cole and others 1995; Prescott 1995; Arnebrant and others 1996; Carreiro and others 2000). The majority of these studies compared litter mass loss or CO2 evolution from tissues of different species, with or without additions of exogenous N. Direct effects of high soil N supply and indirect effects of high N concentrations in litter generally increase initial decomposition rates of fresh litter (Melillo and others 1982; Berg and Matzner 1997; Berg 2000; but see Prescott 1995), but they inhibit the decomposition of humified soil C (Amebrant and others 1996; Berg 2000). The effects of N addition on decomposition
228
S. Resh and others
may vary with substrate chemistry; Hobbie (2000) found that N addition speeded decomposition of low-lignin but not high-lignin leaves. Two working hypotheses address N suppression of later phases of litter and humus decomposition (Fog 1988; Berg and Matzner 1997; Berg 1986, 2000). N additions, especially in the form of ammonium, may give a competitive edge to several cellulose decomposers (for example, bacteria) over lignocellulose decomposers (for instance, fungi), owing to the suppression of lignolytic enzyme synthesis by many species of fungi. This would favor the decomposition of labile soil organic C while inhibiting the decomposition of recalcitrant soil organic C (Carreiro and others 2000). Alternatively, low-molecular-weight N compounds (for example, amino acids, ammonium, and nitrate) may be incorporated into covalent bonds between C molecules (for example, lignin molecules and phenolics). This would create larger molecules that are resistant to microbial decomposition (Stevenson 1994). Albizia soils in Hawaii had lower active fungal and higher active bacterial biomass compared to Eucalyptus soils in a three-site comparison in Hawaii that includes the two Hawaii sites addressed in this present study (Garcia-Montiel and Binkley 1998), which lends support to the importance of changes in the microbial community. Greater retention of old C under N–fixers has been identified in at least two other sites. Rhoades and others (1998) found 0.1 kg/m2 greater old pasture C to a depth of 15 cm under individual stems and patches of an N–fixer compared with that under a non–N–fixer growing within pastures on the west slope of the Ecuadorian Andes. Kaye and others (2000) found a positive correlation (r2 ⫽ 0.61; P ⫽ 0.07) between old soil C pools and increasing proportions of Albizia mixed with Eucalyptus in a replicated replacement series design in Hawaii. Additionally, Kaye and others (2001), using plots from the Toa Baja site with experimental additions of 15 N, found a greater proportion of 15N retained in nonlabile soil pools under N–fixers compared with Eucalyptus, providing further evidence linking N–fixers with altered humification rates. Across the four sites, about 55% of the SOCT difference between the N fixer soils and non–N– fixers soils came from greater SOC4 retention under the N–fixers. However, this proportion differed by site, ranging from 10% at Kamae to 90% at Toa Baja, with the remainder of the proportion of the SOCT difference between the N–fixers and non–N– fixers consisting of greater SOC3 accretion under the N–fixers. Corresponding with this shift in dom-
inance from SOC4 retention to SOC3 accretion, there is a site difference in average soil N content that ranges from 0.87 kg N/m2 at Kamae to 0.38 kg N/m2 at Toa Baja. Thus, there is a general trend across these four sites that as the base level of soil N content increases, the accretion of new C becomes the more dominant mechanism for the greater total soil C difference between N–fixers and non–N–fixers. This effect of higher base level soil N content on SOC3 accretion is probably an increased site productivity effect.
Greater SOC3 Accretion under N–fixers Across the four sites, greater accretion of new SOC3 under N–fixing trees accounted for about 45% of the SOCT difference between N–fixer soils and non– N–fixers soils, with ranges in this proportion from 10% to 90% depending on site. Rhoades and others (1998) found that over 90% of the SOCT difference between the N–fixer and non–N–fixer came from new N–fixer C accretion. Greater SOC3 accretion under the N–fixers could result from greater N–fixer C inputs to the soil, or from slower decomposition of N–fixer SOC3 litter, or some combination of both. Our laboratory soil incubations showed equal or greater loss of SOC3 from N–fixer soils, indicating that the larger pools of SOC3 derived from higher inputs rather than slower decomposition of fresh litter. There is evidence in the literature from temperate N–fixer studies for both slower long-term decomposition of N–fixer litter (Cole and others 1995; Camire and others 1991) and greater N–fixer inputs (Cole and others 1995). Binkley and Ryan (1998) found higher belowground production under Albizia (1.54 kg m⫺2 y⫺1) than under Eucalyptus (1.18 kg m⫺2 y⫺1)—although total production was similar between Albizia (3.88 kg m⫺2 y⫺1) and Eucalyptus (4.14 kg m⫺2 y⫺1)—in a three-site comparison in Hawaii that included the two sites used in the present study. These data, combined with our conclusion that C inputs explain the SOC3 accretion show the importance of below ground inputs to soil C accretion in Hawaii. The importance of inputs from aboveground and belowground for soil C accretion may vary among sites. Parrotta (1999) measured higher aboveground net primary production for both Leucaena (3.09 kg m⫺2 y⫺1) and Casuarina (3.85 kg m⫺2 y⫺1) compared with Eucalyptus (2.24 kg m⫺2 y⫺1) at Toa Baja. However, without knowing belowground production for Toa Baja, we cannot speculate on the relative importance of above vs belowground control on soil C accretion.
N-fixing Trees Sequester Soil Carbon
229
Greater SOCT Sequestration under N–fixers
ACKNOWLEDGMENTS
The greater SOCT difference under N–fixers compared with non–N–fixers resulted from the greater retention of old SOC4 and the greater accretion of new SOC3. The accretion of soil N explained 78% of the variability in the SOCT difference (P ⬍ 0.001) (Figure 5 bottom). This study includes sites from a broad geographical area in the tropics with Eucalyptus as a proxy for non–N–fixers. The resulting SOCT difference between the N–fixers and Eucalyptus is in agreement with N–fixer/non–N–fixer comparisons from temperate forest (Johnson 1992; Cole and others 1995) and other tropical sites (Rhoades and others 1998; Kaye and others 2000). The varying SOC pool sizes between sites strongly reflect previous site history and probably edaphic characteristics as well (Figure 2). For example, the Hawaii sites were dominated by wildland forests (Bashkin and Binkley 1998) before the C4 sugarcane plantations were established in the 1920s. Thus, one would expect these Hawaii sites to have a strong influence of C3 vegetation reflected in the proportionally larger SOC3 to SOC4 pools relative to the other sites. Furthermore, the magnitudes of SOCT for these Hawaii sites are twice that of the Lajas site and four times that of the Toa Baja site. The high organic content of these Hawaii soils results from the greater ability of the amorphous clays in these Andisols to retain C than other soil types (Torn and others 1997). The higher SOCT of the Lajas site Vertisol clays compared to the Toa Baja sandy soil probably reflects the typical pattern that soil organic C increases with increased clay content (Tiessen and others 1982; Burke and others 1989). Because this study includes multiple sites with three differing soil textures and the pattern of greater SOCT sequestration, SOC4 retention, and SOC3 accretion under N–fixers remains consistent across the textural changes, we can conclude that soil texture is probably not a determinant mechanism affecting the observed changes in SOC. While reforestation and afforestation are being considered as mechanisms to reduce C emission penalties (UNFCCC 1997), it is important to recognize that, from a soil C sequestration standpoint, tree species differ in their effects. N–fixers sequester 0.05– 0.12 kg m–2 y⫺1 more C in their soils than non–N–fixers. Pure and mixed species forests that include N–fixers appear to be an option for soil C sequestration (Johnson 1992; Cole and others 1995; Kaye and others 2000). These findings may be relevant to countries interested in planting forests for C sequestration purposes.
This research was supported by National Science Foundation (NSF) grants DEB97-08521 and DEB98-16006 and McIntire-Stennis appropriations to Colorado State University. We gratefully acknowledge Ariel Lugo for encouragement and permission to sample the Lajas site. We thank Rod Chimner, Christian Giardina, Xiaoming Zou, Zhigang Liu, Margot Kaye, and Jason Kaye for field assistance and Wendy Estes, Cindy Shimada, Carol Volk, and Jennifer Clark for laboratory assistance. We also thank J. R. ZumBrunnen of the Statistical Laboratory at Colorado State University (CSU) for consulting services on the statistical analysis and Dan Reuss of CSU’s Natural Resource Ecology Laboratory for mass spectrometer assistance. We appreciate the effort of two anonymous reviewers who helped to improve this manuscript.
REFERENCES Aber JD, Melillo JM. 1991. Terrestrial ecosystems. Philadelphia: Saunders. ¨ . 1996. Soil Arnebrant K, Bååth E, So¨ derstro¨ m B, Nohrsted H-O microbial activity in eleven Swedish coniferous forests in relation to site fertility and nitrogen fertilization.Scand J For Res 11:1– 6. Bashkin MA, Binkley D. 1998. Changes in soil carbon following afforestation in Hawaii. Ecology 79:828 –33. Berg B. 2000. Litter decomposition and organic matter turnover in northern forest soils. For Ecol Manage 133:13–22. Berg B. 1986. Nutrient release from litter and humus in coniferous forest soils—a mini review. Scand J For Res 1:359 – 69. Berg B, Matzner E. 1997. Effect of N deposition on decomposition of plant litter and soil organic matter in forest systems. Environ Rev 5:1–25. Berg B, Tamm CO. 1991. Decomposition and nutrient dynamics of litter in long-term optimm nutrition experiments. I. Organic matter decomposition in Norway spruce (Piceaabies) needle litter. Scand J For Res 6:305–21. Binkley D. 1997. Bioassays of the influence of Eucalyptus saligna and Albizia falcataria on soil nutrient supply and limitation. For Ecol Manage 91:229 –34. Binkley D. 1983. Ecosystem production in Douglas-fir plantations: interaction of red alder and site fertility. For Ecol Manage 5:215–27. Binkley D. 1996. The influence of tree species on forest soils: processes and patterns. In: Mead DJ, Cornforth IS, (editors). Proceedings of the Trees and Soils Workshop. Special publication no. 10. Canterbury: Agronomy Society of New Zealand. p 1–33. Binkley D, Cromack K Jr, Fredriksen RL. 1982. Nitrogen accretion and availability in some snowbrush ecosystems. For Sci 28:720 – 4. Binkley D, Giardina C. 1997. Nitrogen fixation in tropical forest plantations. In: Sadanandan Nambiar EK, Brown AG, (editors). Management of soil, nutrients and water in tropical plantation forests. ACIAR monograph no. 43. Canberra: CSIRO.
230
S. Resh and others
Binkley D, Giardina C. 1998. Why do tree species affect soils? The warp and woof of tree–soil interactions. Biogeochemistry 42:89 –106.
Johnson DW. 1992. Effects of forest management on soil carbon storage. Water Air, Soil Poll 64:83–120.
Binkley D, Resh SC. 1999. Rapid changes in soils following Eucalyptus afforestation in Hawaii. Soil Sci Soc Am J 63:222–5.
Kaye JP, Binkley D, Zou X, Parrotta JA. 2002. Non-labile soil 15nitrogen retention beneath three tree species in a tropical plantation. Soil Sci Soc Am J 66: in press.
Binkley D, Ryan MG. 1998. Net primary production and nutrient cycling in replicated stands of Eucalyptus saligna and Albizia falcataria. For Ecol Manage 112:79 – 85.
Kaye JP, Resh SC, Kaye MW, Chimner RA. 2000. Nutrient and carbon dynamics in a replacement series of Eucalyptus and Albizia trees. Ecology 81:3267–73.
Binkley D, Sollins P. 1990. Factors determining differences in soil pH in adjacent conifer and alder– conifer stands. Soil Sci Soc Am J 54:1427–33.
Little EL Jr, Skolmen RG. 1989. Common forest trees of Hawaii (native and introduced). Agriculture handbook no. 679. Washington (DC): USDA Forest Service.
Brown S, Lugo AE, Iverson LR. 1992. Processes and lands for sequestering carbon in the tropical forest landscape. Water Air Soil Poll 64:139 –55.
Lugo AE, Wang D, Bormann FH. 1990. A comparative analysis of biomass production in five tropical tree species. For Ecol Manag 31:153– 66.
Bruce JP, Frome M, Haites E, Janzen H, Lal R, Paustian K. 1999. Carbon sequestration in soils. J Soil Water Conserv 54:382–9.
Melillo JM, Aber JD, Muratore JF. 1982. Nitrogen and lignin control of hardwood leaf litter decomposition dynamics. Ecology 63:621– 6.
Burke IC, Yonker CM, Parton WJ, Cole CV, Flach K, Schimel DS. 1989. Texture, climate, and cultivation effects on soil organic matter content in U.S. grassland soils. Soil Sci Soc Am J 53:800 –5. Camire´ C, Coˆ te´ B, Brulotte S. 1991. Decomposition of roots of black alder and hybrid poplar in short-rotation plantings: nitrogen and lignin control. Plant Soil 138:123–32. Carreiro MM, Sinsabaugh RL, Repert DA, Parkhurst DG. 2000. Microbial enzyme shifts explain litter decay responses to simulated nitrogen deposition. Ecology 81:2359 – 65. Cerri CC, Feller C, Balesdent J, Victoria R, Plenecassagne A. 1985. Application du trac¸ age isotopique naturel en 13C, a` l’e´ tude de la dynamique de la matie`re organique dans le sols. Comptes Rendus Acad Sci Paris T.300, II, 9:423– 8. Cole DW, Compton JE, Edmonds RL, Homann PS, Van Miegroet J. 1995. Comparison of carbon accumulation in Douglas fir and red alder forests. In: McFee WW, Kelly JM, (editors). Carbon forms and functions in forest soils. Madison (WI): Soil Science Society of America. pp. 527–546. Drinkwater LE, Wagoner P, Sarrantonio M. 1998. Legume-based cropping systems have reduced carbon and nitrogen losses. Nature 396:262–5. Ehleringer JR. 1991. 13C/12C fractionation and its utility in terrestrial plant studies. In: Coleman DC, Fry B, editors. Carbon isotope techniques. SanDiego: Academic Press. pp. 187–200. Fog K. 1988. The effect of added nitrogen on the rate of decomposition of organic matter. Biol Rev 63:433– 62. Garcia-Montiel DC, Binkley D. 1998. Effect of Eucalyptus saligna and Albizia falcataria on soil processes and nitrogen supply in Hawaii. Oecologia 113:547–56. Green CJ, Blackmer AM, Horton R. 1995. Nitrogen effects on conservation of carbon during corn residue decomposition in soil. Soil Sci Soc Am J 59:453–9. Harmon ME, Baker GA, Spycher G, Greene SE. 1990. Leaf-litter decomposition in the Picea/Tsuga forests of Olympic National Park, Washington, U.S.A. For Ecol Manage 31:55– 66.
Moffat AS. 1997. Resurgent forests can be greenhouse gas sponges. Science 277:315– 6. Nadelhoffer KJ, Emmett BA, Gunderson P, Koopmans OJ, Schleppi P, Tietema A, Wright RF. 1999. Nitrogen deposition makes a minor contribution to carbon sequestration in temperate forests. Nature 398:145– 8. Parrotta JA. 1993. Casuarina equisetifolia L. ex J. R. & G. Forst. Silvics of forest trees of the American tropics. SO-ITF-SM-56. New Orleans: US Department of Agriculture, Forest Service, Inst. Trop. For., Southern Forest Exp. Stn. Parrotta JA. 1992. Leucaena leucocephala (Lam.) de Wit. Silvics of forest trees of the American tropics. SO-ITF-SM-56. New Orleans: US Department of Agriculture, Forest Service, Inst. Trop. For., Southern Forest Exp. Stn. Parrotta JA. 1999. Productivity, nutrient cycling, and succession in single- and mixed-species plantations of Casuarina equisetifolia, Eucalyptus robusta, and Leucaena leucocephala in Puerto Rico. For Ecol Manage 124:45–77. Parrotta JA, Baker DD, Fried M. 1994. Application of 15N– enrichment methodologies to estimate nitrogen fixation in Casuarina equisetifolia. Can J For Res 24:201–7. Parrotta JA, Baker DD, Fried M. 1996. Changes in dinitrogen fixation in maturing stands of Casuarina equisetifolia and Leucaena leucocephala. Can J For Res 26:1684 –91. Paustian K, Andren O, Janzen H, Lal R, Smith P, Tian G, Tiessen H, van Noordwijk M, Woomer P. 1997. Agricultural soil as a C sink to offset CO2 emissions. Soil Use Manage 13:230 – 44. Post WM, Kwon KC. 2000. Soil carbon sequestration and landuse change: processes and potential. Global Change Biol 6:317–27. Prescott CE. 1995. Does nitrogen availability control rates of litter decomposition in forests? Plant Soil 168:83– 8. Resh SC. 1999. Nitrogen-fixing tropical trees sequester soil carbon [dissertation]. Fort Collins (CO): Colorado State University.
Hart SC, Stark JM. 1997. Nitrogen limitation of the microbial biomass in an old-growth forest soil. Ecoscience 4:91– 8.
Rhoades CC, Eckert GE, Coleman DC. 1998. Effect of pasture trees on soil nitrogen and organic matter: implications for tropical montane forest restoration. Restor Ecol 6:262–70.
Hobbie SE. 2000. Interactions between litter lignin and soil nitrogen availability during leaf litter decomposition in a Hawaiian montane forest. Ecosystems 3:484 –94.
Richter DD, Markewitz D, Trumbore SE, Wells CG. 1999. Rapid accumulation and turnover of soil carbon in an aggrading forest. Nature 400:56 – 8.
Houghton RA. 2000. Annual fluxes of carbon from deforestation and regrowth in the Brazilian Amazon. Nature 403:301– 4.
Schimel D, Braswell BH, Holland EA, McKeown R, Ojima DS, Painter TH, Townsend AR. 1994. Climatic, edaphic, and biotic controls over storage and turnover of carbon in soils. Global Biogeochem Cycles 8:279 –93.
Houghton RA. 1994. The worldwide extent of land-use change. BioScience 44:305–13.
N-fixing Trees Sequester Soil Carbon Schlesinger WH. 1997. Biogeochemistry: an analysis of global change. 2nd ed. San Diego: Academic Press. p. 156. Schlesinger WH. 1999. Carbon sequestration in soils. Science 284:2095. Schlesinger WH. 1990. Evidence from chronosequence studies for low carbon-storage potential of soils. Nature 348:232–24. Stevenson FJ. 1994. Humus chemistry: genesis, composition, reactions. 2nd ed. New York: Wiley. Subbarao NS, Rodrı´quez-Barrueco C. 1995. Casuarinas. Lebanon (NH): Science Publishers. SYSTAT. 1997. SYSTAT 7.0 for Windows. Chicago: SPSS. Tarrant RF, Miller RE. 1963. Accumulation of organic matter and soil nitrogen beneath a plantation of red alder and Douglas-fir. Soil Sci Soc Am Proc 27:231– 4. Tiessen H, Stewart JWB, Bettany JR. 1982. Cultivation effects on the amounts and concentration of carbon, nitrogen, and phosphorus in grassland soils. Agron J 74:831–5. Torn MS, Trumbore SE, Chadwick OA, Vitousek PM, Hendricks DM. 1997. Mineral control of soil organic carbon storage and turnover. Nature 389:170 –3.
231
Turk D, Keyser HH. 1992. Rhizobia that nodulate tree legumes: specificity of the host for nodulation and effectiveness. Can J Microbiol 38:451– 60. [UNFCCC] United Nations Framework Convention on Climate Change. 1997. Kyoto Protocol to the United Nations Framework Convention on Climate Change. Available on the Internet: http://www.cop3.de/ Van Cleve K, Powers RF. 1995. Soil carbon, soil formation, and ecosystem development. In: McFee WW, Kelly JM, editors. Carbon forms and functions in forest soils. Madison (WI): Soil Science Society of America. Vitousek PM. 1991. Can planted forest counteract increasing atmospheric carbon dioxide? J Environ Qual 20:348 –54. Wang D, Bormann FH, Lugo AE, Bowden RD. 1991. Comparison of nutrient-use efficiency and biomass production in five tropical tree taxa. For Ecol Manage 46:1–21. Zabala NQ, editor. 1997. International Workshop on Albizia and Paraserianthes species. Forest, farm, and community tree research reports. Special issue. Morrilton (AK): Winrock International.