1
Group-Delay Measurement of Frequency-Converting Devices using a Comb Generator Jonathan Scott, Senior Member, IEEE and Michael Hoy
Abstract— We propose a new method for the measurement of the (group) delay from the RF input to the IF output of a mixer or receiver. The method is particularly convenient for measuring the change in group delay with the local oscillator tuning frequency of the receiver, since the method does not require access to, or even knowledge of, the LO signal. The method employs a calibrated comb (impulse) generator. Other required equipment is limited to a reference signal generator and a digitiser of modest bandwidth, allowing the measurement to rely on a low-frequency generator and oscilloscope. Simulated and measured data are presented to verify the approach. Index Terms— Microwave measurements, Delay estimation, Pulse measurements, Microwave mixers, Frequency conversion, Impulse testing, Phase measurement.
I. I NTRODUCTION The group delay of a simple component is readily estimated using a Vector Network Analyzer (VNA) by observing that δϕ (1) δω and thence finding the first-order differences of phase and frequency between samples in a frequency sweep. The measurement is not so easy in the case of a frequency-translating component such as a mixer, a receiver, or a transponder. Group delay, and especially its variation with receive frequency, is of interest in the analysis of channels of phased-array receivers and satellite transponders, for example. Though demanding, it is possible to use a VNA to measure group delay of a component that offsets frequency. [1], [2] The method in [2] uses a round-robin of three mixers to find the characteristics of one mixer, subject to an assumption of reciprocity, and then calibrates a combined VNA and frequencytranslating extension by means of the characterized reciprocal mixer. This extended instrument can then measure the delay of frequency-translating unknowns. If the group delay of the Device Under Test (DUT) is required for various Local Oscillator (LO) frequencies (values of the frequency translated), a separate calibration data set for each LO frequency is required. Furthermore, the method effectively requires access to the LO of the DUT, the frequency being translated, as the reference mixer or the DUT must use the same LO as the converter in the VNA extension. This becomes extremely complicated if the DUT actually contains several translations, such as might be found in a full receiver. In summary, the need to have LO τg =
The authors are with the Department of Electronic Engineering, the University of Waikato, Hamilton, New Zealand. e-mail:
[email protected] Copyright (c) 2009 IEEE. Personal use of this material is permitted. However, permission to use this material for any other purposes must be obtained from the IEEE by sending a request to
[email protected].
signals and the lengthy calibration at each frequency make the method unappealing or impossible. Provided certain constraints on the test frequencies can be observed, a variation of the VNA method can be implemented using a Large Signal Network Analyzer (LSNA)1 without the LO access restrictions. [3] This method is really obviating the need for access to the LO signal by substituting its own, and can be seen as a variation of the method of [4] discussed below, but that relies on the calibration capabilities of the LSNA. A sampling oscilloscope can serve as a general-purpose, multi-channel microwave receiver, and it is possible to characterize a frequency-translating device across a very wide bandwidth using one. In [4] a mixer is accurately characterized, yielding its group delay. The method requires considerable calibration of the instrument including time-alignment of the channels, and it requires that the signals be stable and repetitive. This effectively requires that the test signal and the LO signal be frequency locked. The method, like the one in [3], is suited to single, high-precision measurements of devices performing a single translation in the laboratory. Group delay has been estimated by the authors of [5] using a scalar network analyzer and the Hilbert transform. In their approach the system is assumed minimum phase, and the group delay found as if using a VNA. Since a magnitude-frequency sweep is all that is required, the method is extended straightforwardly to frequency-converting systems in [5]. The result “closely approximates” the group delay of the circuit with an added constant. The weakness of the method is in the assumption of minimum phase. It is intended for use in situations where a minimum-phase filter, such as a channelization filter, dominates the system response. In an attempt to overcome the competition between accuracy and resolution in the traditional definition of group delay, Zhu et al redefine it in [6]. Their measurement methods may be carried out using a VNA, but their method sidesteps problems associated with a DUT that has rapidly-varying in-band phase. Unfortunately the extension to frequency-translating devices is not eased by the extended definition. An alternative approach for measurement of group delay is the Envelope Delay technique. This is essentially using a modulation-demodulation scheme to allow the group delay to be extracted through analysis of modulation signals, the envelope, rather than the carrier. The ingoing and outgoing modulation signals are typically cross-correlated to find the delay. The appeal of the method lies in the fact that one 1 The LSNA is a specific implementation of the class of instrument referred to as a Nonlinear Vector Network Analyzer or NVNA.
2
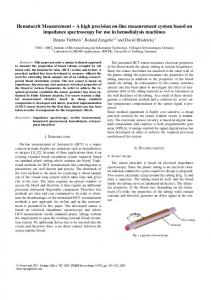
requires only relatively low-frequency circuits, though some effort is required to obtain good temporal accuracy. [7], [8] A feature of the approach is that the phase of the carrier is neither known nor important. Extension to frequency-translating devices requires only that the modulation-demodulation mechanism accepts the appropriate carrier frequencies, a situation similar to, but less demanding than the VNA extension of the VNA method. A weakness lies in the use of modulationdemodulation circuits, as these are inherently included in the measured system, the DUT. In this manuscript a method is proposed that resembles the envelope delay approach to the extent that cross-correlation of signals is used to obtain the delay. However, frequency translations are inherently handled by means of a calibrated comb generator. II. T HE C OMB M ETHOD We propose a new method for measurement of group delay in the case of a frequency-translating device. This method relies upon the availability of a comb or phase-reference generator, also called an impulse generator in time-domain parlance. A suitable generator has appeared in the literature, and is now available as a commercial product. [9]–[11] Figure 1 presents the block diagram of our measurement setup that allows measurement of an arbitrary frequency-converting device.
as might be carried out using a VNA, may contain a component arising in the IF: δϕ (4) δωIF ωLO
since a shift in modulation frequency produces a change in the IF signal. If this so-called “IF group delay distortion” component can be made independent of the absolute value of RF and LO frequencies, it can be subtracted out between measurements made at different translation frequencies, provided the perturbation employed in the measurement at each receive frequency is the same. Unfortunately this requires knowledge of the LO frequency and is not always possible.3 Nevertheless, to obtain the change in the delay with ωLO at a discrete range of received frequencies one can obtain at each receive frequency ϕM + − ϕM − ∆ϕ δϕ δϕ = ≈ + (5) ∆ωM ωLO ωM + − ωM − δωM δωIF where ωM + − ωM − should be a fraction of the IF bandwidth, and then the desired change in delay is ) ( ∆ϕ ∆ϕ δϕ δϕ − ≈ − ∆ωM ωLO ∆ωM ωLO δωM ωLO δωM ωLO 1 2 1 2 ωIF (6) Let the modulation test tone generator have a signal of the form VM = cos(ωM t) (7) Then the comb generator provides an output of the form
COMB GEN
SIGNAL GEN
PC
D.U.T.
N ∑
VC =
DIGITIZER
an cos(nωM t + ϕn )
(8)
n=1
AGILENT U9391C
Fig. 1. Block diagram of the measurement setup. The comb generator is an Agilent U9391C, the modulation signal generator a Tektronix AFG3021, and the digitizer a Tektronix MSO4054. The comb generator conveniently contains a fast squaring circuit and frequency divider to minimise jitter, but this is not necessary for the method.
Within the receiver this signal is mixed with the local oscillator and products in an IF frequency range are filtered, leading to a signal of the form VIF =
q ∑
bn cos [(nωM − ωLO )t + ϕn ]
(9)
n=p
The delay from the RF input to the IF output of a receiver, measured at the center of the IF, is sought. Mathematically the delay is the rate of change of phase with modulation frequency for constant IF frequency: δϕ δωM ωIF ,ωLO
(2)
Unfortunately, it is impossible to measure a derivative without perturbation, in this case of the modulation frequency, ωM , and so also the IF frequency, ωIF . Thus the above cannot strictly be obtained.2 Measuring ∆ϕ (3) ∆ωM ωLO 2 This dilemma is considered in [6]. This manuscript will not dwell on the difficulties of the definition, and the reader is directed to [6] for more detail.
where p and q are such as to select tones that are present in the IF bandwidth; for instance, if the IF contains frequencies ωIF ± ωBW ⌈ ⌉ ωIF − ωBW + ωLO (10) p= ωM and
⌊
ωIF + ωBW + ωLO q= ωM
⌋ (11)
The situation is exemplified in figure 2. We seek to recover ωM from (the digital representation of) this IF signal without explicit knowledge of ωLO . From this it will be possible to compute δϕ/δωM by perturbing ωM . To 3 The “IF group delay distortion” can be visualized as arising because the disposition of tones in the IF must necessarily change: If ωM changes the spacing of tones changes, and if ωLO changes the location of tones changes. A change in ωM is necessary to make the group delay measurement in the first instance.
3
p
Only terms of the first sort contain ωM without ωLO . Consider contributions to the term at ωM (k = 1) from the first group: There will be 2(q − p − 1) terms of the form
ωM qωM
...
...
* −ωLO
X
2ωBW
−ωIF
bi cos(ωM t + δk ) (16) 2 The summation of these yields a tone at ωM whose amplitude and phase is an average of the amplitudes and phases of the contributing tones, provided δk is small. Suppose we determine the phase of this IF component at ωM with respect to the original signal used to drive the comb generator. Call this phase ϕM . Then we may calculate
ωLO
ωIF
=
where ωM 1 quency.
demod ωM
ϕM 1 − ϕM 2 δϕM =⇒ (17) δωM ωM 1 − ω M 2 = ωM 2 + ∆ω, ∆ω being the perturbation fre-
... ... ...
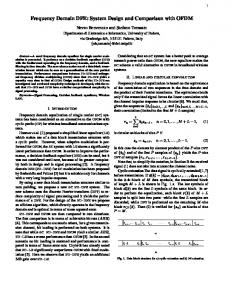
A. Assumptions Fig. 2. Sketch of typical spectra that might be involved in a measurement. Magnitudes of the tones involved are sketched against frequency. The top trace is the comb generator output; this is convolved with the LO signal, and multiplied by the response of the BPF, leading to the IF spectrum in the second-lowest plot. The bottom plot after demodulation yields at least a component at ωM . The task is to deduce the phase of the original modulating signal at ωM using only the tones obtained from the IF, specifically without knowledge of either the frequency or phase of the ωLO tone.
this end we demodulate directly from the IF signal in AMstyle by, say, squaring: { q }2 ∑ 2 VIF = bn cos [(nωM − ωLO )t + ϕn ] (12) n=p
It is clear that this will give rise to (q − p)2 terms. Recalling that 1 cos(a) cos(b) = [cos(a − b) + cos(a + b)] (13) 2 and in the degenerate case of b = a cos2 (a) =
1 [cos(2a) + 1] 2
(14)
each of the (q − p)2 “cos2 ” terms will decompose into parts whose frequencies will be the sum, the difference, or twice the original frequency, or dc. Assume ωIF ≫ ωBW > 2ωM
(15)
Observe that equation 12 will contain signals of four sorts: 1) terms with phase that is the difference between the phases of two different terms in the original series of form cos(kωM t + δk ) where k runs from 1 to q − p and δk is the difference between the appropriate pair of ϕn ; 2) terms with phase that is the sum of the phases of two different terms in the original series of form cos[(uωM − 2ωLO )t + ϕu ] where u runs from 2p to 2q and ϕu is the sum of two ϕn ; 3) terms with phase 2nωM − 2ωLO + 2ϕn ; 4) dc terms.
It must be assumed that the phase of tones in the comb does not vary with respect to ideal with change in the pump frequency, ωM , sampled about a given part of the spectrum. In other words, tones close to the receive frequency, say 2 GHz, have the same phase for different pump frequencies, say 5 MHz (where the receive frequency is near the 400th tooth of the comb) or 6 MHz (where the receive frequency is near the 333th tooth of the comb). This is typically the case if the time-domain waveform of the comb generator is reasonably impulse-like and does not have a long tail. This is a safe assumption in the case of the comb generator used in this work, especially as we are at the lower end of its specified operating frequency range. The interested reader may note that the design does not rely on resonant circuits, step-recovery diodes, etc. [10] It is also assumed that the phase variation in a group of tones within the IF bandwidth of a receive frequency is small, so that movements in the exact positions and number of the sampled tones does not materially alter the average obtained by summing tones such as identified in equation 16. This last is most likely to hold when the number of comb tones falling in the IF bandwidth is large, and thus the impact of perturbation is divided amongst more contributors. In the case of the comb generator used in this work, there is a specification for the phase deviation that is quite tight, yet the typical performance is much better than the worst-case possibility, especially at the low end of the operating frequency range. It must furthermore be the case that the pump frequency is less than the IF bandwidth so that at least one mixing product falls within the IF, yet large enough to resolve the delay of the system. III. S IMULATION An example receiver system was implemented in SPICE as a DUT to verify the new method and identify practical issues. This consisted of an LO signal that ranged from 1 to 2 GHz, a mixer represented by an ideal multiplier, and an IF filter in the form of a 4th -order Butterworth bandpass filter with cutoff points at 58 and 82 MHz. This choice
4
reflected the DUT used in section IV. The comb source was modeled as a trapezoidal pulse 15ps wide. Transmission lines were inserted at the input and output of the circuit adding a known delay in addition to that of the filter. Resistors placed at the ends of the input side transmission line, between the comb source and the mixer input, could be varied to allow mismatch effects to be simulated. To determine the phase angle between the modulation source and the component at the same frequency in the squared-IF signal a cross-correlation at the fundamental frequency was carried out between a reference sinewave aligned with the pulses and the squared output voltage waveform. A. Selection of Modulation Frequency
must be taken into account in the selection of PRF and ωm . For our example DUT a frequency below 5 MHz would seem to be a good choice.
B. Effect of Source Mismatch In practice the DUT must be connected to the comb generator via a transmission line. If the DUT has significant return loss and the source in the measurement—the comb generator—is not perfectly matched, standing waves will be established on the interconnect line. In this case the group delay measurement may be influenced by the measurement system through its source match, the generator ΓS . In the case of the impulse transiting a line that is mismatched at both ends the voltage at the DUT can be written: v(t) ∝ δ(t) +
∞ ∑
δ(t − mTR )ΓT m
(18)
m=1
where TR is the roundtrip delay, twice the electrical length of the line between the mismatches, and ΓT = ΓS ΓD is the product of the source reflection coefficient, ΓS , and the DUT input reflection coefficient, ΓD . In the frequency domain this becomes: 1 (19) V (f ) ∝ 1 − ΓT eȷ2πfRF TR
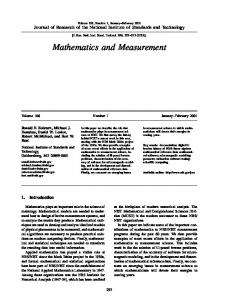
Fig. 3. Simulated results showing the effect of the pulse repetition frequency, PRF or ωm , on measured delay for fLO = 2GHz.
Figure 3 displays simulated group delay of the DUT against modulation frequency, ωm = 2πfm . Note that the value becomes erratic as fm approaches the IF bandwidth of 24 MHz. This is the IF group delay distortion that arises from the product identified in equation 4. It is most easily understood when it is realised that increasing ωm means comb teeth in the frequency domain that are more widely spaced. As the PRF approaches the IF bandwidth, the number of comb teeth that fall in the IF decreases toward one; If there were to be only one or two tones falling in the IF, and the delay varies across the IF, then the delay value that is measured will depend upon where in the IF the sampling tones happen to fall. For larger numbers of tones in the IF, corresponding to a lower PRF, the result takes on an averaged value obtained in the sum of tones identified in equation 16. This leads to the consistent result visible in the figure for frequencies of only a few megahertz, where a number of tones occupy the IF bandwidth. Since temporal resolution of this method decreases as ωm and the PRF decrease there will always be a tradeoff between exposure to IF group delay distortion on one hand and measurement resolution on the other. These mechanisms
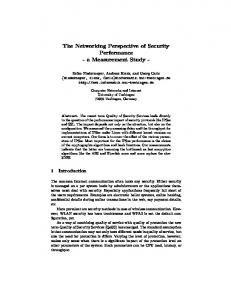
This can be thought of as the original teeth in the frequency domain, with an added “wobble” in their vectors. Figure 4 plots group delay obtained from simulated data with various amounts of mismatch introduced. It is clear from the plot that source mismatch can compromise accuracy. The error that is introduced will vary with the frequency of interest to the DUT, fRF , and the length of the interconnect line.
Fig. 4. Simulated results of group delay measurement for varying loop reflectance ΓT = ΓS ΓD for a variety of roundtrip delays from 9–11ns. LO frequency is constant at 2000 MHz.
5
IV. M EASUREMENTS A. Materials and Methods For practical measurements the DUT consisted of a passive mixer (Minicircuits SRA-11+) followed by a bandpass filter (BPF, a Minicircuits PBP-70+), and an amplifier (Minicircuits MAR-2+), with additional components selected as per the application notes. The diagram of this is shown in figure 5. The comb generator is the Agilent U9391C and the oscilloscope a Tektronix MSO4054. A Tektronix AFG3021 was used for the reference signal and an Agilent 8648B for the local oscilator. The generators were not phase-locked.
Input
X SIGNAL GEN
BPF
not produce any output for a significant period of time. In the frequency domain as pictured in figure 2 this corresponds to the tones in the IF falling close to, but not exactly on top of, multiples of the modulation frequency. This problem has been solved by introducing small offsets to the LO frequency such that exact multiplies are not encountered. B. Results Measurements were carried out on the DUT using the equipment as noted above. Data files acquired on the oscilloscope were fed to processing software to find group delay. Results are shown in figure 6.
Output
D.U.T
Fig. 5. Block diagram of the DUT used in measurements. The mixer was a Minicircuits SRA-11+, the Band Pass Filter (BPF) a Minicircuits PBP-70+, the amplifier a Minicircuits MAR-2+, and the LO signal generator was an Agilent 8648B.
The length of the connecting cables was measured using a VNA and appropiate offsets added during data processing to remove measurement setup characteristics. The same data processing was used on measured data as was used on simulated data with the phase difference between signals found by using a cross-correlation at the fundamental frequency of the pulses. Group delay is nominally determined through equation 17 with a suitable perturbation frequency. As noted previously, the perturbation of ωM displaces tones lying in the IF of the DUT leading to the possibility of IF group delay distortion. The perturbation is required, in effect, to determine the number of whole multiples of modulation tone period in the total delay of the DUT. If the approximate DUT group delay is known, an appropriate multiple of 2π may be added to the phase difference returned from a single cross correlation at a single value of ωM . This can be thought of as a type of “phase unwrapping”. This opens the possibility of obtaining the group delay by a two-stage method wherein a perturbation is initially employed to obtain group delay including IF group delay distortion and noise amplification because of the subtraction of numbers of similar magnitude, and then the “unperturbed” data is phase-unwrapped, leading to a group delay value with less variation. If the LO can also be set to fix IF tone positions, the IF group delay distortion can be held constant. We will refer to these two methods as the “perturbed” and “unperturbed” methods. If only change in delay with LO frequency is sought, equation 6 might be used to minimize the impact of IF group delay distortion. Because the generators are not phase-locked it is possible to encounter slow beats between the modulation frequency (PRF) and the LO. The period of the signal fed to the digitiser can be inconveniently long. When the LO frequency is near an exact multiple of the pulse rate, in the time domain the pulses can land on a null on the LO sine wave, and the mixer will
Fig. 6. Measurements of group delay for various LO frequencies both with and without an additional delay line (fM = 5M Hz and ∆f = 1M Hz). Results are shown for the perturbed and unperturbed methods. Two unperturbed traces are presented in each case, one for each of the two modulation frequencies, 5 MHz and 6 MHz.
Implementing the same conditions and procedures, simulations were carried out on the simple model of the DUT. By this means it is possible to develop confidence in the software and explain phenomena in the measurement method. The results are shown in figure 7. It should be noted that the model DUT used for simulation is not expected to return exactly the same delays as the physical DUT as we have made no effort to model the complexities of the mixer or the detail of the actual BPF. The measured group delay is around 37ns. This is consistent with expectation based on the group delay being dominated by that of the IF BPF. The specified group delay of the BPF varies between a minimum of 24 ns and a maximum of 36 ns in-band, and the full DUT adds the mixer, amplifier, and a few centimetres of planar and coaxial interconnection. A second set of data repeats the measurement with a transmission line of about 5 ns delay added, a simple confirmation of the process. The “perturbed” measured results show a “noise” of about 6ns peak-to peak. This is not noise, but IF group delay distortion (IFGDD). The signal-to-noise ratio of ωM in the squaredIF data was typically 30dB or more, with no perceptible ωM content in the raw IF data before squaring.
6
a calibration procedure, should mismatch present itself as a significant source of error. R EFERENCES
Fig. 7. Group delay from simulated data for various LO frequencies for the model DUT both with and without an additional delay line (fM = 5MHz, ∆f = 1MHz). Results are shown for the perturbed and unperturbed methods.
The IFGDD can be made to “disappear”, but this is an illusion. For example, simulations carried out with LO frequencies that are exact multiples of the modulation frequency, piped to a program that extracts the “unperturbed” group delay will show no uncertainty or noise in the group delay results at all. This is because the spacing of tones in the IF remains constant, since ωM is constant, and the position of tones in the IF remains constant, since the LO shifts by a frequency that is an exact multiple of ωM . All this achieves is to freeze the IFGDD at a particular value. It must be stressed that this is an emergent phenomenon of the measurement, not an error, noise, or inadequacy of technique. The simulated data presented in figure 7 displays comparable IFGDD. Care has been taken to simulate with actual LO frequencies that are not quite related to the modulation frequency, so that the position of tones in the IF changes from one LO frequency to another, and a “true” degree of distortionrelated variation appears on the data. V. C ONCLUSIONS We have shown that the comb method is a viable method to measure group delay of a frequency-translating device such as a receiver. The method requires knowledge of few details of any translations in the device under test. Care needs to be taken with the choice of modulation frequency, too large a value leading to excessive IF group delay distortion. More stable results may be obtainable in the presence of IF group delay distortion if perturbation is used to obtain an estimate of delay, then unperturbed results are phase-unwrapped to match. Reflections introduced by source mismatch can introduce errors. Error bounds are set by the product of source and DUT input reflection coefficients. In the future it should be possible to develop a method to back-correct for this source of error through the introduction of directional couplers and
[1] Michael E. Knox, “A Novel Technique for Characterizing the Absolute Group Delay and Delay Linearity of Frequency Translation Devices”, 53rd ARFTG Conference Digest, Volume 35, June 1999 Pp:1–7. [2] My Le Truong, Michael Knox and Joel Dunsmore, “HIGHLY ACCURATE ABSOLUTE GROUP DELAY MEASUREMENT TECHNIQUE FOR FREQUENCY TRANSLATION DEVICES”, 28th European Microwave Conference, Amsterdam 1998, pp98–103. [3] W. Van Moer and Y. Rolain, “Determining the Reciprocity of Mixers Through Three-Port Large Signal Network Analyzer Measurements”, IEEE Transactions on Instrumentation and Measurement, Vol. 56, no. 5, October 2007, pp2051–2056. [4] Dylan F. Williams, Hassen Khenissi, Fabien Ndagijimana, Kate A. Remley, Joel P. Dunsmore, Paul D. Hale, Jack C. M. Wang, and Tracy S. Clement, “Sampling-oscilloscope measurement of a microwave mixer with single-digit phase accuracy”, IEEE Transactions on Microwave Theory and Techniques, Vol 54, No. 3, March 2006, pp1210–1217. [5] Philip Perry and Thomas J. Brazil, “Hilbert-Transform-Derived Relative Group Delay Measurement Of Frequency Conversion Systems”, IEEE MTT-S Digest, paper TH3F-24, pp1695–1698, 1996. [6] Xiangwei Zhu, Yuanling Li, Shaowei Yong, and Zhaowen Zhuang, “A Novel Definition and Measurement Method of Group Delay and Its Application”, IEEE Transactions on Instrumentation and Measurement, vol. 58, no. 1, January 2009, pp229–233. [7] Graham Woods and Douglas Maskell, “Improving Group Delay Measurement Accuracy using the FM Envelope Delay Technique”, IEEE TENCON, 21–24 November, 2005, pp1–6. [8] Graham Woods and Douglas Maskell, “The Discrete-time Quadrature Subsample Estimation of Delay”, IEEE Transactions on Instrumentation and Measurement, vol. 51, no. 1, February 2002, pp133–137. [9] P. S. Blockley, D. Gunyan, and J. B. Scott, “Mixer-Based, VectorCorrected, Vector Signal/Network Analyzer Offering 300kHz-20GHz Bandwidth and Traceable Phase Response”, IEEE International Microwave Symposium, Long Beach, CA, 12–16 June 2005. [10] Jonathan Scott and Daniel Gunyan, “Pulse Generator”, US patent number 7,423,470, granted September 2008. [11] Agilent Technologies, U9391C Comb Generator, 10 MHz to 26.5 GHz, http://www.home.agilent.com/agilent/product. jspx?pn=U9391C, retrieved December 2008.