Growth Model Selection and its Application for Characterizing Life History of a Migratory Bull Trout (Salvelinus confluentus) Population Author(s): John M. Erhardt and Dennis L. Scarnecchia Source: Northwest Science, 90(3):328-339. Published By: Northwest Scientific Association DOI: http://dx.doi.org/10.3955/046.090.0311 URL: http://www.bioone.org/doi/full/10.3955/046.090.0311
BioOne (www.bioone.org) is a nonprofit, online aggregation of core research in the biological, ecological, and environmental sciences. BioOne provides a sustainable online platform for over 170 journals and books published by nonprofit societies, associations, museums, institutions, and presses. Your use of this PDF, the BioOne Web site, and all posted and associated content indicates your acceptance of BioOne’s Terms of Use, available at www.bioone.org/page/terms_of_use. Usage of BioOne content is strictly limited to personal, educational, and non-commercial use. Commercial inquiries or rights and permissions requests should be directed to the individual publisher as copyright holder.
BioOne sees sustainable scholarly publishing as an inherently collaborative enterprise connecting authors, nonprofit publishers, academic institutions, research libraries, and research funders in the common goal of maximizing access to critical research.
John M. Erhardt1, 2, and Dennis L. Scarnecchia, Department of Fish and Wildlife Sciences, University of Idaho, Moscow, Idaho 83844
Growth Model Selection and its Application For Characterizing Life History of a Migratory Bull Trout (Salvelinus confluentus) Population
Abstract Five growth models were evaluated for their effectiveness in characterizing growth of an isolated population of bull trout, Salvelinus confluentus, undergoing a long term cessation of harvest (1994–2005) in the North Fork Clearwater River, Idaho, above Dworshak Dam. To explore the dynamics of growth in migratory bull trout, one of the models, the von Bertalanffy model, was also fitted based on age estimates derived from annuli and growth increments on pelvic fin ray sections for three juvenile outmigration age groups. Among five growth models evaluated, four models fitted to the age-length data described the fish growth for ages 3 to 11 comparably well. Only a model that exhibited positive growth acceleration as age progressed fitted the data less effectively. Growth was significantly (P < 0.001) related to the age of outmigration from natal streams (1–3 years). Migratory bull trout were found to reach maturation at ages 4–6; the common age-4 maturation was younger than most comparable studies. All mature fish studied reared for 2–3 years in downriver or reservoir habitat. As the adult population size has continued to increase since harvest closure in 1994, further research should be directed towards understanding the trade-offs between these increasing numbers of adult fish and growth, survival, migration, and maturation schedules. Keywords: age at maturity, fish age and growth, life history, salmonid, Idaho
Introduction Accurate quantitative descriptions of growth are important for many aspects of fish stock assessment, including characterizing life histories, optimizing harvest, and assessing habitat quality (Isely and Grabowski 2007). Models of fish growth have typically been developed based on age-length data from age estimates and are commonly used to represent an entire fish stock (DeVries and Frie 1996). In many cases, age-length models used in stock assessment are derived from only portions of the age (or size) groups because data for all age groups are seldom available. Schnute (1981) developed a generalized four parameter age-length model that provides an easily interpretable method for selecting among many of the previously published growth models (including the von Bertalanffy [1938], Gompertz [1825], and logistic [Ricker 1975]). The model 1 Author to whom correspondence should be addressed. Email:
[email protected] 2 Current address: U.S. Geological Survey, Western Fisheries Research Center, 5501-A Cook-Underwood Road, Cook, Washington 98605
328
Northwest Science, Vol. 90, No. 3, 2016 © 2016 by the Northwest Scientific Association. All rights reserved.
is based on the assumption that relative growth acceleration is linear (Schnute 1981). It is not constrained by assumptions such as asymptotic length, and therefore may allow the curve to conform more closely to the data (Millstein and O’Clair 2001). The model generates a convenient way to test model fit among additional three parameter sub-cases of the fully parameterized model. In addition to model selection, it provides an analytical method to explore growth variability within populations. For bull trout (Salvelinus confluentus) a relict char of western North America (Hass and McPhail 1991), knowledge of growth is a key factor in understanding diverse aspects of their life histories. Like other chars (Nordeng 1961, 1983; Rikardsen and Elliot 2000), bull trout populations can exhibit partial migration (Jonsson and Jonsson 1993), where they can migrate from or reside in their natal streams (Nelson et al. 2002, Homel and Budy 2008, Howell et al. 2016). Migratory bull trout can exhibit both potamodromy (Fraley and Shepard 1989, Downs et al. 2006, Hogen and Scarnecchia 2006) and anadromy (Brenkman and Corbett 2005) that can be associated with distinct
differences in growth rates (Brenkman et al. 2007, Stolarski and Hartman 2010). Specific growth differences within strategies may be associated with the timing and age of emigration from natal streams (hereafter termed juvenile outmigration), age at maturation, and variations in spawning frequency both between and within drainages (Rieman and McIntyre 1993). Although differences in the growth rates between resident and migratory forms have been well documented (Mogen and Kaeding 2005, Zymonas 2006), variability within individual forms among drainages has been less studied. Such stock differences may result in the need for distinctly different management strategies (Quinn and Deriso 1999). The judicious selection of an accurate and precise growth model has become particularly important for assessing stock status and recovery efforts for migratory bull trout inhabiting the North Fork Clearwater River (NFCR), Idaho. This population, isolated above Dworshak Dam, has been under a no-harvest regulation for an 11-year period (1994 to 2005). To evaluate the response to the no-harvest regulation, accurate information on fish age was needed (e.g. Erhardt and Scarnecchia 2013) as was a model that accurately and precisely depicted growth (Erhardt and Scarnecchia 2014). It was also imperative to assess and characterize the present life history strategies and behaviors of the population because char populations have been known to change life history strategies in response to environmental changes (Maekawa et al. 1994), and may have the potential to change with new management regulations. Objectives of this study were to 1) identify an accurate and precise model for describing growth of the migratory NFCR bull trout population through application of Schnute’s (1981) generalized model, and 2) characterize their life history, including growth rate differences among ages of juvenile outmigrants from natal streams, and age at sexual maturation. Knowledge and characterization of present life history variability, along with current demographic rates (Erhardt and Scarnecchia 2014), will furnish managers with knowledge to assess future population responses and aid in conservation efforts.
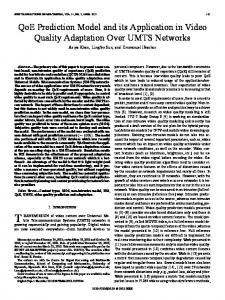
Methods The NFCR drainage, located in north central Idaho above Dworshak Dam, is inhabited by an isolated and threatened bull trout population that consists of both migratory and resident forms (Figure 1; Schiff 2004). The NFCR is a recovery core area in the U.S. federal recovery plan for bull trout (U.S. Fish and Wildlife Service 2002). The population in the drainage has about 20 documented spawning locations (Dupont and Horner 2008, Erhardt 2010). Migratory bull trout were sampled during the spring of 2005 by hook and line and gill nets in the lower reaches of the NFCR and slackwater interfaces of Dworshak Reservoir, where migrants from all upriver local populations have been documented staging prior to upriver summer or spawning migrations (Hanson et al. 2006). Pelvic fin rays were collected from 120 fish for age estimation. Fish were measured for total length (TL) to the nearest mm. Although maturation state were not determined for all fish because of the inability to sacrifice the fish, maturity (as well as gender) were determined for 80 of the fish by examining their gonads during surgical implantation of radio or acoustic telemetry transmitters (Hanson et al. 2006). Ages were estimated on 120 fish, ranging in TL from 280 to 664 mm, using pelvic fin rays and described in Erhardt and Scarnecchia (2013). During the age estimation, all fin ray samples were assigned an age at the time of juvenile outmigration (hereafter termed JOM) from the fin ray cross-sections. The criterion used to determine this age was an increase in spacing between annuli of at least 50%, where the annulus prior to the increase was used for the JOM age assignment. Measurements to determine the increase were made from the fin ray origin and a line of reference following methods developed for bull trout fin rays by Zymonas and McMahon (2009). Fish were not assigned a JOM age if they did not meet the criterion. This criterion was selected because preliminary analysis found substantial increases in increment widths (at varying ages), suggesting its utility for assigning an age of outmigration. Zymonas (2006) found evidence to support this method for bull trout in western Montana and Bull Trout Growth and Life History
329
Figure 1. Migratory bull trout sampling locations in the North Fork Clearwater River Drainage (NFCR), Idaho. Shaded areas represent known spawning areas of the migratory population (Schiff 2004, Hanson et al. 2006).
Ratliff et al. (1996) found rapid growth occurring when juvenile adfluvial bull trout of Lake Billy Chinook, Oregon, outmigrated from natal streams into larger rivers or reservoir. Such increases in spacing have also been utilized to determine a switch to lake rearing from natal stream rearing of rainbow trout (Rosenau 1991), and are also common in anadromous fish (e.g. for anadromous brown trout [Salmo trutta]; O’Neal 2008). Age-Length Model Selection Schnute’s (1981) generalized four parameter growth model was fitted to the age-length data (n = 120) to determine the best model to describe growth of the migratory bull trout population in
330
Erhardt and Scarnecchia
the NFCR. The youngest (t1) and oldest (t2) ages needed to be specified and were fixed to create a model that consisted of four parameters: a, b, l1, and l2 that predict total length (L) at age (t). The l1 and l2 parameters are estimated sizes at ages t1 and t2. The shape of the curve is determined by the parameters and , which under certain circumstances can allow the curve to represent many previously published growth models. The curve can represent the S-shaped logistic (when b = –1 and a > 0 in Case 1; Ricker 1975), the Gompertz (when a > 0 in Case 2; Gompertz 1825), and the von Bertalanffy (VB; when a > 0 and b = 1 in Case 1; von Bertalanffy 1938). The four main cases of the Schnute model take the forms:
Cases 2, 3, and 4, are sub-models of Schnute’s generalized model (case 1). Given the ubiquity of the VB in fish stock assessments, the VB subcase model was also evaluated, making five models in all that were assessed. All parameter estimates were found by the minimization of the sum of squares (SS) based on an additive error assumption and using a GaussNewton algorithm. Estimates were calculated through an iterative approach using SAS version 9.1 (SAS Inc. Cary, North Carolina). Models were compared using the Akaike information criterion (AIC). The model with the lowest AIC was selected; however all models with ∆AIC < 2 were assumed to have equal support for use with the data (Burnham and Anderson 2002). JOM Group Growth Comparisons To explore the dynamics of growth in migratory bull trout, the Schnute VB subcase was also fitted to the age estimates derived from pelvic fin rays for individual JOM groups. An analysis of the residual sum of squares (ARSS) proposed by Chen et al. (1992) was utilized to test for significant differences between the growth curves of the different groups with the null hypothesis that all curves are coincident, or each group is a sample from the same population. If the curves were not found to be coincident (a rejection of the null hypothesis;
a = 0.05), then bootstrap confidence intervals (CI’s) were calculated and examined to determine differences between specific groups. Bootstrapping was conducted by randomly resampling from the population (15 000 times) with replacement. Confidence intervals were calculated using a first order bias correction on the percentile method by adjusting on the basis of the proportion of bootstrap estimates less than the original estimates (Haddon 2001). The groups being compared were determined to be significantly different if bootstrap confidence intervals did not overlap on any one parameter. Bootstrap parameter clouds were also compared. Age at Sexual Maturation Ages were assigned and integrated with the maturation data determined by Hanson et al. (2006). We assumed the youngest mature fish was the youngest age of maturation. JOM age assignments by gender were also integrated with the maturity data to gain insight into growth, maturity, and outmigration relationships. Results Multiple cases of Schnute models fitted to the age-length data described growth of the NFCR bull trout for ages 3 to 11 with comparable effectiveness (Table 1; Figure 2). Although the case 3 age-length model had the lowest AIC (1265.4;
TABLE 1. Parameter estimation results for four growth models (Schnute 1981) and the VB subcase for NFCR migratory bull trout, from age-length data derived from pelvic fin rays. Parameter estimates were derived from non-linear regression. Parameter
Case 1
VB subcase
Case 2
Case 3
Case 4
n 120 120 120 120 120 l1 310.159 313.554 315.516 310.821 345.627 SE 12.661 10.594 10.170 11.722 6.448 95% CI 285.1 to 335.2 292.6 to 334.5 294.5 to 335.7 286.9 to 333.3 333.2 to 358.3 l2 628.490 615.838 610.216 624.022 702.809 SE 33.448 25.138 25.148 21.427 22.309 95% CI 562.2 to 694.7 566.1 to 665.6 563.0 to 666.6 584.9 to 671.0 660.2 to 746.8 a -0.060 0.138 0.233 0.000 0.000 SE 0.359 0.061 0.063 95% CI -0.77 to 0.65 0.02 to 0.26 0.11 to 0.38 b 3.067 1.000 0.000 2.461 0.000 SE 3.715 0.604 95% CI -4.29 to 10.43 1.26 to 3.69
Bull Trout Growth and Life History
331
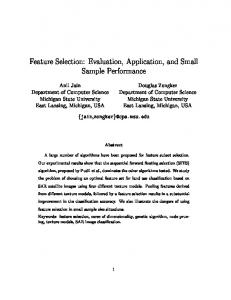
Figure 2. Schnute model cases (curves) fitted to age-length data for NFCR migratory bull trout. The age-length model is derived from age estimates from 120 pelvic fin rays collected during the spring of 2005. Points represent final age determinations. Horizontal dashed lines represent asymptotic length for the VB sub-case and for Case 2. TABLE 2. AIC values for four age-length growth models (Schnute 1981) and the VB subcase for NFCR migratory bull trout. Ages were assigned from pelvic fin rays collected in the spring of 2005. Model Case
Df
Parameters
AIC
DAIC
Deviance
Case 3 VB subcase Case 2 Case 1 Case 4
4 4 4 5 3
3 3 3 4 2
1265.42 1265.74 1266.13 1267.39 1278.79
0.00 0.32 0.70 1.97 13.37
249 733.8 250 391.7 251 203.3 249 668.6 283 854.0
Table 2), the VB sub-case, case 2, and the fully parameterized case 1, had AIC values of only 0.32, 0.70, and 1.97 lower. The case 4 model had the highest AIC (1278.8). Case 1, with a = –0.06, depicted unbounded growth while the VB sub-case and Case 2 were both asymptotic. Asymptotic lengths for these models were 766 mm for the VB sub-case and 690 mm for Case 2. 332
Erhardt and Scarnecchia
In comparisons of JOM growth rates, spacing between annuli increased by 50% or more following the first to third annuli for 98% (118/120) of the bull trout fin rays examined. Only two samples showed consistent annuli spacing throughout the cross-sections (no increases of 50% were found) and were therefore not assigned a JOM age. The percentages of the assigned ages were 14%
TABLE 3. Size and age distribution of juvenile outmigrant age groups (JOM 1, JOM 2, JOM 3) estimated from bull trout pelvic fin in the spring of 2005.
JOM 1
JOM 2
JOM 3
n 17 68 33 Size range (mm) 35 to 654 286 to 664 280 to 534 Median (mm) 510 415 388 SD 95.6 77.9 59.9 Age range 3 to 9 3 to 11 3 to 9 Median 6 5 5 SD 1.86 1.65 1.22
(17/120) for JOM 1, 57% (68/120) for JOM 2, and 28% (33/120) for JOM 3 (Table 3). A significant relationship was found between assigned JOM ages and overall growth rates. The null hypothesis for the VB subcase that the growth curves derived from age-length data for JOM groups were similar was rejected (F = 12.45, df = 115, P < 0.001), indicating that at least one growth curve among JOM 1, JOM 2, and JOM 3 was significantly different. All parameters successfully converged on estimates during the nonlinear iterations for growth curves for all three JOM groups (Table 4). Further analysis of bootstrap CI overlap indicated differences in parameter estimates between JOM 1 and JOM 3. The Schnute VB subcase converged on parameter estimates for 14 849/15 000 bootstrap iterations and found non-overlapping CI’s for the l2 parameter between JOM 1 and 3 only. Examining the bootstrap clouds shows clear differences between the JOM 1 and JOM 3 group with the JOM 2 group between the other two estimates (Figure 3). The youngest age assigned to a mature bull trout was age 4, and all mature fish spent at least 2 years after their assigned JOM age before maturing. Seven of the 80 fish for which maturation state was determined were juveniles. These fish ranged in TL from 280 to 397 mm (mean = 332 mm, SD = 38.2 mm; Figure 4). Three of these fish were assigned as age 3 of which two were males (one assigned to JOM 2 at 294 mm TL, and one to JOM 3 at 280 mm TL) and one was a female (assigned to JOM 2 at 342 mm TL). The remaining four immature fish were assigned to
TABLE 4. Parameter estimates of the VB subcase fitted to juvenile outmigrant age groups (JOM 1, JOM 2, JOM 3) of NFCR migratory bull trout. Ages were estimated from pelvic fin rays sampled in the spring of 2005. Bootstrap confidence intervals are also shown and were calculated using a first order bias correction on the percentile method (15 000 bootstrap samples with replacement). Parameter n l1
JOM 1
JOM 2
JOM 3
17 68 33
SE 95% CI Bootstrap CI
332.87 319.68 278.26 25.52 9.46 18.48 278 to 388 301 to 339 241 to 316 193 to 364 307 to 337 251 to 377
l2 SE 95% CI Bootstrap CI
627.67 626.16 487.75 20.21 24.37 26.30 576 to 632 578 to 675 434 to 542 596 to 701 538 to 673 419 to 547
a 0.26 0.11 0.34 SE 0.13 0.05 0.15 95% CI -0.02 to 0.53 0.00 to 0.22 0.03 to 0.66 Bootstrap CI -0.04 to 0.61 0.01 to 0.31 0.06 to 1.12
Figure 3. Bootstrap parameter estimate clouds from 15 000 non-linear regression iterations showing differences between ages of juvenile outmigration (JOM groups) of NFCR migratory bull trout. Parameters are from the Schnute (1981) growth model applied to age-length data. L2 represents length at age 11 and a is a curvature parameter.
Bull Trout Growth and Life History
333
Figure 4. Total lengths at ages for NFCR migratory bull trout. Ages were estimated from pelvic fin rays. All were fish were assigned an age of juvenile outmigration (JOM 1, JOM 2, and JOM 3).
Discussion
function with age as the exponent (Quinn II and Deriso 1999), clearly performed less effectively. Although Case 4 can be useful for modeling portions of a fish’s lifespan, it may be better suited for larval or juvenile stages because it depicts unbounded accelerated growth (Schnute 1981). This case does not seem biologically plausible for modeling bull trout growth from ages 3 to 11 because decreasing growth with age is a typical pattern for salmonids and has recently been reported for migratory bull trout (Al-Chokhachy et al. 2015). All of the remaining models incorporated this pattern and all adequately described growth for the age range studied.
Of the five models evaluated for characterizing growth of migratory bull trout from ages 3 to 11 in the NFCR, four of them performed comparably; only Case 4, which assumes growth is a power
Cases 1 and 3 both depicted unbounded decelerated growth while the VB sub-case and Case 2 were both asymptotic models; models that are bound by a hypothetical maximum size. With
age 4, of which two were males (one assigned to JOM 2 at 345 mm TL and one to JOM 3 at 325 mm TL) and two were females (both assigned to JOM 2 at 340 and 397 mm TL). There were no immature fish assigned to the JOM 1 group. The remaining 73 mature adults had TLs ranging from 334 to 654 mm (mean = 452 mm, SD = 71.1 mm). There were no mature age-4 fish that were classified into the JOM 3 group and there were no age 3 fish documented as mature. There was one mature female (425 mm TL) that was not assigned to a JOM group and was aged as 9.
334
Erhardt and Scarnecchia
equal support from the AIC values and similarities in the curve shapes, we conclude that there is no preferential use of any one of these four cases to describe growth of bull trout from ages 3 to 11 in the NFCR. Increased samples of older individuals may help determine if asymptotic models would improve model fit over unbounded models. Additionally, if assessments on the juvenile stages of populations are to be made, then research should focus on obtaining more information on the exact patterns of age-0 and juvenile growth. Owing to the large increases in incremental widths associated with juvenile migration patterns (this study; Lowery and Beauchamp 2015), multiple models (juvenile and adult), or models with an inflection point (S-shaped curves, e.g. Cases 1 and 2) that indicate a change in growth (from acceleration to deceleration; Schnute 1981), may be best to describe growth for the entire life span of NFCR migratory bull trout. The comparable effectiveness of four of the five growth models may in part be explained by substantial differences in individual fish growth associated with differences in age at outmigration. Fish emigrated from natal streams from ages 1 to 3, similar to that observed in other studies (Bjornn 1961, Fraley and Shepard 1989, Mogen and Kaeding 2005). Most emigrated at age-2 (58%), similar to that observed for adfluvial bull trout in Lake Billy Chinook, Oregon (54 %; Ratliff et al. 1996). The given percentage of age-2 fish among returning adults in our study does not, however, necessarily imply the same percentage among outmigrants. Differential mortality rates may have influenced the percentages as smaller age 1 outmigrants, and potentially age 0 outmigrants, may have been more susceptible to mortality than the larger age-2 or age-3 outmigrants (Downs et al. 2006). The optimal age at outmigration in salmonids may depend on numerous factors, including size-at-age of outmigrants, (Beckman et al. 1998, Halvorsen and Svenning 2000), physical habitat factors (e.g. discharge, depth, substratum) and ecological aspects of the habitat (e.g. productivity, presence of competitors and predators) in natal streams and migratory destinations (Downs et al. 2006, Giorgi et al. 1997, Reiser et al. 1997), timing of fry emergence (Hayes 1988), and the
coincidence of spawning adults increasing a risk to cannibalism (Pinto et al. 2013). It is also unknown when juvenile bull trout outmigration occurs in the NFCR drainage. Several studies document downstream movement occurring during the high spring flows and high fall temperatures (Downs et al. 2006, Muhlfeld and Marotz 2005), the latter coinciding with the presence of spawning adults. Further monitoring of outmigration age, timing, and growth at different stock densities in the NFCR would be useful in assessing the impacts of recovery efforts, especially since population densities and the size structure has recently been increasing (Erhardt 2014) and cannibalism and inter-specific competition may become more prevalent (Beauchamp and Van Tassell 2001). One limitation in our study was that we were unable to make any comparisons between JOM age and growth for specific natal streams because our sampling was conducted downriver of natal streams (after juvenile outmigration) and we did not know the origin of individual fish. The percentages of JOM age groups found in this study, and therefore growth variability, may be influenced by differences in densities, habitat, and community structure between natal streams. The percentage of JOM age groups is likely influenced by streams with the highest abundances of migratory bull trout. Whereas nearly all the migratory bull trout sampled in this study were assignable to one of three JOM groups, two fish did not meet criteria for being assigned to one of the three JOM strategies. A few fish may be emigrating at age 0 or switching from a resident form to a migratory form at later ages as documented with other char species (Nordeng 1983, Näslund 1990). Bull trout can emigrate as age-0 fish; Downs et al. (2006) collected age 0 juvenile outmigrants of adfluvial bull trout in Trestle Creek, Idaho, but was unable to document any age 0 migrants representative in the adult population based on otolith microchemistry. These age-0 outmigrants would be difficult to identify in the NFCR from inspection of annuli increment widths; other methods such as microchemistry would probably have to be used. The predominant ages at maturity observed in migratory bull trout in the NFCR (ages 4–5) are somewhat younger than several other studies have Bull Trout Growth and Life History
335
documented (ages 5 to 7, Flathead Lake system, Fraley and Shepard 1989; Goetz 1989). Mogen and Kaeding (2005) reported that migratory bull trout from the St. Mary’s River Drainage, Montana reached maturity and migrated upstream to spawn at age 5 at about 300 mm TL. Pratt (1985) found first year spawning occurring at ages 4 to 6 in the adfluvial population of Lake Pend Oreille, only 4 % of the age-4 class was mature. Frequent age-4 maturation of bull trout in the NFCR drainage is supported by the peaks in redd counts every four years since 1999 (Erhardt and Scarnecchia 2014). Although it is not specifically known why the NFCR bull trout population is maturing at younger ages than these other drainages, it may be related to the higher growth rates or longer growing seasons in the NFCR, including Dworshak Reservoir, than in many other localities (Erhardt and Scarnecchia 2013). Fish may respond to increasing growth rates with a decrease in age at maturity (Wootton 1998), a response documented for other char species (Forseth et al. 1994, Morita et al. 2000) and salmon (Gross 1991). Younger maturation in the NFCR may be associated with the younger ages of outmigration from natal streams into more productive river or reservoir habitats favoring faster growth. In contrast, slower growth and maturation at a smaller size (e.g., with resident fish) would result in the necessity for a higher survival rate to sustain the population, as there were fewer eggs per spawning female (Rieman and McIntyre 1993). The differences in growth rates, JOM groups, and ages and sizes at maturation within and among populations expresses the variability associated with different habitats, their productivity, presence of other species, genetics, and demographic factors. Rieman and McIntyre (1993) noted that within a population, as many as 12 to 16 combinations of juvenile outmigrant age classes, and numerous age classes represented in the spawning population, could be typical in any spawning year, in addition to interactions of migrant spawners with residents. In addition to the need for detailed studies of individual populations, comparative studies are needed to elucidate the causes of life history differences among populations. 336
Erhardt and Scarnecchia
Since assessments of the adult population size of the NFCR population have indicated increasing densities and overall size structure (Erhardt 2010, Erhardt and Scarnecchia 2014), further research should be directed towards understanding the trade-offs between growth, survival, migration, and maturation schedules because changes may alter current population trajectories. An increase in size structure through time, as adult densities increase, may be a function of an increase in the proportion of younger outmigrant ages, which may be directly influenced by density dependence. The results of this study underscore the life history complexity of the bull trout population within the NFCR. Additional investigations would be beneficial on life history variability, density dependence, and habitat capacity in individual natal streams. While population level modeling (without considering individual variability) may be more efficient and cost effective, it may not be adequate to assess changes in growth because of the shifts in life histories in response to density-dependence or other factors. Whether growth models that include individual variability will be useful for the NFCR population will depend on the level of precision needed to adequately assess growth of the population, which in turn may depend on the management goals. An understanding of life history and age specific migrations will be essential to assess and direct conservation efforts of threatened bull trout in other localities. It will be vital information to help determine if juvenile bull trout densities exceeding natal habitat capacity results in increased mortality (Ratliff et al. 2015), shifts in migratory behavior, or a combination of the two. The methods used in this study, growth modeling from the adult population, may be useful for assessing life histories of migratory bull trout populations. Acknowledgements We thank colleagues at the University of Idaho Department of Fish and Wildlife Resources for their efforts which contributed to this study. We acknowledge the Idaho Department of Fish and Game for providing funding and much assistance. Comments by three anonymous peer reviewers greatly improved this manuscript.
Literature Cited Al-Chokhachy, R., S. Moran, P. A. McHugh, S. Bernall, W. Fredenberg, and J. M. DosSantos. 2015. Consequences of actively managing a small bull trout population in a fragmented landscape. Transactions of the American Fisheries Society 144:515-531. Beauchamp, D. A., and J. J. Van Tassell. 2001. Modeling seasonal trophic interactions of adfluvial bull trout in Lake Billy Chinook, Oregon. Transactions of the American Fisheries Society 130:204-216. Beckman, B. R., D. A. Larsen, B. Lee-Pawlak, and W. W. Dickhoff. 1998. Relation of fish size and growth rate to migration of spring Chinook salmon smolts. North American Journal of Fisheries Management 18:537-546. Bjornn, T. C. 1961. Harvest, age structure, and growth of game fish populations from Priest and Upper Priest lakes. Transactions of the American Fisheries Society 90:27-31. Brenkman, S. J., and S. C. Corbett. 2005. Extent of anadromy in bull trout and implications for conservation of a threatened species. North American Journal of Fisheries Management 25:1073-1081. Brenkman, S. J., S. C. Corbett, and E. C. Volk. 2007. Use of otolith chemistry and radiotelemetry to determine age-specific migratory patterns of anadromous bull trout in the Hoh River, Washington. Transactions of the American Fisheries Society 136:1-11. Burnham, K. P., and D. R. Anderson. 2002. Model Selection and Multimodel Inference: A Practical InformationTheoretic Approach, 2nd ed. Springer-Verlag, New York, NY. Chen, Y., D. A. Jackson, and H. H. Harvey.1992. A comparison of von Bertalanffy and polynomial functions in modeling fish growth data. Canadian Journal of Fisheries and Aquatic Sciences 49:1228-1235. DeVries, D. R., and R. V. Frie. 1996. Determination of age and growth. In B. R. Murphy and D. W. Willis (editors), Fisheries Techniques, 2nd ed. American Fisheries Society, Bethesda, MD. Downs, C. C., D. Horan, E. Morgan-Harris, and R. Jakubowski. 2006. Spawning demographics and juvenile dispersal of an adfluvial bull trout population in Trestle Creek, Idaho. North American Journal of Fisheries Management 26:190-200. Dupont, J., N. Horner. 2008. Bull trout redd counts. In M. Liter, J. Dupont, and N. Horner (editors), 2005 Panhandle Region Fishery Management Annual Report. Idaho Department of Fish and Game Boise, Boise. Pp. 112-153. Erhardt, J. M. 2010. Age, growth, and stock status of migratory bull trout Salvelinus confluentus in the North Fork Clearwater River, Idaho, after 14 years of harvest protection. M.S. Thesis, University of Idaho, Moscow. Erhardt, J. M., and D. L. Scarnecchia. 2013. Precision and accuracy of age and growth estimates based on fin
rays, scales, and mark-recapture information for migratory bull trout. Northwest Science 87:307-316. Erhardt, J. M., and D. L. Scarnecchia. 2014. Population changes after 14 years of harvest closure on a migratory population of bull trout in Idaho. North American Journal of Fisheries Management 34:482-492. Forseth, T., O. Ugedal, and B. Jonsson. 1994. The energy budget, niche shift, reproduction and growth in a population of Arctic charr, Salvelinus alpinus. Journal of Animal Ecology 63:116-126. Fraley, J. J., and B. B. Shepard . 1989. Life history, ecology and population status of migratory bull trout (Salvelinus confluentus) in the Flathead Lake river system, Montana. Northwest Science 63:133-143. Giorgi, A. E., T. W. Hillman, J. R. Stevenson, S. G. Hays, and C. M. Peven. 1997. Factors that influence the downstream migration rates of juvenile salmon and steelhead through the hydroelectric system in the Mid-Columbia River Basin. North American Journal of Fisheries Management 17:268-282. Goetz, F. 1989. Biology of the Bull Trout, Salvelinus confluentus: A Literature Review. U.S. National Forest, Willamette National Forest, OR. Gompertz, B. 1825. On the nature of the function expressive of the law of human mortality, and on a new mode of determining the value of life contingencies. Philosophical Transactions of the Royal Society of London 115:513-585. Gross, M. R. 1991. Salmon breeding behavior and life history evolution in changing environments. Ecology 72:1180-1186. Haddon, M. 2001. Modeling and Quantitative Methods in Fisheries. Chapman and Hall and CRC Press, Boca Raton, FL. Halvorsen, M., and M.-A. Svenning. 2000. Growth of Atlantic salmon parr in fluvial and lacustrine habitats. Journal of Fish Biology 57:145-160. Hanson, J., E. Schriever, and J. Erhardt. 2006. Bull trout life history investigations in the North Fork Clearwater River Basin. Idaho Department of Fish and Game, Boise. Hayes, J. W. 1988. Comparative stream residence of juvenile brown and rainbow trout in a small lake inlet tributary, Scotts Creek, New Zealand. New Zealand Journal of Marine and Freshwater Re search 22:181-188. Hass, G .R., and J. D. McPhail. 1991. Sytematics and distributions of Dolly Varden (Salvelinus malma) and bull trout (Salvelinus confluentus) in North America. Canadian Journal of Fisheries and Aquatic Sciences 48:2191-2211. Hogen, D. M., and D. L. Scarnecchia. 2006. Distinct fluvial and adfluvial patterns of a relict charr, Salvelinus confluentus, stock in a mountainous watershed, Idaho, USA. Ecology of Freshwater Fish 15:376-387. Homel, K., and P. Budy. 2008. Temporal and spatial variability in the migration patterns of juvenile
Bull Trout Growth and Life History
337
and subadult bull trout (Salvelinus confluentus) in Northeast Oregon. Transactions of the American Fisheries Society 137:869-880. Howell, P., M. E. Colvin, P. M. Sankovich, and A. R. Hemmingsen. 2016. Life histories, demography, and distribution of a fluvial bull trout population. Transactions of the American Fisheries Society 145:173-194. Isely, J. J., and T. B. Grabowski. 2007. Age and growth. In C. S. Guy and M. L. Brown (editors), Analysis and Interpretation of Freshwater Fisheries Data, American Fisheries Society, Bethesda, MD. Jonsson, B., and N. Jonsson. 1993. Partial migration: niche shift versus sexual maturation in fishes. Reviews in Fish Biology and Fisheries 3:348-365. Lowery, E. D., and D. A. Beauchamp. 2015. Trophic ontogeny of fluvial bull trout and seasonal predation on Pacific salmon in a riverine food web. Transactions of the American Fisheries Society 144:724-741. Maekawa, K., S. Nakano, and S. Yamamoto. 1994. Spawning behaviour and size-assortative mating of Japanese charr in an artificial lake-inlet stream system. Environmental Biology of Fishes 39:109-117. Millstein, J., and C. E. O’Clair. 2001. Comparison of agelength and growth-increment general growth models of the Schnute type in the Pacific Blue Mussel, Mytilus trossulus Gould. Journal of Experimental Marine Biology and Ecology 262:155-176. Mogen, J. T., and L. R. Kaeding. 2005. Identification and characterization of migratory and non-migratory bull trout populations in the St. Mary River drainage, Montana. Transactions of the American Fisheries Society 134:841-852. Morita, K., S. Yamamoto, and N. Hoshino. 2000. Extreme life history change of white spotted char (Salvelinus leucomaenis) after damming. Canadian Journal of Fisheries and Aquatic Sciences 57:1300-1306. Muhlfeld, C. C., and B. Marotz . 2005. Seasonal movement and habitat use by subadult bull trout in the Upper Flathead River System, Montana. North American Journal of Fisheries Managment 25:797-810. Näslund, I. 1990. The development of regular seasonal habitat shifts in a landlocked Arctic charr, Salvelinus alpinus L., population. Journal of Fish Biology 36:401-414. Nelson, M. L., T. E. McMahon, and R. F. Thurow. 2002. Decline in the migratory form of bull charr, Salvelinus confluentus, and implications for conservation. Environmental Biology of Fishes 64:321-332. Nordeng, H. 1961. On the biology of charr (Salmo alpinus L.) in Salangen. North Norway. Part 1. Age and spawning frequency determined from scales and otoliths. Nytt Magasin for Zoologi 10:67-123. Nordeng, H. 1983. Solution to the “char problem” based on Arctic char (Salvelinus alpinus) in Norway. Canadian Journal of Fisheries and Aquatic Sciences 40:1372-1387.
338
Erhardt and Scarnecchia
O’Neal, S. L. 2008. Lessons to learn from all out invasion: life history of brown trout (Salmo trutta) in a Patagonia river. M.S. Thesis, University of Montana, Missoula. Pinto, M .C., J. R. Post, A. J. Paul, F. D. Johnston, C. J. Mushens, and J. D. Stelfox. 2013. Lateral and longitudinal displacement of stream-rearing juvenile bull trout in response to upstream migration of spawning adults. Transactions of the American Fisheries Society 142:1590-1601. Pratt, K. I. 1985. Pend Oreille Trout and Char Life History Study. Idaho Department of Fish and Game, Boise. Quinn II, T. J., and R. B. Deriso. 1999. Quantitative Fish Dynamics. Oxford University Press, Inc., New York, NY. Ratliff, D. E., S. L.Thiesfeld, G.Weber, A. M. Stuart, M. D. Riehle, and D. V. Buchanan. 1996. Distribution, life history, abundance, harvest, habitat, and limiting factors of bull trout in the Metolius River and Lake Billy Chinook, Oregon, 1983–1994. Oregon Department of Fish and Wildlife, Portland. Ratliff, D. E., R. Spateholts, M. Hill, and E. Schulz. 2015. Recruitment of young bull trout into the Metolius River and Lake Billy Chinook, Oregon. North American Journal of Fisheries Management 35:1077-1089. Reiser, D. W., E. Connor, K. Binkley, K. Lynch, and D. Paige. 1997. Evaluation of spawning habitat used by bull trout in the Cedar River Watershed, Washington. In W. C. Mackay, M. K. Brewin, and M. Monita (editors), Friends of the Bull Trout Conference Proceedings. Bull Trout Task Force, Trout Unlimited, Calgary, Alberta, Canada. Pp. 331-338. Ricker, W. E. 1975. Computation and interpretation of biological statistics of fish populations. Bulletin 191, Bulletin of the Fisheries Research Board of Canada, . Rieman, B. E., and J. D. McIntyre. 1993. Demographic and habitat requirements for conservation of bull trout. United States Department of Agriculture. Intermountain Research Station, General Technical Report, INT-302. Boise, ID. Rikardsen, A. H., and J. M. Elliot. 2000. Variations in juvenile growth, energy allocation, and life-history strategies of two populations of Arctic charr in North Norway. Journal of Fish Biology 56:328-346. Rosenau, M. L. 1991. Natal-stream rearing in three populations of rainbow trout in Lake Taupo, New Zealand. New Zealand Journal of Marine and Freshwater Research 25:81-91. Schiff, D. 2004. Life history characteristics and spatial and temporal distribution of bull trout, North Fork Clearwater River, Idaho. M.S. Thesis, University of Idaho, Moscow. Schnute, J. 1981. A versatile growth model with statistically stable parameters. Canadian Journal of Fisheries and Aquatic Sciences 38:1128-1140.
Stolarski, J. T., and K. J. Hartman. 2010. Comparisons of growth and condition of fluvial and resident brook trout within partially migratory populations. Fisheries Management and Ecology 17:33-39. U.S. Fish and Wildlife Service. 2002. Chapter 16, Clearwater River Recovery Unit, Idaho. In U.S. Fish and Wildlife Service (editors), Bull Trout (Salvelinus confluentus) Draft Recovery Plan. Portland, OR. von Bertalanffy, L. 1938. A quantitative theory of organic growth. Human Biology 10:181-213.
Wootton, R. J. 1998. Ecology of Teleost Fishes. Kluwer Academic Publishers, Dordrecht, The Netherlands. Zymonas, N. D. 2006. Age structure, growth, and factors affecting relative abundance of life history forms of bull trout in the Clark Fork River Drainage, Montana and Idaho. M.S. Thesis, Montana State University, Bozeman. Zymonas, N. D., and T. E. McMahon. 2009. Comparison of pelvic fin rays, scales, and otoliths for estimating age and growth of bull trout, Salvelinus confluentus. Fisheries Management and Ecology 16:155-154.
Received 10 January 2015 Accepted for publication 20 April 2016
Bull Trout Growth and Life History
339