HSI 2010
Rzeszow, Poland, May 13-15, 2010
GVIS: a framework for graphical mashups of heterogeneous sources to support data interpretation Luca Mazzola1, Davide Eynard1 and Riccardo Mazza1 USI - Università della Svizzera italiana, Lugano, Switzerland {luca.mazzola, davide.eynard, riccardo.mazza}@usi.ch
1
Abstract. This paper introduces the GVIS framework and describes one of its applications built in support of user profile awareness. This application is aimed at opening part of users' profiles to their inspection by exploiting a graphical representation of their personal data. We developed an infrastructure for presenting these high level information in a configurable and adaptable way. The framework we developed is able to retrieve data from heterogeneous sources just by writing a small adapter and allows us to mix together different streams through an XML configuration that relies on a set of operations for elicitation of the most interesting fragments. The final goal is to provide an easily readable graphical representation of the most relevant information, in order to support the human visual system, more capable to have an overview with this kind of solution than with text. As an example application we have mashed up URLs from user browsing history with tags coming from del.icio.us: the resulting output, represented as a pie chart, shows the most relevant subjects followed by a user. Some open issues and problems, we hope to research next, are presented in the conclusion part. Keywords: User Modeling, Personalization, MashUp, Folksonomies, Information Visualization.
I. INTRODUCTION
I
NSIDE E-Learning environments, the two concepts of customization and personalization are very important, as they both allow the system to provide a user experience which is unique and really tailored on users. On the one hand, customization relies on parameters that are (usually) explicitly provided, requires some kind of knowledge about the system, and allows users to foresee its future behavior. On the other hand, personalization relies on a profile which is either built explicitly or implicitly out of user interactions with the system, it is based on knowledge Corresponding author: Luca Mazzola – USI, Università della Svizzera Italiana - ITC, Istituto di Tecnologie della Comunicazione via Buffi 13, CH 6900 Lugano – Switzerland Tel: 0041 58 666 4527 Fax: 0041 58 666 4647
[email protected] The original development of GVIS tool was partially supported by EU FP7 project GRAPPLE (215434). The authors would like to thank all the project partners for all the support and contribution provided.
about the user, and makes the system adaptive to user behavior [1]. While personalization has some advantages over customization (i.e. it does not require users to know anything about the system, and it provides a less repetitive experience), its adoption is still facing some issues. One of the main problems related to the creation of profiles is the perception that users have of them and the trust they have in the system that manages their data. Literature shows that opening a profile to user inspection (applying the so called “Open Learner Model” approach [2]) could help to address this issue: in fact, finding an easy way to show users their profile (or parts of it) helps in gaining their trust and creating an incentive for their participation. GVIS is an infrastructure we are developing, able to extract data from different sources and enable instructional designers to easily create adaptive indicators of the learning state for learners and tutors [3]. An important characteristic of this infrastructure is the possibility to connect heterogeneous data sources (databases, Web services, and so on), only by writing a small piece of adapter code. Then, just by modifying an XML configuration file, administrators can create graphical widgets that show one or more interesting characteristics of user profiles. In this paper we describe a specific GVIS application, which shows the part of a user profile which is related to her browsing habits and tries to describe it with the support of community-provided tags. With the exception of a conversion tool built for the service which provided tags (delicious.com), the whole application relies only on existing GVIS modules or configurations. The resulting output is a graphical summarization of user’s browsing history, according to the main tags that categorize its URLs. The paper is organized as follows: in Section II we describe our approach, motivating our choices for user browsing data and related annotations; in Section III we show the system infrastructure and describe its main components; in Section IV we show some results provided by our tools and evaluate them in Section V; finally, in Section VI we draw our conclusions and directions for future work.
II. OUR APPROACH
III. SYSTEM INFRASTRUCTURE
Our main idea is to open part of users’ profiles to users themselves, showing information related to their browsing habits. We decided to work on URLs as they represent a kind of data which is very easy to mash up between different systems: every URL points to one specific Web resource, and there is already plenty of metadata about them available on the Internet. The first step in creating our mash up has been to identify its main data sources. To analyze users’ browsing habits we need at least two different sources: a collection of logs capturing visited URLs and some kind of classification of the matching Web pages. Within an ELearning system (where user clicks might have already been collected) it is not difficult to have both, for instance if we assume that logged pages are local to the system and classification -given the limited size of the system- is built top-down as a taxonomy. However, the task becomes more complex when captured URLs represent generic pages on the Web, such as external links provided within the system itself: in this case a top-down approach is not suitable, while a bottom-up categorization such as the one provided by a folksonomy might provide better results. For our project we decided to approach the problem of generic URLs, for different reasons: first of all, most of the Web pages “in the wild”, as opposed to the ones within the E-Learning system, can be assumed to be accessible from anywhere - while this is mostly false in the other case, especially if the system provides restricted accesses- even if metadata is available for pages in a closed environment (they are still represented by valid URLs, so annotations are possible for them), there just might not be enough to be statistically relevant; finally, datasets for generic URLs are easily available as they are automatically saved by most of the browsers as a “browsing history”. To ease our work, we chose to use just one browser and collected Firefox history database for our tests. With a generic browsing history as a data source, folksonomies as a source of metadata seemed the most suitable choice. In these systems (named after folks and taxonomies) users can associate freely chosen tags to the resources, producing knowledge which is useful for them but also available for the entire community [4]. As the work of categorization is performed by users themselves, folksonomies are democratic, scalable, current, inclusive and have a very low cost [5]. Of course, this bottom-up process also has its drawbacks: due to the absence of a unique coherent point of view, tags cannot be easily organized in a hierarchy, there is no synonym control, and systems might lack in precision and recall [6]. Aware of both advantages and limits of folksonomies, for our specific case we chose to use Delicious as our tag provider, as it already has a huge quantity of metadata and is able to provide results which are statistically good.
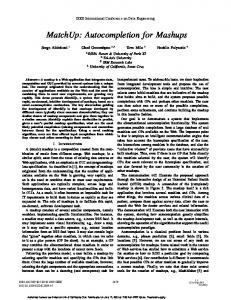
The output of our tool as seen by the final user is a flash based animation that represents, with a pie chart metaphor, the relative frequency of every tag. In order to achieve this result, we relied on a highly configurable infrastructure based on a three layer tier: extraction, aggregation and widget creation. This schema follows the most important steps found in every data processing path: retrieve raw data, work to make information emerge and then present it in the most suitable way [7]. A. Data Extraction Figure 1 shows the actual infrastructure of GVIS, with a detail on the connection with heterogeneous sources. The system is very flexible and the behavior of its main components can be easily changed just by modifying their matching XML configuration files. For our purpose, we wrote configuration profiles for two different data sources: a database for the browsing history (as Firefox saves it in a SQLite DB) and a SPARQL endpoint for the tags. The database configuration just requires three different kinds of parameters: authentication credentials, a SQL query, and the desired format for the output which is piped to the aggregator module. The SPARQL configuration, similarly, just requires the endpoint access information, a SPARQL query, and the output format.
Fig. 1. The actual infrastructure for our tool.
Actually, Delicious does not provide access to its tags through a SPARQL endpoint, but it exposes an API which, given an URL, returns a list of the latest tags that have been used to categorize it. The information returned by the API is structured and serialized in a standard format (JSON), however to the extent of our knowledge it does not share its schema with other tag-based systems, nor there are
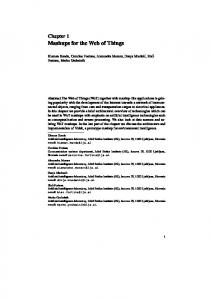
Fig. 2. The operation pipelines applied for the actual examples: C1 is the common part, while C2 represents logical operations to produce the browser history navigation chart.
plans to do this in the future. As a result, every time we wanted to access tags using another Web service, we would need to write a new adapter for GVIS. To address this problem, we have built a more generic conversion tool that takes Delicious API results as an input, converts them into RDF on the fly (following a given ontology schema), and finally exposes them as a SPARQL endpoint (using Joseki, http://www.joseki.org). The advantages of this tool are manifold: first of all, it allows GVIS to access tag information from a generic SPARQL endpoint, using the same query regardless of which folksonomy is being queried; thus, information is not only independent from the data source but it is also easier to merge it inside one single place, providing something that was not previously available (the union of different tag-based systems); finally, as its code is not bound to our particular application, it can be reused for other purposes (as we actually did while developing the prototype for the semantic annotation system at http://davide.eynard.it/elc/). B. Data aggregation GVIS provides a set of “out of the box” operators to support data aggregation. These operators provide some common aggregation patterns such as group by, filter by threshold, order by, etc. Once the raw data is available, our following step consists of applying a subset of operators in charge of expressing the transformation logic from source data to final information. The sequence of operations has a basic common part (see C1 in Figure 2), used to retrieve del.icio.us tags from our SPARQL endpoint, and a part which is specific for the browsing history, shown as C2. C1 only contains a grouping operator, which allows tags to be grouped and counted when information about a single URL is requested (like in the process shown on the left part of the image). C2 is more complex and it is used to categorize the whole browsing history: it first uses a filter operator, after the extraction of visited domains from the DB, in order to keep only the most visited ones; then it applies a loop operator to get tags related to every single URL in the list; then, after the aggregation of common entries (tags), another threshold is applied to remove the long queue of tags; finally, an order by operator is used to return the tags ordered by occurrences (needed by the visualization component to show the pie slices in decreasing order of magnitude).
C. Visualization The Visualization module is the part of the system that actually produces the final output. It is divided in two components: a container, called dashboard, and the actual contents, represented by the graphical widgets that can be opened within the dashboard. The pie charts we have been using in this project represent one of the possible visualizations available within the system, currently provided by an open source library called Open Flash Chart. Of course, thanks to the modularity of our tool, it would be possible to import other libraries to provide more common metaphors for tags such as tag clouds or weighted lists. However, we thought that for this particular case the pie chart would have been a more suitable metaphor, as it does not just show magnitudes, but also relative proportions between different interests. Moreover the particular widgets we chose provides the possibility to interactively explore the detail of every single result. From the configuration point of view, visualization also has its own XML parameters: the widget type, its parameters (such as title and colors), and the name of the data aggregation pipe it has to get data from. IV. EXAMPLES Exploiting the operands described in the data aggregation section we were able to build two different types of applications. The former is simpler, accepting a single URL as input and returning a pie chart depicting its most frequent tags. The latter is more complex: its input is the whole browsing history of a user and, exploiting the component previously described as C2, it returns a pie chart depicting user’s main areas of interest. A. Websites The first application, that can be used to have a quick glance at the main tags characterizing a website, is very simple and comparable –in term of information providedwith the original delicious web interface. However, it is enriched by a graphical presentation of data, which is alternative to the classical tag cloud: at a first glance, it gives an immediate idea of which are the most important keywords and their relative weights; then, by moving the mouse on a pie slice, it is possible to see how many tags have been returned by the system and which percentage of the whole set they cover.
In Figure 3 two different websites are compared. On top, one with a relatively low number of keywords is characterized by a very effective visualization. At the bottom, instead, an unfiltered view for a more famous portal is depicted, showing how the number of tags returned by the system can negatively affect visualization, both from a technical viewpoint (the library is not capable of dealing with all those data) and from the user’s point of view (information is unreadable or too much to be correctly interpreted). This result justifies the use we did of threshold levels to simplify the output, trying to make useful information emerge from a huge amount of data.
Fig. 3. Two different sites analyzed using our tool. Top: http://corsi.elearninglab.org (our university eLearning platform). Bottom: http://www.ieee.org (the IEEE organization institutional website)
Another interesting experiment we did with single URLs is about transient behaviors: we chose a website which was newly created for a conference and decided to follow its growth, at intervals of one month, using our tool. Figure 5 shows three screenshots taken in three different moments: the first one corresponds to an early stage of the website’s life, the middle one has been taken after one month, and the last one after two months. The three images show an interesting result: while time passes, the most important subjects of the conference emerge, but after a while the relative weights of the main areas seem to remain stable.
B. Browsing history The second application we developed shows the most relevant subjects, in terms of tag frequency, characterizing some user’s browsing habits. While the visualization appears identical to the previous one, the process needed to build it is much more complex: as we wanted to test the system with real data, we asked different users a copy of their Firefox history files; to protect personal information, we anonymized user data by mapping potentially sensible URLs (containing user-dependent parameters) to their matching domains; then, the final result is built on this anonymized data.
Fig. 4. The browsing history for two different people. Top: an adult with interest in economy and trekking. Bottom: a younger person mainly watching streaming movies.
Figure 4 shows two profiles, in which the most interesting areas are quite evident (in the left one, finance and mountain/trekking, and in the right one video streaming resource). Of course other less personal tags are also present, such as google, search, email, and web2.0 (meaning that these users are not actually interested in these topics, but rather they use search engines, check email and browse social websites). In another experiment, we compared the charts obtained from two “high tech” profiles. The peculiarity of this example is that both users had a huge history file and the resources they browsed were normally bookmarked by many people. As a result, the total number of collected tags was much higher than in previous examples. Despite of the
Fig. 5. The ENTER2010 conference website (http://www.enter2010.org) analyzed in three different moments: (from left to right) an early one, just after the conference announcement, after a month from creation and after two months.
similarity between the two users (and of the filters we had to apply to avoid having too many tags to visualize) it was still possible to identify profiles specificities: in one widget an interest in open source emerges (with keywords like opensource, ubuntu, linux, free, distros, and so on), together with software development through scripting languages (tags: shell, programming, scripting, zsh); in the other widget a less specific profile emerges, characterized by a higher number of tags which were related to areas like linux, Moodle and XML, without a predominant one. V. SYSTEM EVALUATION As the purpose in this paper was both to show our methodology for the creation of graphical mashups and to describe its application for a specific case, we divided our evaluation in two different parts: the first one which deals mainly with the system, and the second which deals with the graphical representations we obtained. TABLE 1: PERFORMANCE EVALUATION OF THE TAG-RETRIEVAL COMPONENT.
User 01 02 03 04 05 06 07 08 09 10
Domains 70 125 223 23 49 84 89 11 12 72
Tag/Domain 52 37 39 33 20 34 38 72 42 37
Time (sec) 211 200 385 32 60 130 125 27 17 116
For what concerns the system, we were satisfied to see that the new tool has been created with less than 180 lines of XML code, of which about 60 belonged to the extraction module, about 90 to aggregation and 30 to visualization. The fact that the aggregation part is bigger is not surprising, as it implements the pipeline of operators that group and filter URLs and tags. Of course the Delicious conversion tool has also to be taken into account, but it is worth noting that the only operation it did
was to convert information from a structured format to another (albeit more expressive) one. System performances are also satisfying, especially considered that no caching is currently implemented so getting metadata for every URL currently requires a connection to the Delicious API. Table 1 shows information related to the creation of user profiles' representations: columns describe, respectively, the user ID, the number of considered domains (selected as they have been accessed at least 10 times), the average number of del.icio.us tags for each selected domain, and the average time required to collect all the data according to ten successive executions. We only focused on download time as it alone represented the greatest part on the whole processing time (experimentally estimated as more than 90% of the total execution time). As it appears from table data, there is a correlation between the number of selected domains and the total download time (as each domain requires a Web connection), also influenced by the number of tags that match every single domain (as the downloaded data increases with tags). Of course, there are other factors that this analysis did not take into account, such as the quality of the internet connection, the load on the accessed servers, and so on. As a conclusion, we can say that the overhead introduced by the realtime access to external sources does not affect much the visualization of a single website -as it remains almost immediate-, while showing a large user history might require up to some minutes. To test the effectiveness of the visualization we first built a heterogeneous group, composed of ten people with different ages and interests, and asked them their Firefox history. Then we showed them the resulting pie chart and asked a feedback about it. The result is that all of them more or less recognized their most relevant areas of interest within the pie chart. The ones who were more technically skilled recognized that the presented information was interesting, but at the same time that they were already aware of it. This said, there are still a couple of issues we would like to address. The first of them is related to visualization: as
shown in Figure 3b, pie charts suffer information overload and become very difficult to read when the number of different tags characterizing either a website or a browsing history becomes too high. There are different solutions for this, dealing either with the widget itself or with the filters applied to the data that is being visualized. As an example of the first case, we could have applied a new feature provided by GVIS which is called “adaptive configuration”: depending on the quantity of information available, different widgets can be used to always show results in the best possible way. Our limit in this case was that the widget library we used did not provide valid alternatives to pie charts in case of huge quantities of data. We then chose to apply a filtering solution, hiding the tags that were less used according to some thresholds. Despite of the positive feedbacks we had, we believe we could obtain better and more significant results by better tuning the system and providing more flexible (and maybe usercustomizable) thresholds. Another limit is the one inherent to the use of tags for categorization: as the same URL might be tagged by many different people, tags might appear in different languages, with typos, synonyms, or in general variations of the same word. This is of course less relevant when URLs are well known and users statistically converge towards few common terms, but it might affect results if user browsing habits are biased towards websites which have not been tagged by many people. One way to address this problem could be clustering tags according to their similarity and finding a semantic grounding for them [8]: this would provide a more compact representation of the same profile with better semantics. VI. RELATED WORK We are not aware of other projects that adopt a fully customizable approach for visualizing user’s navigation history in term of interest areas based on a folksonomy, even if some other approaches have already appeared in literature [9]. We know that visual representations based on tag-cloud metaphors are quite common for presenting data based on keywords classification [10]. We chose to visualize the user profile because this is a quite common automatic activity done by system to offer them a real customized experience. This is due to the fact that one of the most crucial aspects in the development of interactive computing systems for human use is its user interface [11]. The user interface is a key factor to judge the quality of the users experience: interaction between users and computers is investigated in order to make computers more usable and receptive to the user’s needs [12]. In this way it becomes a key factor to judge the quality of the users’ experience: studies in the field of Human-Computer interaction [13] reveal that there is often an important gap between the expected behavior and the feeling perceived by users. A possible solution to bridge this gap is to adapt the user interface to the users’ characteristics, preferences,
knowledge, and tasks [14]. The principle underpinning this feature is the possibility to adapt some systems’ characteristics to one or more characteristics of the user. Adaptivity has been used for many years in user interfaces to customize some aspects of the graphical layout. The primary objective behind the development of GVIS is to allow a fully customizable and adaptive interface to learner’s model in TEL context [15]. Student data is collected in the student model, which is a component of adaptive systems that maintains an accurate representation of the user’s current state, enabling the system to perform adaptation based on the information stored in the model [16]. In the field of Technology Enhanced Learning, the adaptation of contents to the user’s knowledge and cognitive characteristics [17] is a hot topic, as supporting the current learning needs of the learner, and enabling it to offer a real, customized experience is a well suited approach to engage the learner more in the educational experience [18]. Even if the original aim to create models was to adapt the content or the presentation to single user’s need, users were not aware of the presence of such a module in their environment. But opening up this internal model to users inspection could be useful for different reasons, in particular for self-reflection [19]. In this view, the model is also a useful source of information that can be stressed to enhance user’s commitment to the online experience and to foster his/her self-reflection processes. More recently some attention has been devoted to the aspect of social interaction supported by online platforms, and the representations provided have also been modified accordingly [20]. Despite the large body of research on open learner models (OLM) that has been conducted over the last 10 years, none of those studies have focused specifically on the visualization aspects of the presentation of the learner model. VII. CONCLUSIONS In this paper we have presented GVIS, a modular system able to collect data from heterogeneous sources, aggregate them to create new knowledge and graphically represent the results as smart widgets. The application examples we have shown are related to the possibility to open up user profiles for self-inspection: we focused on a specific aspect of user profile, represented by the browsing history, and built a synthetic view of users’ main interests, displaying a pie chart of the main tags associated with the most visited URLs. A set of users who have tested the system with their own browsing histories reported that they recognized themselves in the visualized profiles. Our final remarks are focused towards two different directions: the one related to the GVIS system as a whole and how it performed in this particular application, and another one which is more related to the application itself. From the system perspective, we think that GVIS performed well as an aggregator of heterogeneous sources, allowing us to build the two examples we showed just by
specifying few lines of XML. The system is versatile enough to access different families of data sources (such as SQL databases, SPARQL endpoints, and web services), and expressive enough to provide us the operators we needed to group, order, filter and mash up the results coming from the two sources we queried. On the other hand, the long times required to collect tags for users' browsing history databases clearly demonstrated the need for a caching system or a tool to answer queries in parallel. For what concerns the specific application we developed with GVIS, we found the results encouraging and worth a more accurate inspection. In particular, we think we could direct our efforts towards the following directions: information visualization, and how to better exploit the information we have in order to provide a compact, albeit expressive graphical representation of a user profile; tag semantics, and how to use it to cluster together tags into families that can better describe users' interests; and finally an in-depth user evaluation, relying on structured interviews which should not only provide us information about the correctness of our profile widgets, but also about its usefulness within the specific system they are embedded into.
[6]
[7]
[8]
[9]
[10] [11]
[12]
[13]
[14]
[15]
REFERENCES [1]
[2]
[3]
[4] [5]
Eynard, D. (2008). Using semantics and user participation to customize personalization. HP Labs Technical Report HPL-2008197. September 2008. http://www.hpl.hp.com/techreports/2008/HPL2008-197.html Bull, S., Kay, J.( 2007). Student Models that Invite the Learner In: The SMILI:() Open Learner Modelling Framework. Int. J.Artif. Intell. Ed. 17, 2 (Apr. 2007), 89-120.E Mazzola, L. and Mazza, R. 2009. Toward Adaptive Presentations of Student Models in eLearning Environments. In Proceeding of the 2009 Conference on Artificial intelligence in Education: Building Learning Systems that Care: From Knowledge Representation To Affective Modelling V. Dimitrova, R. Mizoguchi, B. du Boulay, and A. Graesser, Eds. Frontiers in Artificial Intelligence and Applications, vol. 200. IOS Press, Amsterdam, The Netherlands, 761-762. Emanuele Quintarelli. Folksonomies: power to the people. June 2005. http://www-dimat.unipv.it/biblio/isko/doc/folksonomies.htm. Ellyssa Kroski. The hive mind: Folksonomies and user-based tagging, December 2005. http://infotangle.blogsome.com/2005/12/07/the-hive-mindfolksonomies-and-user-based-tagging/.
[16]
[17]
[18]
[19]
[20]
Harry Halpin, Valentin Robu, and Hana Shepard. The dynamics and semantics of collaborative tagging. In Proceedings of the 1st Semantic Authoring and Annotation Workshop (SAAW’06), 2006. Venugopal, K. R., Srinivasa, K. G., and Patnaik, L. M. 2009 Soft Computing for Data Mining Applications. 1st. Springer Publishing Company, Incorporated. C. Cattuto, D. Benz, A. Hotho, G. Stumme, Semantic Grounding of Tag Relatedness in Social Bookmarking Systems, 7th International Semantic Web Conference ISWC2008, LNCS 5318, 615-631 (2008). Gwizdka, J. and Bakelaar, P. 2009. Tag trails: navigation with context and history. In Proceedings of the 27th international Conference Extended Abstracts on Human Factors in Computing Systems (Boston, MA, USA, April 04 - 09, 2009). CHI EA '09. ACM, New York, NY, 4579-4584. Moulaison, H.L. Social tagging in the web 2.0 environment: author vs. user tagging. Journal of Library Metadata 8, 2 (2008), 101--111. Shneiderman, B. & Plaisant, C. (2004). “Designing the User Interface: Strategies for Effective HumanComputer Interaction. 4th ed.” Addison Wesley, 2004 ISBN 0-321-19786-0 Maglogiannis, I., Karpouzis, K., Bramer, M. (2009). “Part II: Intelligent human- computer interaction.” Special Issue on Emerging Artificial Intelligence Applications and Innovations: Papers from AIAI 2006. Appl. Intell. 30(1): 1-2 (2009) Mahlke, S. & Lindgaard, G. (2007). “Emotional Experiences and Quality Perceptions of Interactive Products.” In: J. Jacko (ed.), Human-Computer Interaction, Part I, HCII 2007, LNCS 4550, 164173. Berlin: Springer. (pp. 164-173). Shankar, A., Louis, S. J., Dascalu, S., Hayes, L. J., Houmanfar, R. (2007). User-context for adaptive user interfaces. In Proceedings of the 12th international Conference on intelligent User interfaces (Honolulu, Hawaii, USA, January 28 - 31, 2007). IUI '07. ACM, New York, NY, 321-324 Fischer, G. (2001). “User Modeling in Human-Computer Interaction.” In User Modeling and User-Adapted Interaction 11, 1-2 (Mar. 2001), 65-86. Dolog, P., Henze, N., Nejdl, W., and Sintek, M. 2004. “Personalization in distributed e-learning environments.” In Proceedings of the 13th international World Wide Web Conference on Alternate Track Papers & Posters (New York, NY, USA, May 19 - 21, 2004). WWW Alt. ’04. ACM, New York, NY, 170-179. Graf, S. & Kinshuk (2008). “Learner Modelling Through Analyzing Cognitive Skills and Learning Styles.” In Adelsberger, H., Kinshuk, P., Pawlowski, J., and Sampson, D. (Eds.) “Handbook on Information Technologies for Education and Training. 2nd.” Springer Publishing Company, Incorporated. Pp 179-194. Conlan O., O’Keeffe I., Brady A., Wade V. (2007) “Principles for Designing Activity-based Personalized eLearning” IEEE International Conference on Advanced Learning Technologies, pp. 642-644, Seventh IEEE International Conference on Advanced Learning Technologies (ICALT 2007). Bull, S (1997). “See Yourself Write: A Simple Student Model to Make Students Think.” In Jameson, A., Paris, C., and Tasso, C., editors, User Modelling (Proceedings from 6th International Conference, UM 1997), pages 315-326. Mazzola, L. & Mazza, R. (2009). “Supporting learners in Adaptive Learning Environments through the enhancement of the Student Model.” In Proceeding of Human Computer Interaction International 2009. San Diego, CA. 20-23/07/2009.