Habitat connectivity is determined by the scale ... - Wiley Online Library
Recommend Documents
protocols.html). SPATIAL GRAPHS. As the principal vector of dispersal of invasive species in this sys- tem is entrainment on recreational boating equipment, we ...
domains, as well as the maximal size of protein domains that fold under solely thermodynamic. (rather than ... unfolded state of the chain by an ''all-or-none'' phase transi- .... sented as DG = Lg + rBLL2/3, where g is free energy of one residue.
1Leni and Peter W May Department of Orthopaedics, Mount Sinai School of Medicine, New York, NY, USA .... The gray value represents the variation in.
May 30, 2018 - ing of the genetic architecture of essential traits in focal species is crucial .... a particular EM fungal species that maps near a linkage group de-.
dent t-test or MannâWhitney U-test were used to compare .... CRF01_AE and other subtypes (P = 0.895; MannâWhitney .... 24 Luu QP, Dean J, Do TT et al.
Macular thickness as determined by optical coherence tomography in relation to degree of myopia, axial length and vitreous chamber depth in Malay subjects.
Jul 16, 2015 - Conservation and recovery plans for endangered species around the world, including the US. Endangered Species ..... decades for success (Appendix C: Tables C1âC4). ..... comparisons, scale drives some of the observed.
Jul 16, 2015 - Abstract. Conservation and recovery plans for endangered species around the world, including the US ..... with ecological concern data from recovery plans and (B) the 86 sub- ..... SHAPE metric is best suited to the HUC 4 to.
blage differences between perennial and intermittent sites were considerably larger than differences between degrees of intermittency (D.M. Warfe & N.E. Pettit,.
breeding populations revealed a link between the host's migratory pro- gramme and its ... was best explained by breeding location alone, whereas no clear pattern emerged for ..... The European sampling sites of our Northern and. Southern ...
by the mosaic of landscapes (With 2004, Baguette and Van. Dyck 2007). Thus, while dispersal acts to spatially structure metacommunities, their structure also ...
Developer/contact information. Norman M. Bradburn. Studies conducted by .... http://www.nfer-nelson.co.uk/default.asp. Versions. GHQ-12, GHQ-20, GHQ-28, ...
Mar 7, 2017 - for the dry season and 0.727 for the wet season indicating a good model ..... the Euclidean distance spatial analysis tool in GIS (Rood, Ganie, &.
Provision of winter set-aside fields for summer territory selection by yellowhammers is an important consideration for farm management where conservation is a ...
George Bernard Shaw (1856â1950), polymath, playwright, Nobel prize winner, and the most prolific ..... fisher to then enter the HPZ for non-herbivorous species.
1Evolution and Ecology, University of California, Davis, California 95616 USA. 2School of Engineering, San Francisco State University, San Francisco, ...
P = 0.005) and no general selection or avoid- ance of habitats in the second year (N = 195, v2. 3 = 5.9, P = 0.12). For owls with transmitters, the average.
Apr 1, 2012 - ... but information on home ranges is difficult to retrieve from species presence/absence data collected in occupancy studies. ...... and availability of resources may drive variation .... the occupancy rate of spatially rare or hard to
Mar 7, 2017 - This is an open access article under the terms of the Creative Commons Attribution License, which permits use, ... Management, Kwame Nkrumah University of ...... habitat and corridor in Lower Shivaliks area of Uttarakhand.
Nov 13, 2016 - birds; technicians were trained through a stan- dardized process at the ...... ter, Laurel, Maryland, USA. Shea, K., and P. Chesson. 2002.
*Laboratory of Animal Ecology, Department of Biology, University of Antwerp, ... of Kenya, Nairobi, Kenya; â¡Department of Zoology, University of Oxford, Edward.
2013). The most common tool used to .... GIS tools were used to compare VPS positions and the ...... resonance imaging and on-line venous oxygen monitoring.
of Sri Lankan freshwater terrapins outside the protected area network. Suranjan Karunarathna1. | A. A. Thasun Amarasinghe2. | Sujan Henkanaththegedara3.
Habitat connectivity is determined by the scale ... - Wiley Online Library
Mar 15, 2018 - pressure from fragmentation (With & King, 1999). As such, the per- ... relative to individuals with the forR allele (rovers) (Osborne et al.,. 1997).
|
|
Received: 18 September 2017 Revised: 11 February 2018 Accepted: 15 March 2018 DOI: 10.1002/ece3.4072
ORIGINAL RESEARCH
Habitat connectivity is determined by the scale of habitat loss and dispersal strategy Allan H. Edelsparre1,2
| Ashif Shahid1 | Mark J. Fitzpatrick1,2,3
1 Department of Biological Sciences, Integrative Behaviour and Neuroscience Group, University of Toronto Scarborough, Toronto, Ontario 2
Department of Ecology and Evolutionary Biology, University of Toronto, Toronto, Ontario 3
Department of Cell and Systems Biology, University of Toronto, Toronto, Ontario Correspondence Allan H. Edelsparre and Mark J. Fitzpatrick, Department of Biological Sciences, Integrative Behaviour and Neuroscience Group, University of Toronto Scarborough, Toronto, ON. Emails: [email protected]; mark. [email protected] Funding information Natural Sciences and Engineering Research Council of Canada, Grant/Award Number: 487162
Abstract Understanding factors that ameliorate the impact of habitat loss is a major focus of conservation research. One key factor influencing species persistence and evolution is the ability to disperse across increasingly patchy landscapes. Here we ask whether interpatch distance (a proxy for habitat loss) and dispersal strategy can interact to form thresholds where connectivity breaks down. We assayed dispersal across a range of interpatch distances in fruit flies carrying allelic variants of a gene known to underlie differences in dispersal strategy. Dispersal-limited flies experienced a distinct negative threshold in connectivity at greater interpatch distances, and this was not observed in more dispersive flies. Consequently, this differential response of dispersal-limited and more dispersive flies to decreasing connectivity suggests that habitat loss could have important implications on the evolution and maintenance of genetic variation underlying dispersal strategy. KEYWORDS
the more dispersive fully winged flight-capable morph (Mole & Zera, 1993). In fact, habitat persistence seems to maintain dispersal capa-
ticularly in small populations, and can ultimately lead to extirpation or extinction of species and whole communities (Mora et al., 2017). Similarly, and perhaps more importantly, dispersal represents one of the few routes for organisms to escape habitats that are under
60 40
depression can lead to the accumulation of deleterious alleles, par-
20
pression (Pimm et al., 2006). The negative impact from inbreeding
Connectivity
& Döbel, 1991). Depending on the population genetic structure, less dispersive populations may face greater potential for inbreeding de-
Threshold
80
bility in wing-dimorphic insect species (Denno, Roderick, Olmstead,
sistence of populations affected by habitat loss, including those that are genetically distinct, likely depend on individuals that can cross
0
pressure from fragmentation (With & King, 1999). As such, the per0
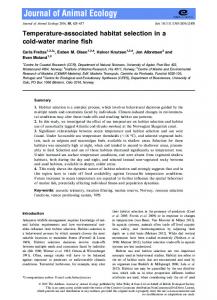
a matrix of hostile landscapes before reaching a suitable habitat, or use stepping-stones in the habitat to connect with important resources (Watts et al., 2015). Habitat loss can reduce connectivity in the landscape by increasing the distance between suitable patches (Hanski, 1998). A few papers have illustrated this principle by modeling movement in landscapes as a function of habitat loss (Dytham & Travis, 2012; With & King, 1999). In these models, patches of habitat are usually removed from the landscape, and over time, the probability of moving from one side of the landscape to the other slowly decreases until reaching a threshold where dispersal is greatly reduced (Figure 1). Factors that influence these dispersal thresholds (e.g., the breaking point at which interpatch distance increases beyond dispersal propensity) are therefore fundamental, not only
20
40
60
80
100
Habitat loss (%) F I G U R E 1 The theoretical nonlinear relationship between habitat loss (x-axis), connectivity (y-axis) and dispersal strategy (dotted and solid lines). Connectivity is defined as the chance of moving from one side of a landscape to the other. As the amount of habitat is removed connectivity declines steadily due to increasing fragmentation (e.g., increasing interpatch distances between habitat patches) until reaching a threshold (intercept of the horizontal and vertical lines) where connectivity decreases rapidly. The threshold is dynamic for a population with multiple dispersal strategies: for a dispersal-limited strategy (broken line) connectivity begins to decrease rapidly already when less than 30% of habitat is removed (intercept of the two broken lines), while for a more dispersive strategy connectivity decreases rapidly when more than 40% of habitat is removed (intercept of the black and broken lines)
to understand the degree to which habitat loss impedes dispersal between patches, but also to understand how habitat loss may in-
increasing interpatch distances and that the relationship between
fluence the evolution of dispersal strategy. Although researchers
dispersal and interpatch distance will depend on dispersal strategy
rarely discuss the dynamics of dispersal thresholds, it is logical to
(Figure 1). To establish whether changes in connectivity can influ-
propose that the shape of the relationship between habitat loss
ence the evolution of dispersal strategies within populations, we
and dispersal depends on the interaction between dispersal strat-
assessed whether dispersal thresholds are associated with naturally
egy and inter-habitat distance. This generates a very interesting
occurring genetic variation in foraging (for), a gene known to influ-
predicted nonlinear relationship between dispersal strategy and
ence food-searching and dispersal behavior in fruit flies (Edelsparre
threshold distance, such that the distance at which dispersal will
et al., 2014; Sokolowski, 2001).
be significantly reduced is shorter for a dispersal-limited strategy relative to a more dispersive strategy (Figure 1). Consequently, selection on dispersal strategy could result in changes in the position of the threshold. Here, we empirically test this idea by assessing whether the
2 | M ATE R I A L S A N D M E TH O DS 2.1 | Fly lines
shape of the relationship between habitat loss and dispersal de-
To test whether fruit flies with different dispersal strategies exhibit
pends on the interaction between interpatch distance and dispersal
differences in response to changes in habitat connectivity, we reared
strategy. We test this using wild-t ype strains of fruit flies (Drosophila
two allelic variants of the foraging (for) gene (rover-for R , sitter- fors)
melanogaster) that differ in dispersal strategy both in the laboratory
(de Belle & Sokolowski, 1989). In both laboratory and field trials,
and in nature (Edelsparre, Vesterberg, Lim, Anwari, & Fitzpatrick,
homozygous fors individuals exhibit a dispersal-limited phenotype
2014), and we expose them to environments with decreasing con-
relative to homozygous forR individuals (more dispersive) (Edelsparre
nectivity. In our experiments, there is no habitat loss per se; rather,
et al., 2014). Individuals homozygous for fors (sitters) are character-
we use increasing distances between patches to simulate the de-
ized by lower for-mRNA expression levels and protein activity (PKG)
creasing connectivity that arises from habitat loss (Hanski, 1998;
relative to individuals with the for R allele (rovers) (Osborne et al.,
With & King, 1999). Our prediction is that, in general, flies will show
1997). The for R and fors strains used here differ in their second pair
a nonlinear (e.g., threshold) decrease in dispersal in response to
of chromosomes where for resides, but share for R-derived third and
|
3
EDELSPARRE et al.
X chromosomes to provide some control for genetic background (de
proportion of flies that had moved to the other chamber. Previous
Belle & Sokolowski, 1989; Kaun et al., 2007).
chamber- to- chamber dispersal assays on this system yielded
To test whether differences in behavior can be directly linked to
rover/sitter differences in dispersal at distances of 4 cm over 6 hr
variation in for, we reared a third fly strain, the fors2 mutant. The fors2
(Edelsparre et al., 2014). This simple laboratory assay is an accurate
mutant is essentially a rover with a laboratory-generated mutation
predictor of rover/sitter dispersal in nature (Edelsparre et al., 2014).
in for resulting in sitter-like for-mRNA expression, PKG activity, and
To simulate decreasing connectivity between the two patches, we
behavior (de Belle et al. 1993; Pereira & Sokolowski, 1993). Because
exposed new flies to similar dispersal assays as described above,
the fors2 mutation was induced on the for R genetic background, the
but we connected the two chambers with tubing lengths of 20 cm,
mutation provides a direct test as to whether any differences in phe-
40 cm, and 80 cm, in separate trials. By doubling the distance at each
notype can be linked with allelic variation in for.
level of connectivity, we attempted to identify a range of distances
Strains were kept on a yeast–sugar–agar medium (40 ml) in 170 ml
that might uncover thresholds between the two dispersal strate-
plastic bottles (VWR) with sponge tops on a 12/12-hour light/dark
gies while also being logistically feasible to execute in the labora-
cycle at 23 ± 2°C (standard conditions; see Edelsparre et al., 2014).
tory along with balancing the number of replicates and treatments.
Experimental flies were collected upon emergence from pupae and
In total, we conducted 204 dispersal trials (rover n = 65, sitter n = 67,
kept in 90 ml plastic vials under standard conditions until they were
sitter mutant n = 72). For all trials, the tubing length, arena orienta-
between 5 and 7 days old.
tion, and start chamber were randomized to control for sequential and directional effects.
2.2 | Dispersal assay We quantified dispersal using a two food-patch arena (Figure 2). This
2.3 | Statistical analysis
type of design has been used successfully for studies of connectiv-
To test whether changes in connectivity differed as a function of
ity in nature (Tewksbury et al., 2002). The arena consisted of two
for- mediated dispersal strategies, we used a two- step approach.
rectangular chambers each measuring 4.8 cm high and 2.9 cm wide
First, we tested whether the relationship between dispersal and
(AMAC Plastic Products). The chambers were connected by tubing
interpatch distance differed between genotypes (genotype × dis-
(Tygon, diameter 6.4 mm) to allow dispersal from one chamber to
tance interaction). To do this, we used a three-way ANOVA fitting
another. This procedure provided flies with a “familiar” environ-
interpatch distance as the main effect and strain as a second effect.
ment and a choice between staying or dispersing into an unknown
We included sex as a third effect to control for differences between
environment. The willingness to disperse into an unknown destina-
males and females. Finally, to assess whether each strain exhibited
tion (i.e., the adjacent chamber) via the tube was assumed to reflect
dispersal thresholds, we calculated the 95% confidence interval
flies’ dispersal propensity. Each chamber was filled with 2 ml yeast–
around the mean proportion that reached the adjacent chamber at
sugar–agar medium prior to each trial. An experimental trial involved
each distance. Distances at which the confidence interval within
gently transferring 16 CO2 anesthetized flies of the same sex and
each strain did not overlap were taken as evidence for a threshold.
genotype and placing them into one of the chambers (designated
To meet assumptions of normality proportions were arc-sine square
as the start chamber) and allowing them 6 hr to disperse between
root transformed, however, for ease of interpretation, we plot the
chambers. Before an experimental trial commenced, we ensured
untransformed data to construct our figures. All analyses were con-
that flies resumed normal behavior (e.g., male-to-male aggression,
ducted using R (v. 3.3.3; R Development Core Team, Vienna, Austria).
foraging, etc.) and that females had deposited eggs (see definition of dispersal above). The proportion of dispersers was quantified as the
3 | R E S U LT S There was a clear interaction between strain and interpatch distance on the proportion of dispersing flies (Strain × Distance: F4,186 = 6.28, p = .0001). In general, the proportion of flies dispersing decreased with interpatch distance (Distance: F2,186 = 29.99,
F I G U R E 2 The two-patch arena used to assay dispersal. Each cube represents a chamber (4.8 cm × 2.9 cm) filled with 2 ml standard yeast–sugar–agar medium (depicted in yellow). The horizontal lines drawn between the cubes represent the tubing which allowed flies to move unhindered between the two chambers. Three lengths of tubing were used in separate trials to simulate increasing distance arising from habitat loss: 20, 40, and 80 cm. All parts of the arena were made from clear see-through materials to allow observers to monitor the movement of flies between the chambers