Research Paper
Histone deacetylase (HDAC) encoding gene expression in pancreatic cancer cell lines and cell sensitivity to HDAC inhibitors M. Ouaïssi,1-3,† S. Cabral,4,5,† J. Tavares,4,5 A. Cordeiro da Silva,4,5 F. Mathieu Daude,3 E. Mas,2 JP. Bernard,2 B. Sastre,1 D. Lombardo2 and Ali Ouaissi3,5,* 1Service
de chirurgie Digestive et Oncologique; Hôpital Timone; Marseille France; 2INSERM UMR911; Faculté de Médecine-Timone; Marseille France; 3INSERM UMR 554; IRD UR008; centre IRD de Montpellier; France; 4Departamento de Bioquímica da Faculdade de Farmácia; Universidade do Porto; Portugal; 5IBMC-Instituto de Biologia Molecular e Celular; Universidade do Porto; Portugal †These
authors contributed equally to this work.
Abbreviations: HDACs, histone deacetylases; SIRTs, human Hst proteins (homolgous of sir two); HDIs, histone deacetylase inhibitors Key words: pancreatic cancer cells, HDACs, SIRTs, HDAC inhibitors, nicotinamide, sirtinol, TSA, RT-PCR, apoptosis
Purpose: Multiple biochemical and molecular alterations occur in pancreatic cancer cells. In the present study, attempts were made for the first time, to explore the level of expression of members of histone deacetylase encoding genes (HDACs) in four pancreatic tumor cell lines: Panc-1, BxPC-3, SOJ-6 and MiaPaCa-2; and two non-related tumor cells: Jurkat and HeLa. Furthermore, we examined the possible relationship between the levels of HDACs expression and the sensitivity/resistance to HDAC inhibitors (TSA, Nicotinamide and Sirtinol). Results: We have found that although a slight variation in the profiles of gene expression among cell lines could be evidenced, HDACs protein synthesis seem to be similar. Furthermore, the cells were equally sensitive to inhibition by Sirtinol whereas some variation in the IC50 could be seen in the case of TSA. We also demonstrate that the drugs had the capacity to induce the death of cells by apoptosis. Methods: We have used four human pancreatic tumor cell lines and two-non related tumor cells, to evaluate the expression of HDAC encoding genes by RT-PCR and Western blot analysis. We also measured the effect of certain HDAC inhibitors (HDIs) on cell growth, cell cycle alteration, membrane phosphatidyl-serine exposure, DNA fragmentation and mitochondrial membrane potential loss. Conclusions: Taken together, our data support the notion that the level of cell sensitivity to the HDIs might be related to the level of expression of genes such as those encoding proteins playing a role in cell cycle checkpoints control but not HDAC per se.
Introduction Pancreatic cancer is a major health problem worldwide. Depending on the extent of the tumor at the time of diagnosis, *Correspondence to: Ali Ouaissi; INSERM UMR 554; IRD UR008; Centre IRD de Montpellier; 911 Av. Agropolis; Montpellier 34394 France; Tel: (33)467416331; Fax: (33)467416331; Email:
[email protected] Submitted: 11/15/07; Revised: 12/27/07; Accepted: 01/02/08 Previously published online as a Cancer Biology & Therapy E-publication: http://www.landesbioscience.com/journals/cbt/article/5480 www.landesbioscience.com
the prognosis is often poor with a 5-year survival of less than 5%.1 Standard treatments for advanced disease include radiotherapy and/ or chemotherapy regimens. However, radiotherapy is often toxic and the chemotherapy which includes drugs such as 5-fluorouracil (5-FU) and gemcitabine (GEM) are either ineffective or effective for only short duration, although GEM has been shown to provide an improvement in the life quality.2 Furthermore, pancreatic cancer chemoresistance may also play a role in the lack of effective therapies.3 Multiple biochemical and molecular alterations occur in cancer cells. For instance, pancreatic cells overexpress the death receptor decoys DcR2 and DcR3 as well as BcL-XL which play a role in pancreatic cancer chemoresistance.3 Moreover, pancreatic cancer cells show a high rate of p53 gene mutations.4 Interestingly, reintroduction of the wild type p53 in the human pancreatic cells increases their sensitivity to GEM.4 Other alterations including K-ras, p16, DPC4 and FHIT genes have been shown to play a role in the progression of primary pancreatic adenocarcinomas.5-7 Moreover, overexpression of p21WAF1/CP1 has been reported to be an early event in the development of pancreatic intraepithelial neoplasia.8 Specific events driven changes that led to the cancer development and progression are interconnected complex molecular modifications including DNA methylation, histone acetylation, phosphorylation, ubiquitylation and ADP ribosylation. The elucidation of the mechanisms of transcriptional activation and repression in eukaryotic cells has shed light on the important role of acetylation-deacetylation of histones mediated by histone acetyltransferases (HATs) and histone deacetylases (HDACs), respectively.9 The HDACs family comprises several classes of proteins: the class I includes HDAC1, 2, 3 and 8 exhibiting high sequence identity and similar domain organization whereas the classes II is composed of HDAC4, HDAC5, HDAC6, HDAC7 and HDAC9. A third class of deacetylases (class III) comprises Hst proteins (Homolgous of Sir two) or sirtuins (SIRT) based on their primary structure homology to the yeast SIR2 (silent information regulator) protein. Thus, inactivation of HATs or overexpression of HDACs may lead to aberrant gene expression and consequently tumor cell proliferation.10
Cancer Biology & Therapy
523
Histone deacetylases (HDAC) in pancreatic cancer cells and HDAC inhibitors
The search for means to interfere with the proliferation of tumor cells allowed the identification of a large number of natural and synthetic compounds that could revert the cell morphology of various oncogene-transformed cells and cancer cells to apparently normal phenotype.11 Interestingly, these compounds exhibit HDAC-inhibitory activity and cell cycle arrest suggesting that this might be related to their anti-tumor cell growth property. Indeed, an anti-proliferative activity has been reported for a number of HDIs such as TSA, trapoxin, FK228, apicidin.12 HDIs seem to be a promising group of compounds inducing differentiation, growth arrest and/or apoptosis in a wide range of tumor cells. In the case of pancreatic cancer cells, TSA, one of the first HDIs containing hydroxamid functional group, has been shown to induce apoptosis.13 Growth inhibition of pancreatic cancer cells consecutive to apoptosis, cell cycle arrest (G2/M) and differentiation was observed with Synthetic hydroxamid acid-based hybrid polar compounds such as suberoylanilide hydroxamic acid (Vorinostat, SAHA).14 The precise mechanism(s) of the HDAC inhibitors (HDIs) is not yet fully elucidated. The HDIs by releasing transcriptional repression may induce cell cycle arrest, differentiation and/or apoptosis of different tumors.15 In fact, in addition to histones, a number of other proteins among which transcription factors, cell cycle signaling factors and factors involved in programmed cell death are substrates for HDACs.12 In this study, we investigated for the first time, the expression levels of members of class I, II and III HDACs genes in several pancreatic adenocarcinoma cell lines (Panc-1, BxPC-3, SOJ-6, MiaPaCa-2) and two non-pancreatic human tumor cell lines: a peripheral blood leukemia T cell (Jurkat) and a cervical adenocarcinoma cell (HeLa). Attempts were made to examine the possible relationship between the levels of HDACs expression and the sensitivity/resistance to HDIs.
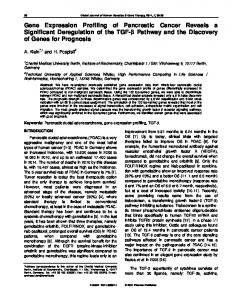
Results RT-PCR analysis of HDACs/SIRTs gene expression. A panel of four pancreatic tumor cell lines (MiaPaCa-2, BxPC-3, Panc-1, SOJ-6) and two unrelated tumor cells (Jurkat, HeLa) were studied. The cell lines were evaluated for HDACs mRNA status by RT-PCR. As shown in Figure 1, although relatively week positive signals could be seen in the case of members of class III deacetylase encoding genes (i.e., SIRT2), in most of the cell lines, significant levels of gene transcription were observed in the case of members of class I (HDAC1, 2, 3) and class II (HDAC6, 7) deacetylase encoding genes. Control tests showing similar signals for b-tubulin transcript in all cell lines analyzed confirmed that the mRNA isolated from the cells was intact. The crossing point (CP) which defines the point at which the fluorescence rises appreciably above the background fluorescence was higher for all the transcripts analyzed when compared to the tubulin, leading to ΔCP cycle numbers which varied from 4 to 18 cycles (Table 3). This indicates that most of the HDACs target genes were less expressed than the housekeeping gene, in agreement with the RT-PCR analysis. Moreover, in preliminary experiments, using normal pancreas, we found that the CP for all the transcripts analyzed were higher than those of the housekeeping gene. This led to the ΔCP cycle numbers, which varied from 2 to 7 cycles, indicating therefore, that most of the HDACs target genes were less expressed than those of the housekeeping gene (Ouaissi et al. in 524
Figure 1. RT-PCR analysis of total RNA from the human epithelial carcinoma cell line, HeLa (1), the human lymphoma Jurkat cells (2), and the human pancreatic adenocarcinoma cell lines: [MiaPaCa-2 (3), BxPC-3 (4), Panc-1 (5) and SOJ-6 (6)]. The total RNA was isolated from cells and 1 mg of each sample was reverse transcribed to cDNA. PCR amplifications were performed using 1/20 dilution of cDNA as described under Materials and Methods section. PCR products were analyzed on 1.5% agarose gel and visualized with ethidium bromide. As an internal control, a housekeeping gene, the b-tubulin transcript, was amplified. The gene primers used are shown in Table 1.
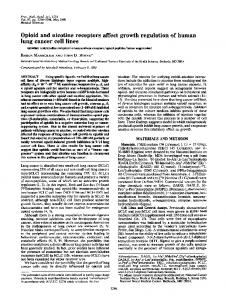
preparation). Western blot analysis of HDAC/SIRT proteins synthesis. Complementary experiments using Western blotting and commercially available antibodies against members of class I (HDAC1), class II (HDAC4, 7) and class III (SIRT1, 2) proteins were performed with total extracts from different tumor cell lines. These experiments allowed us to examine the levels of proteins synthesis. As shown in Figure 2, no major changes in protein expression was observed for HDAC1, 4–7 and SIRT1-2 except in the case of Panc-1 cells where SIRT1 reactive band was barely visible. An internal check consisting of a polyclonal antibody directed against β-tubulin showed similar signal intensities for cell β-tubulin polypeptide in all samples examined, demonstrating therefore, that equal quantities of total proteins were analyzed. Thus, these observations may suggest that although some variation at the level of gene transcription could be evidenced between cell lines, the amount of HDACs proteins, at least those examined in Western blot, produced by different cell lines seem to be comparable. Inhibition of cell growth by HDIs. While the class I and II HDACs inhibitors have been extensively studied in the case of pancreatic cancer cells, the efficiency of class III HDACs inhibitors
Cancer Biology & Therapy
2008; Vol. 7 Issue 4
Histone deacetylases (HDAC) in pancreatic cancer cells and HDAC inhibitors
Figure 2. Western blot analysis of HDACs expression levels in different cell treated as described in Materials and Methods.
has not yet been examined in detail. Inasmuch, as virtually the levels of HDAC1, 4, 7 and SIRT1-2 seem to be of the same order in all cell lines analyzed, we though it was interesting to examine the effects of known inhibitors of class III deacetylases such as Nicotinamide and Sirtinol on the growth of pancreatic cancer cells. Three pancreatic cancer cell lines and HeLa cells were subjected to Nicotinamide or Sirtinol treatments. In parallel, the antiproliferative effects were compared to those observed when using TSA, a classical inhibitor of class I and II deacetylsaes. As shown in Figure 3A–C, treatment of cells with final concentrations ranging from: 0.15–200 mM of Nicotinamide (Fig. 3A), 0.1–125 mM Sirtinol (Fig. 3B) or 0.1–10 mM TSA (Fig. 3C) during 48 h, resulted in a dose-dependent inhibition of cell growth, quantified by SRB dye assay. The cell growth was inhibited to various degrees having half maximal effect between 50 and 70 mM in the case of Nicotinamide, ≈50 mM for Sirtinol and between 0.5 and 1 mM when using TSA. The calculated IC50 are shown in Table 4. The TSA seems to be the most effective compound compared to Nicotinamide and Sirtinol (p < 0.01), although the IC50 values that we have observed with TSA appeared to be higher than those reported by independent investigators (