This paper describes the development of a new tool ... physically based lighting simulation software such as. Radiance (Ward ... commands and incorporates new custom algorithms ..... Interaction in Africa, Cape Town, South Africa. Ward, G.
Proceedings of BS2013: 13th Conference of International Building Performance Simulation Association, Chambéry, France, August 26-28
HDRSCOPE: HIGH DYNAMIC RANGE IMAGE PROCESSING TOOLKIT FOR LIGHTING SIMULATIONS AND ANALYSIS Viswanathan Kumaragurubaran1 and Mehlika Inanici1 University of Washington, Department of Architecture, Seattle, WA, USA
ABSTRACT This paper describes the development of a new tool called hdrscope that enables users to perform qualitative and quantitative lighting analysis via perpixel methods. Using a simulated and photographically captured lab space as a case study, per-pixel analysis methods are described, challenges associated with per-pixel lighting analysis are discussed, and hdrscope analysis techniques are demonstrated. hdrscope is intended to lower the entry barrier for lighting professionals, and to facilitate the utilization of lighting analysis in early design and development stages as well as post occupancy. It also provides a user friendly tool for lighting experts while filling in the gaps among the current lighting analysis tools.
INTRODUCTION Designing built spaces that adequately and appropriately utilize daylighting and electric lighting has seen significant progress through the evolution of physically based lighting simulation software such as Radiance (Ward, 1994), and High Dynamic Range (HDR) photography software such as Photosphere (Ward, 2005) that allow generating and capturing real world lighting values at a per-pixel level. Radiance software has been utilized by a relatively small number of dedicated experts since its debut in 1989. Although Radiance is known for its steep learning curve, recent simulation tools with better graphic user interfaces (GUI) such as Ecotect (Roberts and Marsh, 2001), Open Studio (Gugliemetti et al., 2011), and DIVA (Jakubiec and Reinhart, 2011), facilitated an increase in the number of people who adopted Radiance as a lighting simulation engine in the last decade. While it is important to assure the quality of the simulations with appropriate underlying expertise and education, it is equally important to develop toolsets that facilitate better learning environments. User friendly approaches enable us to spread the expertise across the profession. This is particularly important for daylighting simulations as the initial design decisions have the greatest impact on daylighting use and quality. Given the state of the changing reality in daylighting simulations, there is a parallel need to develop user
friendly lighting “analysis” tools. Although Radiance has numerous useful features for lighting analysis, the lack of an intuitive user interface slows down appropriate level of adoption for advanced analysis, in a similar manner it has slowed down its adoption as a simulation engine. Simulationists are now able to generate high quality lighting images, but most per-pixel lighting analysis options remain accessible to only a few owing to the need for specialized computing and scripting skills. There are multiple issues that pose problems for wide-spread adoption of advanced lighting analysis techniques: 1. Radiance and glare analysis tool Evalglare (Wienold and Christoffersen, 2006) are targeted at users who are comfortable with command line programming. Command line programming is a highly flexible way of operating software, but it is restricted in terms of user friendly interface for providing the simulation inputs and visualizing the outputs. 2. Per-pixel analyses that are not supported with current tools are usually performed in programming environments. In order to perform specialized mathematical and statistical calculations that involve repetitive and intensive tasks, generic scientific computing tools such as Matlab or C++ can be used. These tools are flexible in functionality and enables custom batch processing. However, the in-house scripts and codes make it difficult to share the methodologies (Inanici 2003, Inanici and Navvab, 2006, Araji and Boubekri, 2010). 3. Current lighting analysis methods also require several software programs for a specific purpose. The fragmented nature of these existing tools and techniques combined with the general lack of designer friendly approaches point to a need for integrating the tools under a single interactive user interface.
- 3400 -
Proceedings of BS2013: 13th Conference of International Building Performance Simulation Association, Chambéry, France, August 26-28
PER-PIXEL LIGHTING ANALYSIS AND EXISTING TOOLS Lighting analysis methods that include pixel-based, region based and comparative calculations present many opportunities to evaluate the quantitative and qualitative aspects of the luminous environments when they are specifically tailored for the target application. Apart from studying the false color images, the following features are required to utilize the outcome and potential of lighting simulation imagery:
Per-pixel and regional luminance analysis capabilities that include the ability to isolate parts of a scene for statistical and mathematical analysis; Glare analysis tools; and
Appropriate visualization of HDR imagery (i.e. tone mapping operators). Although some of these features are available in accumulation of Radiance, Photosphere, and Evalglare, there are several useful features missing. One of the important features that will immensely benefit designers is providing graphical interactivity for analysis. These features are discussed with their solutions in the next section.
HDRSCOPE: LIGHTING ANALYSIS hdrscope is a lighting analysis and HDR image processing software created for the Microsoft Windows operating system and written in C++. It provides a GUI front end for several Radiance commands and incorporates new custom algorithms and 2D drawing features (Kumaragurubaran, 2012). It can process and analyze HDR imagery originating from Radiance software and HDR photographs originating from Photosphere. Per-pixel and regional luminance analysis capabilities: For a specific region of interest (or for the entire image), luminance distribution is a measure of the spatial variance in the luminance values. Distribution calculations are typically applied 1) throughout an entire scene, 2) to selected architectural elements such as desks, walls, windows and; 3) to a specified region of interest such as the human visual field of view. These calculations largely involve descriptive statistical information. A related analysis involves luminance ratios, which is performed on a task area and its surrounding. Luminance contrast is also useful to study the relative luminance values between the task and its background (such as a text on a computer screen) to determine the visibility of a task.
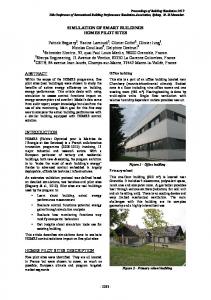
Figure 1 Scenes from the lab space used for demonstrations In order to analyze luminance values from specific elements within the HDR image, it is necessary to isolate a portion of pixels from the rest of the image. Options such as dynamic selection of regions of interest, masking and task area categorization are often considered vital for scene analysis, but the support for such interactive image analysis is missing in currently available tools. hdrscope provides three region selection tools that can perform hit-testing and select pixel regions for any operation in a lighting analysis procedure. The region selection tools include rectangle, circle, and polygon selection. Although Photosphere provides a rectangular selection option and Radiance provides luminance value for a selected pixel, none of the other tools allow the user to select an arbitrary polygon or circular area interactively. HDR images of a laboratory space is used for demonstration throughout the paper (Fig 1). Figure 2 demonstrates the selection options in a given scene.
Figure 2 Interactive selection of a rectangle, circle, and polygon allow to customize and isolate a region of interest for numerical analysis
- 3401 -
Proceedings of BS2013: 13th Conference of International Building Performance Simulation Association, Chambéry, France, August 26-28
greater than the specified criteria. The example demonstrates that the blinds in the space were effective shading devices at this particular date and time.
Apart from interactive selections, hdrscope also allows using image mask files (in HDR, PIC, BMP or TIFF formats), or creating mask files from interactive input to be used for repetitive analysis. Mask files have to necessarily be of binary nature (black and white) where regions of white are unmodified, and regions of black pixels are converted to black pixels. The numerical analysis provided in hdrscope can be done in a single region of interest or two regions of interest. In a single region of interest, any shape of a region (or the entire image) is selected to perform:
Statistical analysis: Basic descriptive statistics such as minimum, maximum, mean, median and standard deviation of luminance values in a selected region (or the entire image) are displayed along with a histogram.
Percentile ratio: Percentile ratio calculations are performed by sorting the luminance values and retrieving the upper and lower percentile number of pixels as specified by the user and calculating the ratio of the mean values of luminance within these regions. Studying percentile ratios is recently suggested as one of the new luminance-based metrics (Newsham et al., 2008).
Criterion rating: Criterion rating performs an absolute comparison of luminance values based on a given condition (lesser than, equal to or greater than a user specified luminance value). The final statistic is represented as the percentage of pixels in the selected region that satisfies the specified criteria. Once a valid region has been found by the wizard, the criterion rating option may be enabled to further analyze the pixels that exceed the design goal. Figure 3 illustrates a selected polygon area that corresponds to the task surface in the studied lab space. Two statistical analysis results are shown here with and without the use of window blinds. The histogram displayed in the analysis results is a subset of the Ward histogram method (phisto). The histogram x-axis is linear in display. The yaxis is linear and normalized by the phisto script (hence the label is not included with histogram graph display). The results can be saved in a comma separated values format for further analysis. The criterion rating in this example is specified as 2000 cd/m2. As results demonstrate, the luminance values exceed 2000 cd/m2 in 53.6% of pixels that correspond to the task surface in the scene without blinds. With the blinds rolled down, the mean luminance drops down to 254 cd/m2 on the task surface, and there are no pixels
Figure 3 Lighting analysis of a single region (desk) in the scene. Multiple regions of analysis allow the user to choose two regions independently using selection tools or a mask image. A comparative analysis of the luminance can be done to calculate ratios between two architectural elements or contrast between a task surface and its background. The statistical information for the multiple region of analysis is presented in three parts: One for each region, and one for the calculated ratios. The user may choose to individually analyze the regions selected in the
- 3402 -
Proceedings of BS2013: 13th Conference of International Building Performance Simulation Association, Chambéry, France, August 26-28
wizard or view the ratios calculated for each of the statistics chosen including the ratio of minimum, maximum, median, mean, standard deviation and optionally the contrast. Figure 4 demonstrates the selection of two regions. The ratio of the mean luminance values between the task and the window is calculated in hdrscope as 1:100.
generated to identify the glare sources with and without blinds. The DGP was calculated as 81% for the scene without the blinds, and it was 42% for scene with blinds rolled down completely.
Figure 5 Screenshots from a) the Glare Analysis Wizard that exposes Evalglare options b)Ward histogram Tone mapping operator Visualization and Tone Mapping Operators: hdrscope provides two methods of visualizing HDR images and per pixel luminance values. Apart from false color images, tone mapped versions of the HDR images can be created. Tone mapping is a technique used to compress the high dynamic range pixel luminance data into displayable range. Although several tone mapping operators have been developed in the past two decades, histogram tone mapping operator (Ward, 1997) and photographic tone mapping operator (Reinhard et al, 2002) are included in the software as the most commonly used methods.
Figure 4 Selection of two regions for luminance ratio analysis: task and the background (window) and the resulting analysis. Task: window ratio is 1:100.
Figure 6 Identified glare sources in Evalglare
Glare analysis tools hdrscope provides a GUI for glare analysis utilizing the Evalglare program (Wienold and Christoffersen, 2006). Evalglare provides several features and options for users to customize and specify the characteristics of the glare source. Evalglare program embedded within the analysis wizard (Figure 5a) exposes all the program features and complies with the suggested work flow. The wizard collects all user inputs required for the glare analysis. Prior to running the evalglare program, the image is scaled down to 800x800 or less to adhere with evalglare program suggestions. Once the wizard finishes execution, the automatically created ‘check’ file loads in the image display area. Figure 6 illustrates the images that were
Ward histogram method is available within Radiance software, and hdrscope provides an interactive interface with all options exposed (Figure 5b). The photographic tone mapping operator (Reinhard et al., 2002) performed well in comparison studies among different tone mapping operators (Yoshida et al., 2005; Ledda et al., 2005; Kuang et al., 2006; 2008; Cadik et al., 2008). It is included in hdrscope distribution with permission from its author (original file distributed in Reinhard et al., 2005). Figure 7 demonstrates the tone mapping operators of the same scene, both operators are applied with their respective default values. Other features provided for efficient processing of HDR imagery are:
- 3403 -
Proceedings of BS2013: 13th Conference of International Building Performance Simulation Association, Chambéry, France, August 26-28
Image cropping, resizing, rotating and flipping;
capture, and 2) data (image) preparation for IBL simulations.
Image operations (addition, subtraction, multiplication or division of two HDR images to yield an output HDR image); and
Ability to edit header information and exposure settings.
Automated Image Capture Integrating hardware interfaces for automated HDR capture and assembly into a common software toolkit is useful to ensure that the entire workflow involved in lighting simulation. Previous work has been done on automating the image capture. Canon HDRcapOSX [Fan and Mardaljevic, 2011] is an automated Mac OS application and script package that is capable of automatically controlling a tethered Canon Digital SLR camera by setting a predefined series of shutter speed values on the camera and capturing images. hdrscope provides image capture in a Windows environment with unique features customized for both general HDR image capture and the HDR capture of the sun and the sky. The software remotely connects to the camera and controls the aperture and shutter speed values. The options allow users to save captured JPEG image files in a specified folder, set capture modes and time, and to configure capture sequences to be repeated over a period of time. These features eliminate errors during the capture process and also ensure that constant observation is unnecessary for capturing images for prolonged periods of time. hdrscope supports Canon Digital SLR camera remote control features through the Canon SDK. Supported Canon cameras include those that were released since 2007. The software has been exhaustively tested with Canon EOS 30D, Canon 5D, and Canon EOS 5D Mark II cameras over long periods of data collection. In the “Automatic” capture mode, the software selects a predefined set of aperture and shutter values based on a file (which can be modified by the user) depending on the camera model. In the “Manual” capture mode, the software allows setting shutter speed values to the camera for a single aperture or two aperture settings. Two-aperture mode is a unique feature of hdrscope and it is specifically developed to capture sky images. As a general rule, a single aperture size can be used with varied shutter speed to capture cloudy sky conditions. When the solar corona is visible, it is not possible to record the extreme dynamic range only using a fixed aperture size. To capture both the sky and the sun, the capturing process needs to be modified to include two different apertures (f/4.0 and f/16) with varying shutter speeds (Stumpfel et al, 2004; Inanici, 2010).
Batch Processing hdrscope allows for processing a collection of HDR images. Batch processing mode operates as a macro recording. The menu options allow for Starting and stopping a macro. Once the “Record macro” option is chosen from the tools menu, the user can proceed to process the sample image and the software captures all Radiance commands and associates it with a hdrscope operation such as exposure correction, vignette correction, sizing, and etc. When the user has completed the desired operations and stops recording the macro, hdrscope saves the sequence of operations which can be retrieved and applied to a folder containing the collection of HDR files and the recorded processing steps are applied to all the HDR images.
Figure 7 Tone mapped images by Ward histogram tone mapping operator and Reinhard photographic tone mapping operator.
HDRSCOPE: HDR PHOTOGRAPHY INPUT FOR LIGHTING SIMULATIONS As mentioned earlier, one of the major goals of hdrscope is to fill in the gaps in the current analysis tools. An urgent need in lighting simulation is to address the fragmented nature of the workflow for “image based lighting” (IBL) simulations. IBL is a visualization technique that utilizes captured HDR images as light sources in the rendering process (Debevec, 2002). The luminance information stored at a pixel level in an HDR photograph is used to light the simulated environment. Previous research demonstrated the accuracy of using HDR fisheye images of the sky dome in the IBL technique (Inanici, 2010). However, there are many steps that need to be completed for successful modeling of image based sky domes. These steps are typically performed using in-house scripts. hdrscope provides many useful features that are specifically aimed at supporting IBL simulations. These features can be categorized as 1) automation of image
Data Preparation for IBL Simulations Assembled HDR sky images require post processing to correct aberrations in the image capturing process. These major operations are the vignetting correction and the luminance/illuminance calibration.
- 3404 -
Proceedings of BS2013: 13th Conference of International Building Performance Simulation Association, Chambéry, France, August 26-28
Lens vignetting is an artifact that arises owing to lens optical and mechanical deviations. For fisheye lenses, vignetting introduces a radial non-linear light intensity fall off across the lens. On the periphery of these lenses, the actual light captured by the digital camera image sensor is lower than what is theoretically expected. Vignetting effect is a significant problem when capturing the sky luminance. The effect can be determined as a polynomial function for each type of lens and aperture size. Recent research shows that the vignetting filters determined for one device in a laboratory environment can be adopted by others that utilize the same brands and model of the lens (Cauwerts, 2012). This is important information as it encourages researchers to share the vignetting correction functions that are already determined. The vignetting correction functions can be applied through scripts, but they can also be used to devise digital filters to compensate for the luminance loss. The digital filter is an image that has the same resolution as the fisheye image, and it is applied as a post process to compensate for the vignetting effect based on the pixel location. Figure 8 illustrates a digital vignetting correction filter. The intensity of light as a relative measure of luminance values in the falsecolor representation is a clear demonstration of the problem. Values in yellow represent pixels that require no luminance modification and other colors require proportional luminance correction. hdrscope includes a vignetting correction item that can utilize digital vignetting filters to address the problem.
features a novel calibration technique, which is based on illuminance. For special cases such as the sun and sky capture, it may not be possible to perform a luminance calibration. It is not practical to include a reference target (such as a grey card) when capturing the sky dome. In such cases, it may be useful to calculate the calibration factor value from the illuminance measured at the camera level. Illuminance can be derived from the average luminance values in hemispherical fisheye images. Prior to calibrating the image with illuminance measurements, it is necessary to map the optical behavior of illuminance meters with that of the camera. Illuminance meters are hemispherical sensing systems. The optics in such meters employs cosine correction. Most of the commercially available fish eye lenses perform a geometrical projection. The image formed on the image sensor is through an equidistant projection of light on the lens. Since this does not reflect the true spatial image information as captured by the illuminance meter, it is necessary to transform equidistant fisheye projections to hemispherical (cosine-corrected) fisheye imagery. In hdrscope, fisheye images can be automatically transformed to hemispherical projected images and subsequently used to calibrate with illuminance values. Image projections inherently require a cleanup of the HDR image file header and this is also automatically performed by hdrscope prior to performing the appropriate transformation. Similar to luminance calibration, illuminance calibration wizard requires the illuminance meter value taken at the time of the capture, and correspondingly calculates the calibration factor and applies it to the image.
CONCLUDING REMARKS
Figure 8 Falsecolor representation of the Vignetting Correction mask for Sigma 8mm F3.5 EXDG with f/5.6 aperture size Image calibration – Luminance and Illuminance Methods In order to ensure that the HDR images maintain absolute accuracy, it is necessary to calibrate the images through a standard target and measuring instrument. Luminance calibration is straight forward and it is performed by comparing (and correcting) the luminance of a gray target in the image with a hand held luminance measurement taken in the scene at the time of the capture. By simultaneously measuring the luminance values of the reference target and capturing the HDR image sequences, it is possible to linearly calibrate the resulting image. This option is available in Photosphere software and it is included in hdrscope, as well. However, hdrscope also
Numerical analysis of lighting images allows users to perform mathematical operations on the given scene for the purpose of reducing the problem area to a more refined and specific subset of the overall problem. The primary purpose of hdrscope is to provide software for architects and lighting professionals that facilitate a transition from the currently popular tools in their scripted format to a more user friendly and interactive graphical user interface. It offers several key advantages over current tools. Not only the software is easy to use for novice users, but it also provides several novel features:
- 3405 -
Provides an integrated and user friendly GUI, thereby enabling professionals to adopt lighting analysis without the need for learning commands and scripting. hdrscope also obviates the need for running several tools and data interchange.
Incorporates interactive tools such as selection options, analysis wizards and
Proceedings of BS2013: 13th Conference of International Building Performance Simulation Association, Chambéry, France, August 26-28
standard user interfaces. These operations were previously done through lengthy text based inputs, which were cumbersome.
Provides a front end to several common Radiance picture processing and calibration features.
Automates several repetitive tasks such as camera image capture for HDR assembly.
Provides an easy way to visualize HDR images through tone mapping and falsecolor operations.
INSTALLATION hdrscope version 1.0 “HDR image processing toolkit for lighting simulations and analysis” is the first release of the software and it is freely available to download (http://courses.washington.edu/hdrscope/). hdrscope has dependencies on a valid Radiance installation for operation since it calls Radiance programs from within the software. The recommended binaries may be downloaded and installed from the National Renewable Energy Laboratory (NREL) website for OpenStudio (http://openstudio.nrel.gov/). Other dependencies such as Evalglare and tone-mapping operators are bundled with the setup file.
REFERENCES Araji, M.T., Boubekri, M. 2011. A Novel Way of Utilising Radiance-Matlab Visualization for Façade Design Optimization. Lighting Research and Technology, 43(1), 103-118. Cadik, M., Wimmer, M., Neumann, L., Artusi, A. 2008. Evaluation of HDR Tone Mapping Methods using Essential Perceptual Attributes. Computer & Graphics, 32(3), 35– 44. Cauwerts, C., Bodart, M., Deneyer, A. 2012. Comparison of the Vignetting Effects of Two Identical Fisheye Lenses. Leukos, Journal of the Illuminating Engineering Society, 8(3), 181-202. Guglielmetti, R., Macumber D., Long N. 2011. OpenStudio: An Open Source Integrated Analysis Platform. Proceedings of Building Simulation 2011 Conference, Sydney. Australia. Inanici M. 2003. Transformation of High Dynamic Range Images into Virtual Lighting Laboratories. Proceedings of the Building Simulation 2003 Conference, Eindhoven, Netherlands. Inanici M., Navvab M. 2006. The Virtual Lighting Laboratory: Per-pixel Luminance Data Analysis. Leukos, Journal of the Illuminating Engineering Society, 3(2), 89-104. Inanici M. 2010. Evaluation of High Dynamic Range Image-based Sky Models in Lighting Simulation. Leukos, Journal of the Illuminating Engineering Society, 7(2), 69-84.
Jakubiec, J.S., Reinhart C.F. 2011. DIVA 2.0: Integrating Daylight and Thermal Simulations using Rhinoceros 3D, Daysim, and Energyplus. Proceedings of Building Simulation 2011 Conference, Sydney. Australia. Kuang, J., Liu, C., Johnson, G., Fairchild, M. 2006. Evaluation of HDR Image Rendering Algorithms using Real-World Scenes. Proceedings of the International Conference on Imaging Science, Rochester, NY. Kumaragurubaran, V. 2012. High Dynamic Range Image Processing Toolkit for Lighting Simulations and Analysis. Unpublished Master of Science Thesis. University of Washington, Department of Architecture, Seattle, WA. Ledda, P., Chalmers, A., Troscianko, T., Seetzen, H. 2005. Evaluation of Tone Mapping Operators using a High Dynamic Range Display. Proceedings of ACM 2005 SIGGRAPH Conference, 249-258. Reinhard, E., Stark, M., Shirley, P., Ferwerda, J. 2002. Photographic Tone Reproduction for Digital Images, Proceedings of ACM SIGGRAPH 2002 Conference. Reinhard, E., Ward, G., Pattanaik, S., Debevec, P. 2005. High Dynamic Range Imaging: Acquisition, Display, and Image-Based Lighting, San Francisco: Morgan Kaufman Publishing. Roberts, A., Marsh A.J. 2001. ECOTECT: Environmental Prediction in Architectural Education. Proceedings of 19th ECAADE Conference. Helsinki, Finland. Stumpfel J., Jones A., Wenger A., Debevec P. 2004. Direct HDR capture of the sun and sky. 3rd International Conference on Virtual Reality, Computer Graphics, Visualization and Interaction in Africa, Cape Town, South Africa. Ward, G., Rushmeier, H. and Piatko, C. 1997. A Visibility Matching Tone Reproduction Operator for High Dynamic Range Scenes, IEEE Transactions on Visualization and Computer Graphics. 3(4), 291-306. Newsham, G.R., Aries, M., Mancini S., Faye G. 2008. Individual control of electric lighting in a daylit space. Lighting Research and Technology, 40(1), 25–41. Ward, G. 1994. The Radiance Lighting Simulation and Rendering System. Proceedings of the 21st Annual Conference on Computer Graphics and Interactive Techniques, Orlando, FL. Ward, G. 2005. Photosphere. Accessed February 2013.
- 3406 -
Proceedings of BS2013: 13th Conference of International Building Performance Simulation Association, Chambéry, France, August 26-28
Wienold, J., Christofferson, J. 2006. Evaluation Methods and Development of New Glare Prediction Model for Daylight Environments with the use of CCD cameras. Energy and Buildings, 38(7):743-57. Yoshida, A., Blanz, V., Myskowski, K., Seidel, H.P. 2005. Perceptual Evaluation of Tone Mapping Operators with Real-World Scenes. Human Vision and Electronic Imaging X, IS&T/SPIE's 17th Annual Symposium on Electronic Imaging, 756-768.
- 3407 -