Heart rate variability: A measure of cardiac autonomic tone. Phyllis K. Stein, PhD, Matthew S. Bosner, MD, Robert E. Kleiger, MD, and. Brooke M. Conger, BS St.
CURRICULUM IN CARDIOLOGY
Heart rate variability: autonomic tone
A measure
of cardiac
Phyllis K. Stein, PhD, Matthew S. Bosner, MD, Robert E. Kleiger, MD, and Brooke M. Conger, BS St. Louis, MO.
The beat of the healthy heart is not absolutely regular. It varies as a result of many factors, including exercise and physical and mental stress. In addition, the intervals between normal sinus beats vary periodically because of respiration, blood pressure regulation, thermoregulation, actions of the renin-angiotensin system, circadian rhythms, and other unknown factors. Such periodic rhythms are in fact the predominant source of heart rate variability. By using Holter recordings, these rhythms can be analyzed to provide a sensitive, noninvasive measurement of autonomic input to the heart. There are two approaches to measurement of heart rate variability (HRV): analysis in the time or in the frequency domain. These measures are based on the analysis of interbeat intervals of normal beats determined from a routine 24-hour ambulatory electrocardiogram. Time domain analysis addresses the question of “How much variability is there?” Time domain values result from simple, statistical calculations performed on the set of interbeat intervals. Frequency domain analysis addresses the question “What are the underlying rhythms?” In the frequency domain, Fourier analysis is used to partition the total variance of the heart rate into the variance accounted for by underlying groups of frequencies, somewhat like decomposing the sound of a symphony orchestra into the underlying notes. TIME DOMAIN
Time domain indexes are relatively easy to calculate. There are two classes of time domain variables, one based on interbeat intervals and the other based From the Division of Cardiology, Jewish Hospital of St. Louis, Washington University Medical Center. Received for publication Aug. 2, 1993; accepted Sept. 22, 1993. Reprint requests: Phyllis K. Stein, PbD, Jewish Hospital of St. Louis, 216 S. Kingshighway Blvd., St. Louis, MO 63110. AM HEART J 1994;127:1376-81. Copyright @ 1994 by Mosby-Year Book, Inc. 0002-8703/94/$3.00 + 0 4/l/53508
1376
on comparisons of the lengths of adjacent cycles. Those based on interbeat intervals include SDNN (the standard deviation of all normal R-R intervals [that is, N-N intervals]), which has also been called CLV (cycle length variability), and SDANN (the standard deviation of the mean of the &minute intervals, averaged over a 24-hour period). A geometric approach to quantifying interbeat intervalbased HRV involves measuring the baseline width (in msec) of the main triangle superimposed on the histogram of all interbeat interva1s.l This method has the advantage of being less dependent on accurate classification of individual beats. Another time domain index of heart rate variability, SDNNIDX, is the average of the SDS of interbeat intervals for each &minute interval, an intermediate between longand short-term variability. These interbeat intervalbased measures are broad-based and are influenced by both short-term (for example, respiratory) and long-term (for example, circadian) factors and are measured in milliseconds. The second class of time domain variables based on comparisons of lengths of adjacent cycles includes pNN50 (the proportion of adjacent cycles that are >50 msec apart, measured in percent), and r-MSSD (the root mean square successive differences), which is the square root of the averaged sum of squared differences in length between all adjacent N-N cycles. These variables are virtually independent of long-term trends and predominantly reflect vagal tone.2 Table I summarizes the time domain indexes of HRV. FREQUENCY
DOMAIN
Analysis in the frequency domain is mathematically more complex, and requires a Holter system with an accurate timing track. However, it has been used by a number of investigators.1p3*4 Frequency domain analysis yields information about the amount of the overall variance in heart rate resulting from periodic oscillations of heart rate at various frequencies. Because heart rate (or, more accurately, heart
Volume 127, Number 5 American Heart Journal
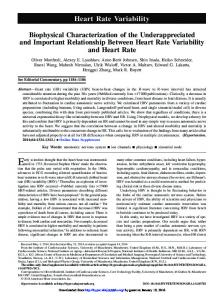
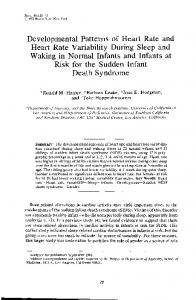
period) is measured in milliseconds, variance, which is referred to as the “power” in a portion of the total spectrum of frequencies, is measured in milliseconds squared. Some investigators report spectral “amplitude,” which is the square root of power and is measured in milliseconds. Fig. 1 represents a hypothetical analysis in the frequency domain. In this drastically simplified example, total variability is assumed to be a result of only three frequencies, shown superimposed in Fig. 1 (top left): a “high” frequency of 0.25 Hz (15 cycles per minute), a “low” frequency of 0.1 Hz (6 cycles per minute), and a “very low” frequency of 0.016 Hz (1 cycle per minute). Fig. 1 (top right) shows the signal that results when the underlying frequencies in Fig. 1 (top left) are combined. Finally, Fig. 1 (bottom left) shows the result of a Fourier analysis on the signal in Fig. 1 (top right). Note that the original frequencies reappear on the x axis and that the amount of the total signal variance explained by each frequency (which is proportional to the square of the amplitude of the original signal) is represented by the area under each of the power spectral peaks. Our approach has been to classify the power spectrum into four bands (Table II). High frequency power (HF), which is parasympathetically mediated and represents primarily respiratory variation, is in the 0.15 to 0.4 Hz band.3 Low frequency power (LF), which is modulated by both the sympathetic and parasympathetic nervous systems and strongly affected by the oscillatory rhythm of the baroreceptor system,5 is in the 0.04 to 0.15 Hz band. Very low frequency power (VLF, 0.0033 to 0.04 Hz band) and ultra low frequency power (ULF, 1.15 x 10m5 to 0.0033 Hz) may represent the influence of the thermoregulatory,6 peripheral vasomotor,6 or renin-angiotensin7 systems. Measurement of ULF, which contains most of the variance in the 24-hour spectrum, is based on the entire 24-hour recording and also reflects circadian rhythms, whereas VLF may be obtained from a 15-minute sequence of N-N intervals.8 Total power (TP) is the total variance in the signal and represents the sum of HF, LF, VLF, and ULF. Earlier studies included only the HF and LF spectra, and thus TP determined by this method may grossly underestimate the true TP. Since these power frequency distributions are skewed for statistical purposes, the natural log transform of power values is used. Not surprisingly, time and frequency domain measures of HRV are related. For every frequency domain measure, there is a time domain measure that strongly correlates with it (>0.85).2 HF correlates with r-MSSD and pNN50; LF and VLF correlate with SDNNIDX; ULF correlates well with SDNN
Stein et al.
1377
Table I. Definitions for time domain measures of heart period variability Variable
Units
SDNN
Msec
SDANN
Msec
SDNNIDX
Msec
pNN50
%
r-MSSD
Msec
Baseline width
Msec
Definition
Standard deviation of all normal R-R intervals in the entire 24-hr ECG recording (also referred to as SDRR or CLV) Standard deviation of the mean of all 5-min segments of normal R-R intervals of a 24-hr recording Mean of the standard deviations of all normal R-R intervals for all 5-min segments of a 24-hr ECG recording Percent of difference between adjacent normal R-R intervals that are greater than 50 msec computed over the entire 24-hr ECG recording Root mean square successive differences, the square root of the mean of the sum of the squares of differences between adjacent normal R-R intervals over the entire 24-hr ECG recording Width of baseline of main triangle superimposed on the histogram of R-R intervals
and SDANN. TP should be identical to the square of SDNN, since both are measures of the total variance in the heart rate signal. Also, indexes of HRV have been shown to be stable, at least over a 3- to 65-day interval, and there is no placebo effect on HRV.2 This lack of intraindividual variability over time make measurement of HRV an excellent tool for studying autonomic input to the heart. SUDDENDEATH
Abnormalities of autonomic input to the heart have been linked to ventricular arrhythmias during myocardial ischemia or congestive heart failure.gp lo
1378
Stein et al.
American
100
250
80
200
60 40
3
G
150
a
100
E a f
50
-20
-40 -80
_m 'Z -50 Q u -100
-80
-150
E
x
20
I 0 P
s 3 d
May 1994 Heart Journal
0
-200
-100 0
10
20
30
40
50
60
0
10
20
Time (set)
30
40
50
60
Time (set)
2500
2000
Three Different Rhythms: 4 s500
High Frequency
= 0.25 Hz (15 cycledmin.)
Low Frequency
= 0.1 HZ (6 cycles/min.)
ill;/
Very Low Frequency
0L 0
0.1
0.2
0.3
0.4
0.5
Frequency
0.8
0.7
0.8
= 0.016 Hz (1 cycle/min.)
0.9
(Hz)
Fig. 1. Top left, Three sinusoidal signals: 1 cycle/min, 6 cycles/min, and 15 cycles/min shown superimposed on the same scale. Top right, Same three signals combined into one signal. Bottom left, Power spectral analysis of signal shown top right. Table II. Definitions rate variability Variable
for frequency Frequency range
High frequency power (HF) Low frequency power (LF) Very low frequency power (VLF)
0.15-0.40
Hz
0.04-0.15
Hz
Ultra low frequency power (ULF)
1.15 x 10-S - 0.0033 Hz
Total power UP)
l/15 x 10-S x 0.40 Hz
0.0033-0.04
Hz
domain
indices
of heart
Cycles/Time Time/Cycle
or
9 to 24 cycledmin 2.5 to 6.6 set/cycle 2.4 to 9 cycles/min 6.6 to 25 set/cycle 0.2 to 2.4 cycles/ min 25 set/cycle to 5 min/cycle 1 cycle/24 hr to 0.2 cycledmin 24 hr/cycle to 5 min/cycle 1 cycle/24 hr to 24 cycledmin 24 hr/cycle to 2.5 sedcycle
Ventricular arrhythmias are accepted as significant precursors to sudden death in patients with ischemic or nonischemic causes of decreased ventricular function. Factors that increase sympathetic or decrease parasympathetic nervous system activity increase the likelihood of ventricular arrhythmias and, conversely, those that decrease sympathetic or increase parasympathetic nervous system activity decrease the likelihood of ventricular arrhythmias.rOv l1 Generally speaking, increased sympathetic or decreased parasympathetic tone are reflected in decreased indices of HRV, while decreased sympathetic or increased parasympathetic nervous system activity are reflected in increased indices of HRV. Importantly, decreased indices of HRV have shown great value as a predictor of mortality in various clinical populations. l2 Decreased HRV (CLV