Physiology & Behavior 92 (2007) 293 – 316
Review
Heart rate variability as a measure of autonomic regulation of cardiac activity for assessing stress and welfare in farm animals — A review Eberhard von Borell a,⁎, Jan Langbein b , Gérard Després c,i , Sven Hansen a , Christine Leterrier d , Jeremy Marchant-Forde e , Ruth Marchant-Forde e , Michela Minero f , Elmar Mohr g , Armelle Prunier h , Dorothée Valance d , Isabelle Veissier i a Institute of Agricultural and Nutritional Sciences, Martin-Luther-University Halle-Wittenberg, 06108 Halle, Germany Research Unit Behavioural Physiology, Research Institute for the Biology of Farm Animals, 18196 Dummerstorf, Germany c UFR Psychologie, Sciences Sociales et Sciences de l'Education, Université Blaise Pascal, 63037 Clermont-Ferrand, France d Recherches Avicoles, I.N.R.A., 37380 Nouzilly, France e USDA-ARS, Livestock Behavior Research Unit, West Lafayette, IN 47909, USA f Institute of Zootechnics, Faculty of Veterinary Medicine, 20133 Milano, Italy Department of Agricultural Ecology, Agricultural and Environmental Sciences Faculty, University of Rostock, 18051 Rostock, Germany h Unité Mixte de Recherche I.N.R.A.-Agrocampus SENAH, 35590 Saint-Gilles, France i Unité de Recherches sur les Herbivores, I.N.R.A., 63122 Saint Genes-Champanelle, France b
g
Received 20 January 2006; received in revised form 12 January 2007; accepted 15 January 2007
Abstract Measurement of heart rate variability (HRV) is a non-invasive technique that can be used to investigate the functioning of the autonomic nervous system, especially the balance between sympathetic and vagal activity. It has been proven to be very useful in humans for both research and clinical studies concerned with cardiovascular diseases, diabetic autonomic dysfunction, hypertension and psychiatric and psychological disorders. Over the past decade, HRV has been used increasingly in animal research to analyse changes in sympathovagal balance related to diseases, psychological and environmental stressors or individual characteristics such as temperament and coping strategies. This paper discusses current and past HRV research in farm animals. First, it describes how cardiac activity is regulated and the relationships between HRV, sympathovagal balance and stress and animal welfare. Then it proceeds to outline the types of equipment and methodological approaches that have been adapted and developed to measure inter-beats intervals (IBI) and estimate HRV in farm animals. Finally, it discusses experiments and conclusions derived from the measurement of HRV in pigs, cattle, horses, sheep, goats and poultry. Emphasis has been placed on deriving recommendations for future research investigating HRV, including approaches for measuring and analysing IBI data. Data from earlier research demonstrate that HRV is a promising approach for evaluating stress and emotional states in animals. It has the potential to contribute much to our understanding and assessment of the underlying neurophysiological processes of stress responses and different welfare states in farm animals. © 2007 Elsevier Inc. All rights reserved. Keywords: Cardiac activity; Heart rate variability; Stress; Welfare; Farm animals
Contents 1. 2.
Introduction . . . . . . . . . . . . . . . . . . . . . . . . . . . . . . . . . . . . . . . . . . . . . . . . . . . . . . . . . . . . . Regulation, interpretation and significance of heart rate variability (HRV) in relation to stress and behaviour . . . . . . . . . . . 2.1. Regulation of heart beat activity. . . . . . . . . . . . . . . . . . . . . . . . . . . . . . . . . . . . . . . . . . . . . . . .
⁎ Corresponding author. Tel.: +49 345 5522332; fax: +49 345 5527106. E-mail address:
[email protected] (E. von Borell). 0031-9384/$ - see front matter © 2007 Elsevier Inc. All rights reserved. doi:10.1016/j.physbeh.2007.01.007
294 295 295
294
E. von Borell et al. / Physiology & Behavior 92 (2007) 293–316
2.2. Heart rate variability (HRV) . . . . . . . . . . . . . . . . . . . . . . . . . . . . . . . . . . . . . . . . . . . . . 2.3. Interpretation and significance . . . . . . . . . . . . . . . . . . . . . . . . . . . . . . . . . . . . . . . . . . . . 2.4. Vagal tone as a stress indicator. . . . . . . . . . . . . . . . . . . . . . . . . . . . . . . . . . . . . . . . . . . . 2.5. HRV and behaviour . . . . . . . . . . . . . . . . . . . . . . . . . . . . . . . . . . . . . . . . . . . . . . . . . 3. Methodology of measurement and analysis of HRV in farm animals . . . . . . . . . . . . . . . . . . . . . . . . . . . . 3.1. Equipment for recording cardiac activity . . . . . . . . . . . . . . . . . . . . . . . . . . . . . . . . . . . . . . . 3.2. General recommendations for recording of IBIs . . . . . . . . . . . . . . . . . . . . . . . . . . . . . . . . . . . 3.3. Methods of HRV analysis . . . . . . . . . . . . . . . . . . . . . . . . . . . . . . . . . . . . . . . . . . . . . . 3.3.1. Time domain analysis . . . . . . . . . . . . . . . . . . . . . . . . . . . . . . . . . . . . . . . . . . . . 3.3.2. Geometric analyses . . . . . . . . . . . . . . . . . . . . . . . . . . . . . . . . . . . . . . . . . . . . . 3.3.3. Spectral analysis of HRV by FFT — basic requirements and limits . . . . . . . . . . . . . . . . . . . . 3.3.4. Recommendations for the FFT analysis of HRV . . . . . . . . . . . . . . . . . . . . . . . . . . . . . . 3.3.5. Non-linear analysis of HRV by recurrence quantification analysis . . . . . . . . . . . . . . . . . . . . . 4. HRV in applied animal research: methodology and interpretation of HRV in pigs, cattle, horses, sheep, goats and poultry 4.1. Heart rate variability in pigs . . . . . . . . . . . . . . . . . . . . . . . . . . . . . . . . . . . . . . . . . . . . . 4.1.1. Issues researched . . . . . . . . . . . . . . . . . . . . . . . . . . . . . . . . . . . . . . . . . . . . . . 4.1.2. Methodology . . . . . . . . . . . . . . . . . . . . . . . . . . . . . . . . . . . . . . . . . . . . . . . . 4.1.3. Specific conclusions and recommendations . . . . . . . . . . . . . . . . . . . . . . . . . . . . . . . . . 4.2. Heart rate variability in cattle . . . . . . . . . . . . . . . . . . . . . . . . . . . . . . . . . . . . . . . . . . . . 4.2.1. Issues researched . . . . . . . . . . . . . . . . . . . . . . . . . . . . . . . . . . . . . . . . . . . . . . 4.2.2. Methodology . . . . . . . . . . . . . . . . . . . . . . . . . . . . . . . . . . . . . . . . . . . . . . . . 4.2.3. Specific conclusions and recommendations . . . . . . . . . . . . . . . . . . . . . . . . . . . . . . . . . 4.3. Heart rate variability in horses . . . . . . . . . . . . . . . . . . . . . . . . . . . . . . . . . . . . . . . . . . . . 4.3.1. Issues researched . . . . . . . . . . . . . . . . . . . . . . . . . . . . . . . . . . . . . . . . . . . . . . 4.3.2. Methodology . . . . . . . . . . . . . . . . . . . . . . . . . . . . . . . . . . . . . . . . . . . . . . . . 4.3.3. Specific conclusions and recommendations . . . . . . . . . . . . . . . . . . . . . . . . . . . . . . . . . 4.4. HRV in sheep and goat. . . . . . . . . . . . . . . . . . . . . . . . . . . . . . . . . . . . . . . . . . . . . . . . 4.4.1. Issues researched . . . . . . . . . . . . . . . . . . . . . . . . . . . . . . . . . . . . . . . . . . . . . . 4.4.2. Methodology . . . . . . . . . . . . . . . . . . . . . . . . . . . . . . . . . . . . . . . . . . . . . . . . 4.4.3. Specific conclusions and recommendations . . . . . . . . . . . . . . . . . . . . . . . . . . . . . . . . . 4.5. Heart rate variability in poultry . . . . . . . . . . . . . . . . . . . . . . . . . . . . . . . . . . . . . . . . . . . 4.5.1. Issues researched . . . . . . . . . . . . . . . . . . . . . . . . . . . . . . . . . . . . . . . . . . . . . . 4.5.2. Methodology . . . . . . . . . . . . . . . . . . . . . . . . . . . . . . . . . . . . . . . . . . . . . . . . 4.5.3. Specific conclusions and recommendations . . . . . . . . . . . . . . . . . . . . . . . . . . . . . . . . . 5. General conclusions and recommendations for future research . . . . . . . . . . . . . . . . . . . . . . . . . . . . . . . Appendix A. Abbreviations and main definitions . . . . . . . . . . . . . . . . . . . . . . . . . . . . . . . . . . . . . . . . References . . . . . . . . . . . . . . . . . . . . . . . . . . . . . . . . . . . . . . . . . . . . . . . . . . . . . . . . . . . .
1. Introduction The “measuring welfare” working group of the EU concerted action on ‘Measuring and Monitoring Welfare’ (COST Action 846) has identified key areas of research that have the potential to contribute to our understanding and interpretation of stress and welfare status in farm animals. The “Heart Rate and Heart Rate Variability Task Force” has brought together experts in the fields of animal and veterinary sciences who are concerned with research on cardiac activity and heart rate variability (HRV) in farm animals. Their principle goal is to write a report on the state of the art of HRV in farm animals, similar to a task force that had been previously set up by the European Society of Cardiology (ESC) and the North American Society of Pacing and Electrophysiology [NASPE, [1]]. The purpose of this review is to: 1) collate information on the current status of HRV measurement techniques, data handling, analysis and interpretation; 2) outline appropriate methodology for different farm animal species, and; 3) identify areas of future HRV research that may improve our ability to evaluate stress and welfare status in farm animals.
. . . . . . . . . . . . . . . . . . . . . . . . . . . . . . . . . . . . .
. . . . . . . . . . . . . . . . . . . . . . . . . . . . . . . . . . . . .
. . . . . . . . . . . . . . . . . . . . . . . . . . . . . . . . . . . . .
. . . . . . . . . . . . . . . . . . . . . . . . . . . . . . . . . . . . .
. . . . . . . . . . . . . . . . . . . . . . . . . . . . . . . . . . . . .
295 296 296 297 297 297 298 299 299 300 300 301 301 303 303 303 304 305 305 305 305 306 306 306 306 307 307 307 308 308 308 308 309 309 309 310 311
Some of the most remarkable, non-invasive, measures of the functioning of the autonomic nervous system (ANS) are indices of HRV. Detailed and sophisticated analysis of shortterm fluctuations in instantaneous heart period has been widely used to indirectly assess ANS regulation of cardiovascular function [1,2]. In humans, the last three decades have witnessed the recognition of notable relationships between autonomic function and various diseases and mental states [3,4], including cardiac dysfunction, sudden cardiac death [5–7], diabetic autonomic neuropathy [8,9], hypertension [10–12] and psychiatric disorders [13–16]. Analysis of HRV has additionally been used as an indicator of acute and chronic stress [17,18], mental challenges and emotional states [15,19–23]. In the past decade, HRV has also been applied increasingly in veterinary and behavioural research to investigate changes in sympathovagal balance related to pathological conditions [24–26], stress [27–31], behavioural dysfunction [32,33], management practices [34–36], training regimes [37–39] as well as temperament and emotional states [40–42] in a number of farm and companion animal species.
E. von Borell et al. / Physiology & Behavior 92 (2007) 293–316
2. Regulation, interpretation and significance of heart rate variability (HRV) in relation to stress and behaviour 2.1. Regulation of heart beat activity The sinoatrial node (SN) acts as the primary pulse generator for heart beats. Other sympathetic and parasympathetic neurons and local circuits of the intrinsic cardiac nervous system, as well as the artrioventricular (AV) nodes, are also capable of exhibiting autonomous heart beat stimulation properties [43,44]. The SN, as the principal pacemaker, exhibits the highest discharge frequency and excites other cardiac centres (such as the AV node) before they themselves initiate their own electrical impulses [45]. The SN contains two types of cells, elongated and round. The round, or pacemaker, cells are capable of spontaneous depolarisation that initiates electrical activation within the heart itself. In the absence of autonomic innervation, or during complete autonomic blockage, the discharge rate of pacemaker cells represents intrinsic heart rate (HR). In humans, the SN generates an intrinsic HR of between 100 and 120 beats per minute (bpm) in the absence of any neural and hormonal influences [45]. The SN is under the control of the parasympathetic (vagal, PNS) and sympathetic nervous system (SNS) [46]. Both left and right vagus nerves stimulate the SN (the right nerve is dominant and reduces HR), the AV node (left nerve is dominant and prolongs AV conduction) as well as the atrium muscle, whereas efferent control of the ventricle muscle is still unclear [47]. In general, activity within the vagal nerves decreases HR when the stimulatory effect of the right nerve dominates [48]. Postganglionic sympathetic fibres innervate almost all centres of the heart including the AV, heterotrophic centres, atrium and ventricle myocardium [47]. Activity within the right Ansa subclavia (right sympathetic nerve) mostly influences HR, whereas left Ansa subclavia activity impacts stroke volume [49]. Under resting conditions, both branches of the ANS are tonically active when regulating cardiac activity with a dominance of vagal regulation [47]. Rapid changes in HR are always caused by shifts in vagal regulation [47,50–52]. The SN responds to vagal activity within one or two heart beats, but its overall effects are relatively shortlived. Vagal induced changes in HR typically occur within 5 s [47] whereas cardiac responses to SNS regulation occur more slowly with initial response delays of up to 5 s, followed by a progressive
295
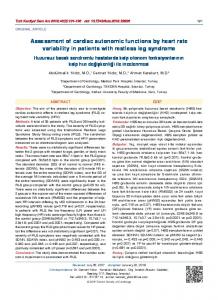
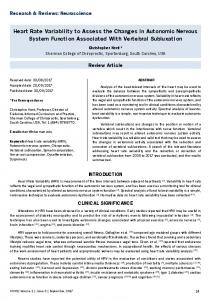
change and a maximum response after 20 to 30 s [47,53]. These differences in response times are due in part to the relatively slow exocytotic release of noradrenaline from sympathetic nerve terminal through which the SNS regulates cardiac activity. Also, unlike PNS acetylcholine mechanisms, a secondary messenger (adenylyl cyclase) is involved in SNS regulation which further slows the process. Other anatomical disparities between the autonomic branches may also contribute to the slower response rate associated with SNS regulation. For instance, the preganglionic cell bodies of the PNS neurons are located within the heart itself, whereas those of the sympathetic neurons are comparatively isolated in the paravertebral ganglia. Furthermore, preganglionic fibres are also myelinated contributing to faster electrical transmission of vagal regulatory signals compared to transmission rates in unmyelinated SNS fibres. 2.2. Heart rate variability (HRV) Healthy cardiac function is characterised by irregular time intervals between consecutive heart beats [54]. This variability is a result of rhythmic oscillation of the regulatory components of cardiac activity that function to maintain cardiovascular homeostasis within a defined range and to orchestrate responses to challenges [46,55]. HRV primarily emerges through the nonadditive activity originating from the individual branches of the ANS [56–59] (Fig. 1), which in turn is influenced by neuronal, humoral and other physiological control and feedback mechanisms [55,60]. The central nervous system (CNS), in particular the formatio reticularis of the medulla oblongata (medullar circulation centre), the hypothalamus, and neocortical and paleocortical areas also participate in all levels of cardiovascular regulation (Fig. 2) [61–64]. An oscillatory curve (tachogram) is produced when consecutive IBIs are plotted on a time scale [55]. The “mixed oscillation” of this curve results from the rhythmic pulses of the different regulatory components, where rhythmic activities originating from the PNS exhibit higher frequency than those of the SNS (see Fig. 1). Fluctuations in vagal tone are linked to variations in activity of the vagal nuclei which are influenced by baroreceptors since vagal receptivity for baroreceptor input varies with the breathing cycle [52]. HRV was first documented in the 18th century by Hales who did the first published quantitative measurements on arterial blood
Fig. 1. Simplified model for the formation of HRV and the structure of the cardiovascular control [modified from [221]].
296
E. von Borell et al. / Physiology & Behavior 92 (2007) 293–316
Fig. 2. Structure of the cardiovascular control; modified from [modified from [62]]. Centre (dotted rectangle) in the medulla. DMNX = Vagal Dorsal Motor Nucleus, HYP = Hypothalamus, NA = Nucleus Ambiguus, NTS = Nucleus Tractus Solitarii, RVLM = Rostral Ventrolateral Medulla.
pressure (BP) [cited by [65]]. This work demonstrated a relationship between breathing cycles, BP and the interval between two consecutive heart beats. Since then, indices of HRV have been incorporated into a large body of research evaluating different physical, pathological and psychological conditions, and have been applied very successfully to the understanding and diagnosis of cardiovascular diseases and autonomic dysfunction in humans and animals [66]. In comparison to the many publications in biomedical research, however, the application of HRV in applied animal studies is still very much in its infancy and published work is mainly very basic in nature [60,67]. Nevertheless, HRV is progressively emerging as a suitable indicator of stress and welfare status in farm animal research. 2.3. Interpretation and significance HR, at any point in time in healthy individuals, represents the net interactions between vagal (which reduces HR) and sympathetic (which increases HR) regulation [47,68]. At rest, vagal regulation dominates whereas increasing physical activity is frequently characterised by decreasing vagal and increasing sympathetic influences. A rise in HR is mainly caused by an increase in sympathetic activity [47] but it may also result from a decrease in vagal regulation or from simultaneous changes in both regulatory systems. Separate effects of the two branches of the autonomic nervous systems cannot be determined by simple addition or subtraction of the relative components [47]. Indeed, the branches do not necessarily function on a continuum when regulating cardiac activity, where an increase in one branch results in a decrease in the other. Rather, they have the ability to behave either synchronously or independently of each other, giving rise to the potential for multiple patterns of activation [see [69]]. It is therefore difficult to assess the functional
regulatory characteristics of the ANS with simple measurements of HR [70]. An increase in HR may result from reduced vagal activity as well as from increased sympathetic activity or, in most cases, from a combination of concurrent changes in activity within both branches. In reality, however, the interplay between the branches is quite complex, mean HR parameters provide information on the net effects of all components inputting into cardiac activity and are of limited use for accurately assessing sympathovagal regulation [71]. HRV analysis, on the other hand, allows a much more accurate and detailed determination of the functional regulatory characteristics of the ANS. HRV is a particularly good indicator for the non-invasive assessment of ANS activity in response to psychophysiological stress [55]. Psychological states may have an impact on sympathovagal balance in the absence of any palpable changes in heart and/or respiration rates [72]. For example, Sleigh and Henderson [73] failed to demonstrate any relationship between mean HR and anxiety during pre-surgery stress but found a reduction in the relative intensity of the HFcomponent in the power spectrum of HRV (representing a decrease in vagal activity) which was positively correlated with pre-surgery anxiety levels. Furthermore, McCraty et al. [74] found a notable decrease in HRV in relation to reduced wellbeing, particularly in the frequencies of the power spectrum that are sensitive to PNS modulations, whereas no effect was seen on overall mean HR. Catipovic-Veselica et al. [75] reported interactions between basic emotions, such as fear and aggression, and HRV that were also not evident in HR responses. Finally research in children illustrate a negative relationship between HRV (vagal tone, both basal levels and magnitude of change) and the emergence of subsequent behavioural problems, contact issues, aggressiveness, depression, and sleep disorders when no significant correlations with HR parameters were evident [76]. Although most papers in the published literature on emotional states and HRV relate to humans, there are strong arguments that the same principles can be applied to non-human mammals since: (1) the phylogenetic ‘old’ limbic system is considered as the neural substrate for emotions and is similarly present in both humans and other mammals [77]; (2) electrical stimulation of the hypothalamus and the limbic system in animal models lead to similar emotional responses to those seen in humans [63]; (3) the endogenous impact of emotions is transmitted via the vegetative nervous system in both humans and other mammals, and; (4) the functional control of vagal tone is similar in all mammals [78]. For a broader discussion of this topic see also the review on positive emotions in farm animal in this issue. 2.4. Vagal tone as a stress indicator Since the time of researchers such as Walter Cannon [79], stress research has mainly focused on the role the SNS plays in orchestrating stress responses. Studies involving pharmacological activation or blockade of ANS activity suggest that sympathetic tone may not be simply or directly derived from HRV parameters [80,81]. There are, however, many studies that have demonstrated the usefulness of the LF/HF ratio of the
E. von Borell et al. / Physiology & Behavior 92 (2007) 293–316
power spectrum as an indicator of sympathetic activity during a number of physical and psychological stresses [e.g. [82]] with an increase in the LF/HF ratio being interpreted as a regulatory shift towards sympathetic dominance (see details in 3.3). Although there is an ongoing debate regarding the suitability of using HRV parameters to estimate SNS activity, this approach produces reliable measures of vagal tone during both times of stress and homeostasis [83,84]. Porges [84] defines homeostasis as an autonomous state which enhances visceral functions and is characterised by increased vagal activity. Stress responses can therefore be quantified on this physiological level with relative changes in vagal activity serving as the measurable parameter. In addition, basal autonomic states could also be considered as an index for an individual's susceptibility to stress with individuals with low vagal tone potentially being more vulnerable to stress. High vagal tone has been linked to efficient autonomic regulatory activity which enables an organism to increase its sensitivity and response to physiological and environmental challenges [37,59,76]. For instance, Doussard-Roosevelt et al. [85] found that high vagal tone in newborn humans was related to greater mental, motor and social abilities at 3 years of age. Positive emotions may significantly increase the HFcomponent of a power spectrum [72,74] whereas the opposite occurs with negative emotions. Indeed, Friedman and Thayer [86] examined HRV (time and frequency analysis) in people who suffered from panic attacks or blood phobia and found that those who experienced panic attacks had lower vagal tone than those with a blood phobia, while normal controls exhibited the highest tone. Children that exhibited greater flexibility in vagal tone in response to social and attention tasks demonstrated fewer behavioural problems at a later age [76]. It seems apparent, therefore, that vagal tone is a useful indicator for determining the physiological and psychological flexibility of an organism and for measuring their susceptibility, or ability to respond, to stress [86]. 2.5. HRV and behaviour Changes in cardiac activity are strongly influenced by behaviour, particularly those that are related to physical activity [39,40,87–92]. This motor or physical component is often inappropriately compared with non-motor or psychological components [87,89,93]. For comparisons of non-motor components of cardiac activity, only measures made during times of similar behavioural patterns should be compared [67]. This highlights a potential methodological difficulty in stress and welfare research since treatments often induce behavioural reactions that are not seen under normal control conditions. Another important consideration is that changes in cardiac function may occur in an anticipatory manner prior to the expression of any alterations in behaviour. These anticipatory changes in cardiac activity have been observed to occur in several species of animals. For instance, it is not uncommon to see tachycardia several seconds before the emergence of a behavioural flight in horses, sheep and birds [93–96]. On the other hand, a cardiac response may also persist beyond the expression of the specific behavioural event that it was initially
297
associated with. In order to accurately analyse the complex oscillatory characteristics of HRV, longer measurement periods are needed than for simpler HR indices for which, theoretically, a single IBI may be sufficient. The Task Force of the ESC and NASPE [1] recommends that IBI data sets undergoing HRV analyses should contain at least 5-min of consecutive IBIs measured during stationary conditions. 3. Methodology of measurement and analysis of HRV in farm animals 3.1. Equipment for recording cardiac activity Various portable equipment is commercially available for detecting and storing electrocardiograms (ECG) for later detection of IBIs. Some of these systems are designed for ambulatory long-term recording of ECG (mostly up to 24 h), like Holter systems (Del Mar Reynolds Medical, Hertford, UK; Schiller, Switzerland; Rozinn Electronics, Inc. USA), and are widely used in human medicine. They are often combined with specific algorithms for the detection of IBIs and analysis of HRV (Biopac, Po-Ne-Mah or Cardiopro). However, these systems are very expensive and especially adapted for the study of human cardiac activity. An affordable alternative is to use commercially available monitors that detect the R-peaks of the ECG during recording and then store IBI data in digital form. To our knowledge, there is currently only one commercial manufacturer (Polar Electro Öy, Finland) who has developed such devices that are primarily marketed for sport and research in sport medicine. There are two different models available on the market that record cardiac activity and detect IBIs at a sampling rate of 1000 Hz. The storage capacity of the first model (S810i) can continuously record up to 16,000 IBIs. Postulating a mean HR of around 70 beats per minute (bpm), its maximum recording time is therefore about 4 h. The S810i, and its predecessor the Vantage NV (stores 4000 IBIs), have been widely applied in veterinary and behavioural research [30,35,36,67,97]. Another model, the Polar R–R Recorder, is a digital 24-h ambulatory monitor that can record IBI data over much longer periods [98,99]. Moreover, this device can also store short (20 s) epochs of ECG which is not possible with the other Polar models. These devices use an electrode belt containing two coated electrodes that fits around the thorax of the wearer. Detection of the IBI is carried out during recording and the resulting IBI data are transmitted wirelessly and stored in a data logger. These data may then be downloaded onto a PC for later analysis of HRV. There are two different types of electrode chest belts available for use with these monitors. For smaller animals like goats, sheep, pigs, and calves, a standard belt with an elastic strap can easily be adapted to fix around the thorax of the animal. For large animals, like cattle or horses, a specific transmitter with two separated electrodes should be used to optimise electrode positioning. All can transmit detected IBIs as coded signals to avoid any cross talk between different devices recording at the same time within a given area. Beside the Polar system, various non-commercial mobile systems have also been developed to record not only IBI data but also ECG in
298
E. von Borell et al. / Physiology & Behavior 92 (2007) 293–316
unrestrained animals [28,100]. Another approach to measure R–R intervals non-invasively is the use of implantable telemetric transmitters (Data Sciences International, St. Paul, MN, USA). Devices of this kind have been applied in a wide range of laboratory animals like rats [101,102] and mice [103], but also in monkeys [104], dogs [105], poultry [29], goats [106] and pigs [27]. However, there are some restrictions with the use of such implants in middle and large size animals. For the implantation of the transmitter and for the correct electrode positioning complete anaesthesia of animals is necessary. After surgery, animals need several days for recovery and, as with any invasive procedure, complications can emerge. More recent adaptation to this equipment, including the development of intracardiac bipolar electrodes, that virtually eliminates muscle derived signal noise, and a Repeater, that can transmit signals over greater ranges (up to 8 m), greatly improves its suitability for use in large, ambulatory, farm animals. A general concern with cardiac monitors that only record IBI data is testing their reliability and identifying true errors in the data. As the ECG signal itself is not recorded, there is no absolute way to identify errors in IBI measurements after data collection [99,100]. Several studies have been carried out in cattle and horses, investigating the reliability of these monitors for measuring HR relative to a standard ECG [107,108]. In humans, Kingsley and colleagues [109] recently compared the Polar S810i to an ambulatory ECG system (Reynolds, UK) and did not find any differences between the IBI data measured by the two systems. Similarly, good reproducibility was observed both in time- and in frequency domain measures of HRV in healthy subjects comparing the 24 h R–R Recorder with a highquality Holter recorder [110]. Various approaches, from simple visual correction to more sophisticated algorithms, have been developed to correct IBI data for artefact that occur due to the misidentification of Rpeaks and ectopic beats. Artefacts may occur as a result of poor electrode-skin conductance, equipment malfunction, noises from muscle action potentials and environmental electromagnetic interference [111–116]. In any case, IBI data should be edited to ensuring correct identification and correction of IBIs.
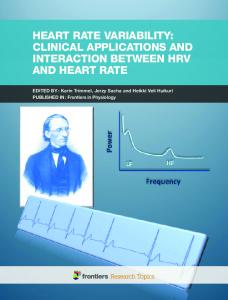
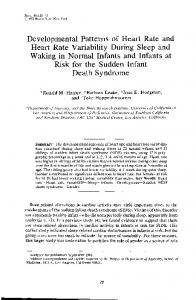
Marchant-Forde et al. [99] identified five (Type 1–5) distinct types of errors in IBI data recorded by the Polar R–R Recorder in pigs (see Fig. 3). Type 1 errors were characterised as single point discrepancies, either positive or negative, between the Polar data and IBIs derived from conventional ECG data. Type 2 errors were identified as a long IBI immediately followed by a short IBI. Type 3 errors, in contrast, exhibited a short IBI followed by a compensatory long IBI. Type 4 errors were characterised by a large peak representing more than one IBI, and in type 5 errors, the recorder generated two or more short IBIs in the place of a single IBI. As one can see in Fig. 3, none of these artefacts had ectopic origins, as they were not present in the IBIs derived from the conventional ECG. Type 2–5 errors were successfully corrected using an algorithm for recovering IBIs from the information available within the anomalous IBIs themselves [114]. In type 1 errors, the anomalous IBI could reliably be replaced with the mean of the nearest normal neighbouring IBIs. The importance of identifying and correcting artefacts and ectopic beats in IBI data has been demonstrated by several authors in both human and animal subjects. The computation of many HRV indices is based upon the amount and type of variability within the data and the presence of even a single error in short duration recordings can significantly bias the outcome of time and, particularly, frequency domain analysis [99,111,112,117]. Geometric and non-linear analytical methods seem more resistance to the presence of spurious beats and these are discussed in greater detail later in this review. 3.2. General recommendations for recording of IBIs When using HRV to measure changes in sympathovagal balance a general concern is the amount of IBI data necessary for informative analysis of the different indices that accurately represent autonomic function. For a number of rather simple parameters in the time domain (e.g. SDNNindex, HRVindex, see 3.3.), 24-h recording are certainly adequate for determining overall variability. These parameters are useful for detecting tendencies in HRV related to autonomic dysfunction [118], but
Fig. 3. Five different error types in IBI data series recorded by the Polar R–R Recorder in pigs as identified by comparison of the Polar tachogram with simultaneously recorded conventional ECG derived IBIs [modified from [99]].
E. von Borell et al. / Physiology & Behavior 92 (2007) 293–316
299
cannot be reliably used to quantify more specific changes in sympathetic or vagal activity. Similarly, frequency domain analysis has also been applied to human, pig and heifer 24-h ambulatory cardiac data. Although the information obtained has value, it can be impaired by the possible occurrence of high numbers of artefacts, ectopic beats and influences of physical activity as well as a lack of stationarity in the data making results difficult to interpret or reproduce [2,119]. Multiple studies have demonstrated that short-term measures of HRV rapidly return to baseline after transient perturbations induced by manipulations such as mild exercise, administration of short acting vasodilators, transient coronary occlusion, etc. For reasons of standardisation across different studies incorporating HRV, 5-min recordings have been suggested as a recommended recording length unless the nature of the study dictates another design [82]. When analysing longer IBI sequences, averaging the results obtained from 5-min overlapping periods can sometimes minimise some of the difficulties (e.g. non-stationary data) encountered with longer segments of data [1]. This is especially important in the case of spectral analysis of HRV by FFT which is strongly influenced by any non-stationarity inherent in biological data such as cardiac activity. Various studies have demonstrated that analysing 5-min segments of IBI data in the time-, frequency- and non-linear domains deliver results comparable to, or even better than, analysing 24 h of data [1,68,120,121]. As HRV in humans and animals, like many other physiological parameters, is influenced by a variety of factors like sex, age, diurnal rhythms, respiration, fitness levels, posture and physical activity it is very important to standardise and control the circumstances under which data are recorded [39,98,122–124]. When investigating chronic states, it is recommended that only data relating to time periods when the subjects are supine and calm and undisturbed are analysed to minimise the effects of changing physical activity or arousal on HRV parameters [35,36]. However, in studies where this is not achievable, any physical activity should be taken into account when analysing and interpreting HRV [40]. IBI data that contain more than 5% anomalies, or segments of IBI data containing 3 or more consecutive error IBIs, should not be included in HRV analysis. Finally, splicing different of segments of data together is also not recommended as it interrupts the underlying time series of the data upon which frequency domain analysis is based.
3.3.1. Time domain analysis Time domain measures are the simplest parameters used to analyse HRV. All these measures reflect various aspects of statistical variability in the IBI data series. They are broadly divided into two classes: (a) measures of variability derived from IBI data themselves; (b) measures of variability derived from differences between adjacent IBIs. Prominent indices within each class are described in Table 1. In the first subclass of time domain measures, mean IBI and HR are the easiest to calculate but are also the least informative. The standard deviation of all IBIs over a 24-h period or the standard deviation of IBIs of a single 5-min period (SDNN, ms) is good predictors of overall variability present at the time of recording. As the total variance of HRV increases with the length of analysed recording, in practice, it is inappropriate to compare SDNN measures obtained from IBI data series of varying durations. If the SDNN is reported for a 24-h recording it is sometimes referred to as cycle length variability (CLV). The SDANN is the standard deviation of the mean IBI of all 5-min segments in the data. It is also measured and reported in milliseconds and is highly correlated with SDNN. Finally, SDNNindex is the mean of the standard deviation of all 5-min segments of a 24-h recording. All these parameters reflect longterm variability of cardiac activity and are influenced by both sympathetic and parasympathetic activity. In the second subclass of time domain measurements, the most informative parameter is undoubtedly the RMSSD (root mean square of successive differences). This is determined by calculating the difference between consecutive IBIs before squaring and summing them, the values are then averaged and the square root obtained. The RMSSD is the primary time domain measure used to estimate the high frequency beat-to-beat variations that represent vagal regulatory activity. Other parameters used to assess beat-to-beat variations include the NN50,
SDNNindex
ms
3.3. Methods of HRV analysis
RMSSD
ms
Early on, HRV analysis primarily focused on time and frequency domain analysis [1,55,68,125]. However, cardiac activity is an integrated signal that is influenced not only by the two branches of the ANS, but also by a number of other underlying physiological mechanisms and various extrinsic factors. More recent research reports that cardiac signals also contain non-linear components in the dimension of deterministic or non-deterministic chaos [126,127]. Nowadays, investigation of non-linear components of HRV has been established as a further important area in HRV analysis [128–130].
NN50 count
Table 1 Time domain measures of HRV [adapted from [1]] Variable
Units Description
Statistical measures SDNN ms SDANN ms
pNN50
%
Geometric measures HRVindex
TINNindex
Poincaré (Lorenz) plot
ms
Standard deviation of all IBIs of the data set. Standard deviation of the mean of IBIs in all 5-min segments of the entire data set. Mean of the standard deviations of all IBIs for all 5min segments of the entire data set (24 h). The square root of the mean of the sum of the squares of differences between successive IBIs. Number of pairs of successive IBIs differing by more than 50 ms. NN50 count divided by the total number of all IBI's.
Total number of all IBIs divided by the height of the histogram of all IBIs measured on a discrete scale with bins of 7.8125 ms (1/128 s). Baseline width of the minimum square difference triangular interpolation of the highest peak of the histogram of all IBIs. XY-diagram of each IBI of the data set plotted as a function of the previous IBI.
300
E. von Borell et al. / Physiology & Behavior 92 (2007) 293–316
the number of neighbouring IBIs that differ by greater than 50 ms, and the pNN50, the proportion of beats differing by 50 ms (NN50/ total number of IBIs). As these parameters are highly correlated with RMSSD, they too are also good estimators of vagal activity. 3.3.2. Geometric analyses Geometric measures metamorphose sequences of IBIs into geometrical forms and the assessment of HRV is extracted from these forms. Some geometric measures are based on the density distribution (histogram) of IBIs where IBIs are converted into a discrete scale. Most previously published studies have used a scale with bins of approximately 8 ms long (1/128 s). By deriving information from this density distribution, the effects of anomalous data points are reduced since they are usually substantially shorter or longer than normal IBIs and fall way outside the normal range of the distribution of the normal data. The most prominent geometrical measures of this type are the HRVindex and the TINNindex (Table 1). These measures have been preferentially used in commercial systems for analysing 24-h ECG data [1]. The Poincaré plot, also referred to as the Lorenz or scatterplot, is a map of dots in an XY-diagram (Fig. 4). Each dot represents the duration of an IBI plotted against the duration of its preceding IBI. Poincaré plots can be analysed qualitatively by visual inspection whereby the shape of the plot is classified into functional classes that can then be used to interpret the nature of the cardiac signal from which the plot was derived [131–133]. Woo [134] constructed Poincaré plots from 24-h Holter recordings in healthy subjects and patients with heart failure and found that healthy subjects exhibited comet shaped plots whereas in the heart failure group, three distinctive patterns were identified: (a) a torpedo shaped pattern; (b) a fan-shaped pattern and; (c) a complex, almost erratic, pattern. Visual inspection of Poincaré plots reveals a complexity in cardiac patterns that are not otherwise detected in other HRV measures. Quantitative analyses of a Poincaré plot entails fitting an ellipse to the plot, with the centre of the ellipse coinciding with the centre point of the scatter-plot itself (Fig. 4). In order to do this, the plot is first turned 45° clockwise, and the standard deviation (SD) of the
Fig. 4. Quantitative analysis of Poincaré plot. SD1 is the SD of instantaneous IBI variability measured from axis 1. SD2 is the SD of long-term continuous IBI variability measured from axis 2 [modified from [137]].
scatter-plot is computed around the horizontal axis, which passes through the data (SD1). This SD1 represents the instantaneous, short-term, HRV. The plot is then rotated 45° counter-clockwise, and again the SD of the plot is computed around the horizontal axis to obtain the SD of long-term variability (SD2). The absolute values of SD1 and SD2 can then be normalised (SD1n and SD2n, respectively), by dividing them by the average IBI value and then multiplying this by 1000 [71,135–138]. Quantitative Poincaré measures have been found to provide useful information on the vagal regulation of cardiac dynamics that is not easily detected by other domains of HRV analysis [139]. 3.3.3. Spectral analysis of HRV by FFT — basic requirements and limits Fast Fourier transformation (FFT) is a widespread approach used to decipher and analyse dynamical changes in signals in general. The fundamental principle of this method is based on the fact that every signal can be described by a set of harmonic waves which, when added to one another, make up the complete waveform. FFT can be used to ‘decompose’ a waveform into its sine and cosine constituents. There are some prerequisite factors which should be taken into account before using FFT, namely: (a) the time difference between the values of the time series has to be equidistant. In the case of cardiac signals, this means that before analysing IBI data, the tachogram has to be converted into an equidistant time series by interpolating (preferably using cubic spline functions) and resampling the data. In other words, an instantaneous IBI data series (e.g. for every second of the measuring time) has to be constructed; (b) the FFT-function works on data sets of 2n numbers. If the data set is not 2n in length, some programs pad “0” at the beginning and end of the data range to reach the length 2n. This leads to substantial alterations of the power spectrum (see Fig. 5) so it is strongly recommended to extend, or shorten, the data sets by interpolation to get a data set size of 2n; (c) the level of accuracy achieved in describing the fluctuations of time series depends heavily on the number of points used in the FFT (see Fig. 6). According to published recommendations, a minimum of 512 points should be used for FFT analyses of IBI data [1] (e.g. let us suppose a mean HR of 80 bpm results in an IBI series of 400 values in 5-min. This time series has to be lengthened to 512 values by interpolation prior to analysis.). The number of points used for FFT influences the highest frequency power (Nyquist frequency) as well as the amount of power observed in the different frequency bands (Fig. 5). Because FFT applies “folding” of the original time series for calculating the power of the various harmonics, the highest oscillation corresponds to half of the number of points used for FFT, e.g. the highest frequency in a data set which contains 512 points (representing a time series of 300 s) is the 256-harmonic with a wavelength of 1.17 s (=300 s/256) that has a frequency of 0.85 Hz. The spectrum calculated in this way is made up of 256 discrete spectral-lines. The absolute power of the different bands is limited by the number of spectral-lines within the given ranges for the different bands. Using 1024 points (instead of 512) when analysing the same 300 s time series, would result in 512 spectral-lines which means a higher number of spectrallines and absolute power in the different bands (Fig. 6).
E. von Borell et al. / Physiology & Behavior 92 (2007) 293–316
301
Fig. 5. Differences in FFT-spectra depending on the method of correction of data length.
In spite of all these considerations, one of the great benefits of FFT is the ability to assign the power in different bands to different underlying physiological functions. It is widely accepted that the power in the high frequency (HF) band (0.15–0.4 Hz in humans) represents vagal activity [46,140– 142]. The low frequency (LF) band (0.04–0.15 Hz) and the very low frequency (VLF) band (≤0.04 Hz) are associated with sympathetic [55] or sympathetic plus vagal activity, and their physiological meaning has been much debated [143–145]. Therefore, when calculating the LF/HF ratio as a measure of sympathovagal balance, one has to appreciate that this measure may also be influenced by other physiological functions like thermoregulation or myogenic activity of vessels. The location of vagal power in the HF band of the spectrum is influenced by the respiratory rate of the species [146]. It is, therefore, important to consider respiration rate when locating the HF power for assessment of HRV. To account for inter-individual differences, LF and HF power may also be expressed in normalised units where the absolute value of each power component is expressed as a proportion of either total power (e.g. LF/total power) or total power minus the VLF component (e.g. LF / (total power − VLF power)) [147,148]. 3.3.4. Recommendations for the FFT analysis of HRV To increase the inter-study comparability of FFT analysis of HRV, the following recommendations should be taken into consideration: ➢ Use data sets of approximately 5-min in length. ➢ Use at least 512 points from the resampled equidistant time series derived from the original IBI data to calculate the power spectrum.
➢ Use species appropriate frequency bands widths such as the HF ranges following: Horse Foal Cattle Calf Swine (100 kg) Piglet Goat/ sheep Lamb Rabbit Chicken Duck
0.13 to 0.26 Hz 0.25 to 0.33 Hz 0.20 to 0.58 Hz 0.50 to 0.83 Hz 0.13 to 0.41 Hz
(Corresponds to a respiratory rate of 8–16/min) (Corresponds to a respiratory rate of 15–20/min) (Corresponds to a respiratory rate of 12–35/min) (Corresponds to a respiratory rate of 30–50/min) (Corresponds to a respiratory rate of 8–25/min)
0.33 to 0.83 Hz (Corresponds to a respiratory rate of 20–50/min) 0.20 to 0.40 Hz (Corresponds to a respiratory rate of 12–24/min) 0.33 to 0.58 Hz 0.67 to 1.00 Hz 0.33 to 0.67 Hz 0.83 to 1.17 Hz
(Corresponds to a respiratory rate of 20–35/min) (Corresponds to a respiratory rate of 40–60/min) (Corresponds to a respiratory rate of 20–40/min) (Corresponds to a respiratory rate of 50–70/min)
Data should be expressed in normalised units as a percentage or proportion of total power (LF / total power × 100 or HF / total power × 100). 3.3.5. Non-linear analysis of HRV by recurrence quantification analysis Parameters derived from various non-linear time series analyses have been found to be sensitive indicators of changes in sympathovagal balance under both healthy and pathological conditions [149–152]. HRV can be influenced by a number of different feedback or feed-forward mechanisms and coupling of two or more oscillators can produce non-linear chaotic behaviour as non-linearity is a hallmark of complex dynamic systems [153,154]. Such non-linear oscillations have been shown to be an integral part of HRV and a number of authors advocate that these processes are related to deterministic or nondeterministic chaos [155–159]. Nevertheless, other studies have failed to find evidence of low-dimensional chaos in IBI data
302
E. von Borell et al. / Physiology & Behavior 92 (2007) 293–316
Fig. 6. Information content of spectra depends on the number of spectral-lines.
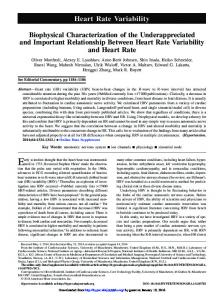
[160–162]. These contradictory findings could be partly explained by the fact that IBI data contain a periodic component originating from the basal frequency of the sinus node [163]. Furthermore, some non-linear time series analyses require that data meet some a priori restrictive mathematical assumptions. One method to test whether time series IBI data really contain non-linear dynamics or just linear relationships in the time and frequency domain is surrogate data analysis [164]. Recurrence quantification analysis (RQA) may be applied to IBI data to detect hidden rhythms and non-linear deterministic structures of HRV in higher dimensional space [165,166]. This mathematical approach has already been applied successfully for estimation of non-linear processes in various physiological time series data [154,163,167,168]. Since RQA is independent of limiting constraints such as data set size, stationarity, and assumptions regarding the statistical distributions of data, it seems ideally suited for investigating physiological systems characterised by non-homeostatic transients and state changes, such as cardiac activity. Validation of RQA of true non-linear components in HRV time series has been performed using surrogate data analysis [8,169]. Recurrence plots were introduced by Eckmann et al. [170] as a purely graphical tool to uncover non-linear properties in time series. Since then, six parameters have been introduced that may be used to quantitatively assess recurrence plots1 [165,166]. To perform RQA, the time series is first embedded in a suitable n-dimensional Euclidean space (e.g. n = 10, leaving room for up to ten operators to act on HRV) at unitary time lags. The outcome is a specific embedding matrix with a single N-dimensional vector for each point of the time series. From the embedding matrix, a distance matrix is computed to determine the Euclidean distances between all pairs of vectors (Fig. 7). The distance between each pair of vectors is defined as a recurrence point whenever it is below a predefined cut off value. All recurrence points are plotted as black points at corresponding X,Y coordinates in the recurrence plot (Fig. 8). In other words, the recurrence plot visualises the distance matrix of all vectors of the N-dimensional embedded HRV-tachogram. According to Giuliani et al. [163] the recurrence plot represents the autocorrelation of a given signal at all possible time scales. 1
http://homepages.luc.edu/~cwebber/.
Whereas the plot itself already gives an impressive picture of the regularity/irregularity of the tachogram, the parameters defined by Trulla, Webber and Zbilut [166,169,171] enable quantitative estimation of the recurrence structure of embedded time series. Using RQA, a number of quantitative parameters can be derived from the recurrence plots that are useful in assessing HRV (Table 2). The percentage of recurrence (%REC) quantifies the percentage of the plot occupied by recurrence points. It corresponds to the proportion of pair-wise vector distances below a predetermined radius or, equivalently, to repetition of single vectors in the multidimensional space. The percentage of determinism (DET) is the percentage of recurrence points forming upward diagonal lines in the plot i.e. recurrence points in consecutive sequences, where a line is defined as a sequence that is longer than a preset threshold length. Both %REC and %DET are parameters of the regularity of HRV in multidimensional space that cannot be proven in the original time series. However, single point recurrence can be observed by chance whenever the system explores two nearby points of its state space. On the other hand, recurrence points that appear in a row, forming diagonal lines, are an important signature of deterministic structuring. The entropy (ENT) is computed as the Shannon entropy of the deterministic line segment length distributed in a histogram. It corresponds to the richness of deterministic structuring of the series. The maxline (LMAX) is the length of the longest line of recurrence points in a continuous row within the plot. It is inversely related to the largest positive Lyapunov exponent. The
Fig. 7. a) Computing an embedding matrix from original time series in a 3-dimensional Euclidian space with time lag = 2. b) calculating the vector distance matrix.
E. von Borell et al. / Physiology & Behavior 92 (2007) 293–316
Lyapunov exponent is a quantitative measure of the sensitive dependence of a time series on the initial conditions. A positive largest Lyapunov exponent indicates chaos [170]. A small LMAX corresponds to a high Lyapunov exponent, meaning a large amount of “chaos” and vice versa. Finally, trend describes how stationary the system is during the period of measurement. Systems showing a drift may have positive or negative trend values, whereas systems without drift have values close to zero. For a more detailed description of the mathematical background of RQA, several detailed methodological papers have been published previously [163,165,166,171]. However, as these authors emphasise, implementation of RQA is far simpler than its actual interpretation. Beside the calculation of non-linear indexes of the time series, of particular importance is the physiological meaning of these parameters. Studies in rats have shown that administration of atropine significantly increases %REC, %DET and LMAX [167]. However, administration of atenolol (β1-adrenergic antagonist, sympathetic inhibitor) only increases %REC, whereas prazosin (α1-adrenergic antagonist) does not affect non-linear indexes of HRV data. In contrast, α1-sympathetic blockade increases the non-linear parameters of systolic BP [167,172]. In human diabetic subjects with autonomic dysfunction, no relationship has been found between linear frequency domain HRV parameters and the results from the Ewing test (a standard test to diagnose diabetic autonomic dysfunction), whereas the non-linear index LMAX was strongly correlated to the Ewing score [8]. These studies concluded that the non-linear indexes of HRV were more reliable markers of sympathetic and parasympathetic activation compared to parameters generated from time- and frequency domain analysis. Research in ruminants indicates that the combination of linear and non-linear parameters of HRV can be used as a sensitive indicator of stress [28,35]. Results in calves, cattle and dwarf goats indicated a loss of complexity in HRV and a more
303
Table 2 Quantitative parameters derived from the recurrence plot by applying the RQA Percentage of recurrence (%REC) Percentage of determinism (%DET) Entropy (ENT) Maxline (LMAX) Trend
Percentage of recurrence points in the plot; single vector repetition in n-dimensional space. Percentage of recurrence points forming upward diagonal lines i.e. recurrence points in consecutive sequences. Shannon information entropy of the line length distribution The longest diagonal line segment of consecutive recurrence points in the plot. Drifting of the recurrence points away from the central diagonal line of identity.
deterministic control in response to extrinsic, physiological, or pathological loads (Fig. 8) [28,35,36]. Further positive correlations have also been demonstrated among measures of shortterm variability in the time and frequency domains (RMSSD and HF) and many non-linear parameters [35,167,172]. 4. HRV in applied animal research: methodology and interpretation of HRV in pigs, cattle, horses, sheep, goats and poultry 4.1. Heart rate variability in pigs A review of the literature on HRV in pigs identifies two main themes of research activity: 1) use in biomedical models of human disease, and; 2) use as an indicator of stress in applied studies allied to animal well-being. Each set of literature is relatively small in number but demonstrates an increasing interest in the area of HRV within the last 10 years. 4.1.1. Issues researched In terms of biomedical research, much focus has been on Yucatan [173,174] or Göttingen [31,175] miniature pigs, with
Fig. 8. Recurrence plot of a tachogram (2500 IBI's) of a) a 7 days old healthy calf and b) the same calf four days later when suffering from diarrhoea. Changes in the various RQA-parameters are given.
304
E. von Borell et al. / Physiology & Behavior 92 (2007) 293–316
fewer studies using commercial type pigs [176,177]. There has been some basic research carried out into data acquisition system design for minipigs [178] and studies into circadian patterns of HRV [175] and the effects of pair housing on HRV parameters [31]. Miniature pigs have also been used as subjects for research into cardiovascular autonomic neuropathy [173] and the effects of testosterone modulation on HRV [174]. HRV of commercial piglets has been studied to elucidate asymmetric innervation of the myocardium [176] and as a model for Sudden Infant Death syndrome [177]. In terms of studies allied to animal well-being, again there has been some more basic research into methodology of analysis and data acquisition system design [99], the effects of gestation on HRV parameters [97] and circadian rhythmicity in HRV [179]. Applied studies have looked at the effects of social stress [27,32,67], restraint stress [32] and the effects of grooming [67] on response patterns. 4.1.2. Methodology The major aspects of methodology relate to the physical data acquisition equipment used and issues surrounding the editing and analysis of data as discussed previously. In pigs, here is the choice of either implantable transmitters or externally-mounted non-invasive transmitters. A key advantage of the implantable system is that it facilitates group housing of pigs as the equipment is internalized and thereby protected from damage by conspecifics. Furthermore, with appropriate electrode placement or use of an intracardiac bipolar lead there is a substantial reduction in the signal to noise ratio that can be an inhibitory factor with non-invasive monitors.
With externally-mounted equipment, the most commonly used have been ambulatory monitors modified for use in pigs [e.g. 31,99,174,175] or Polar HR monitors, including the SportTester [32], the Vantage NV [67,99] and the R–R Recorder [99]. Other equipment used includes a telemetric ECG system [99] and static ECG systems [176,177]. The external nature of non-implantable equipment means that it can become the focus of investigatory attention from pen-mates, resulting in signal disruption from physical movement of the electrode belt either directly by the rooting or chewing activity of the investigating pig, or indirectly by the physical exertion of the monitored pig trying to avoid unwanted attention. A summary of the most frequently reported analysis and indices is reported in Table 3. Preliminary analysis typically begins with the identification and correction of spurious beats that are a common occurrence in recording from unrestrained pigs. For the most part, data has been analysed and express in the time (e.g. mean HR, mean IBI, Q–T interval, SDNN, Variance (σ2), pNN50, RMSSD) and frequency domain (total power, LF, HF, LF:HF ratio, SNSI (LF/HF) or PNSI (HF/Total)) [e.g. [27,67,99]] as well as geometrically (e.g. Lorenz or Poincaré plots [e.g. [176]]) to determine overall variability and the amount of variability and power relating to sympathetic and vagal activities. Fast Fourier transforms are the common most method applied to analyse data in the frequency domain [31,173,175]. Frequency bands are expressed in either cycles per beat or hertz (Hz) with the VLF frequency typically reported as 0 to 0.01 Hz, the LF frequency from 0.01 to 0.07 Hz and the HF frequency extending from 0.01 to 1 Hz. Individual frequency bands are sometimes normalised by expressing the
Table 3 Summary of selected HRV research in pigs Publication
Study objective
Equipment used indices reported
Time domain
Frequency domain indices reported
Mesangeau et al. [173]
Diabetes research
Mean HR, SDRR
Total power
Olmstead et al. [174]
Effects of testosterone on HRV Circadian rhythms Pair housing
Data Science TL11M2-D70-DCT Holter
Mean HR, SDRR, SDANN, RMSSD Mean RR, SDRR, CVRR
LF, 0.01–0.07 Hz HF, 0.07–1.0 Hz LF, 0.01–0.07 Hz HF, 0.07–1.0 Hz Total Power Normalised LF & HF LF, 0.02–0.15 Hz HF, 0.15–2.0 Hz VLF, 0.003–0.01 Hz LF, 0.01–0.07 Hz HF, 0.01–0.5 Hz Total Power SNSI and PNSI LF, 0.01–0.07 Hz HF, 0.01–0.5 Hz Total Power SNSI and PNSI
Kuwahara et al. [31,175]
Voss et al. [177]
Holter
Hook Electrodes and Grass Recorder Polar RR, Telemetric ECG
SDRR, SDΔRR
Marchant-Forde et al. [99]
Effects of endotoxins on HRV Validation of equipment and identification and correction of artefacts
Marchant-Forde and Marchant-Forde [97]
Effects of gestation on HRV
Polar NV
Mean HR, RR Max, RR Min, SD, σ2, RMSSD
de Jong et al. [27]
Social stress
Geverink et al. [32]
Restraint stress
Data Science TA10CTA-D70 Polar Sport Tester Electrodes and FM Transmitters
Mean RR, SDNN, SDRR, RMSSD Mean HR, SD, SD1, SD2, SD2/SD1 ratio
Mean HR, RR Max, RR Min, SD, σ2, RMSSD
E. von Borell et al. / Physiology & Behavior 92 (2007) 293–316
individual bands as a function of the total power. Moreover, the LF to HF ratio, also referred to as the SNS indicator (SNSI) is determined to reflect activity due to sympathetic activity whereas the PNS indicator (PNSI, HF/total power) is used to enumerate vagal activity (see Table 3). 4.1.3. Specific conclusions and recommendations Considerably work is still necessary to elucidate the regulatory mechanisms contributing to HRV in pigs. For the most part, in applied studies assumptions have been made about the location and contributing factors (e.g. respiratory sinus arrhythmia, thermoregulation, etc.) of individual frequency bands based on the human literature. Simple modelling work using ANS activity inhibitors such as atropine and propranolol is currently in progress and will result in further recommendations to standardise methodology and analyse data for future applied and fundamental research. More longitudinal studies looking at the effects of age and disease on HRV are also of interest together with the effects of genetics, environment, and subjective states such as fear, anxiety, pain, and general welfare status. The existing data, however, are sufficient to indicate that HRV is indeed a promising indicator of stress and welfare status in pigs. 4.2. Heart rate variability in cattle 4.2.1. Issues researched A review of the current literature identifies only a small number of studies addressing HRV in cattle. This is in contrast to a relatively huge body of research reporting on the measurement of HR alone. Issues include impacts of pathological loads and environmental stressors on HRV [24,28,35,180]. 4.2.2. Methodology Different types of Holter recorders or fixed systems [24, 25,107,142] as well as portable HR monitors (mostly from Polar Electro Öy, Finland) have been used to investigate HRV in cattle [28,35,180,181]. In some cases, electrode sites were shaved prior to attaching electrodes [28] and in others not [35]. In either case, it is strongly recommended that ample electrode gel is applied to optimise electrode-skin contact. With HR monitors, electrodes and transmitters were usually secured in place by attaching them to a horse girth or similar [28,35,180]. A sufficiently long acclimatisation period (min 1 h) is recommended to allow the animals enough time to become accustomed to wearing the equipment even though visible reactions after fixing the belt generally only occur for about 5 to 10 min after fitting [28]. The general advantages, disadvantages or problems concerning accuracy of measurements and correction of artefacts and ectopic beats discussed earlier in this review are also applicable to HRV analysis in cattle. As in other species, the relationship between HRV and underlying sympathovagal balance in cattle was confirmed using pharmacological blockade of the autonomic nervous system [142,182,183]. Various parameters describing HRV in cattle have been used to detect irregularities in the operational sequences of sympathovagal balance. Several authors have used HRV to detect
305
alterations in the brainstem caused by bovine spongiform encephalopathy (BSE). In addition to bradycardia, these studies report an increase in vagal tone, marked by a drastic increase in HF spectral power [25]. LF power, on the other hand, shifted between phases of high power to phases of lower power. This effect of switching between low and high spectral frequencies seemed to be quite characteristic for BSE and was not comparable to changes in HRV described after brainstem stroke [24]. Furthermore, elevated HF power was present 9 months before the animals developed any clinical signs of BSE itself [24]. Bradycardia and increased HF power, due to an increase in vagal tone has also described in fasting steers. The connection between these two effects (bradycardia and emptying of the rumen) was explained by a reduction of ruminal tensor receptor input into the medullary gastric centre that influences the nearby cardiovascular centre [183]. These observations highlight the fact that because of the multivalent input into cardiac activity, irregularities and changes in activity levels can be caused by a multitude of intrinsic and extrinsic factors. As in other species, cattle exhibit anticipatory changes in HR and cardiac activity when they are about to acquire a cognitive task [181]. Other research has demonstrated that in calves, short-term variability (RMSSD), as well as longterm variability (SDNN), of HRV decreases significantly with increasing levels of stress load (from high ambient temperature combined with insect harassment to clinical signs of diarrhoea) [28]. Results in the frequency domain exhibit similar patterns to the time domain parameters [28]. No significant difference in either time or frequency domain parameters of HRV have been found to exist between lactating and non-lactating cows [28]. All cows showed similar values for all parameters within the two groups, so it seems that lactation and late pregnancy are comparable loads for the animals. In calves, various non-linear parameters of HRV have been documented to rise significantly in response to extrinsic stress (thermal stress), and even more to a pathological load (clinical diarrhoea), with most profound changes noticeable in the LMAX parameter [28]. In lactating cattle, %DET was the only non-linear parameter that increased significantly from non-lactating to lactating cows [28]. The results in both calf and cattle studies indicate a loss of complexity in cardiac activity and a more deterministic control of HRV in response to extrinsic, physiological or pathological stress. It appears, therefore, that when an organism's biological systems need to focus on specific challenges, it results in a loss in the general freedom and complexity of cardiovascular dynamics. Furthermore, both calves and cattle do show differences in their non-linear cardiac dynamics depending on type of stress load experienced. Moderate physiological stress in lactating cows compared to non-lactating animals and moderate extrinsic stress in calves, cause an increase in %DET that is indicative of an elevation of recurrence sequences in the time series. This is interpreted as a more quantitative growth of deterministic processes in HRV. In contrast, however, %DET does not appear to be affected by pathological stress in calves. Nevertheless, higher values of LMAX, indicate that under such circumstances, HRV persists under stringent control for much longer periods of time [167,184]. It has been suggested that %DET indicates quantitative changes in the level of stress load, while higher
306
E. von Borell et al. / Physiology & Behavior 92 (2007) 293–316
values of LMAX, are signs of a qualitative difference in stress levels. These results were recently confirmed by other authors who evaluated the influences of a conventional milking system versus an automatic one on non-linear dynamics of HRV [35]. In addition to differences in breed, body weight and time of day, this study also reports an increase in %DET, LMAX, and LF/HF ratio and a reduction in RMSSD and HFnorm in animals which were confronted with an automatic milking system, suggestive of higher levels of stress. 4.2.3. Specific conclusions and recommendations HRV in cattle can be used to measure stress from physical, pathological and emotional origins. In addition to the general methodological recommendations given in the review the following points should be considered when measuring HRV in cattle to evaluate stress and welfare: a) Electrodes should be positioned on the left side of the chest with one electrode placed close to the sternum and the other over the right scapula; b) Shaving the skin is useful but not necessary, and; c) ample electrode gel should be used (Table 4). 4.3. Heart rate variability in horses 4.3.1. Issues researched A search of the literature reveals 19 studies published in peer reviewed scientific journals where HRV has been evaluated in horses with different techniques and objectives. The following section discusses methodological aspects of measuring HRV in horses under a range of different conditions. The descriptions of the different general recording techniques described earlier in this review also encompass the different approaches to record IBIs in horses. This section, therefore, focuses on the major
constraints of the different techniques, reports basal HRV values found in horses, and also reports on the effects of different clinical, behavioural and physiological conditions on sympathovagal regulation of cardiac activity. 4.3.2. Methodology The majority of equine HRV studies have used Holter type recordings [37,39,58,92,100,185–194]. A smaller number have used the Polar Vantage [40,195] or the Polar R–R [30,33,196]. Practical difficulties are often encountered when trying to document reliable measures of HRV in field like conditions. Published techniques have some limitations associated with them that should be considered when designing any study. Holter systems provide precise and long-term recordings but they are expensive and could be damaged when horses interact with one another. Heart rate monitors are more affordable systems that have the benefit of not requiring invasive surgery. However, they also have inherent limitations associated with them, namely they automatically detect the R-peak of the ECG but not the ECG itself. In horses, the t-wave can be very pronounced and systems only detecting R-peaks, by looking for sharp increase in voltage, can often register false values. These artefacts are usually easily identified as two false IBI values will be separated by only a few milliseconds as the system triggers first on the t-wave then very soon afterwards on the R-wave. In some cases, the problem can be avoided by changing the site of the electrodes to reduce the perceptible size of t-waves. In some recording systems, the presence of artefacts caused by movements of electrodes on the skin or by muscle contractions can be detected and corrected automatically by software algorithms. Using such automatic correction tools has to be considered with due care and attention. Ectopic beats are not unusual in horses due to the high parasympathetic tone [197].
Table 4 Summary of selected HRV research in ruminants Publication Cattle Mohr et al. [28]
Hagen et al. [35]
Study objective
Equipment used
Time domain indices reported
Frequency domain indices reported
Non-linear RQA-indices reported
Assessment of external and internal stress in calves and cattle
Polar Vantage NV ParPort/M-System (Par-Electronic GmbH, Berlin
IBI, 593 (± 131.9) ms, SDNN, 27 (±8.3) ms RMSSD, 15 (±8.8) ms SDANN, HRVindex,
LF, 35.3(±12.1) n.u. a, HF, 9.9 (±6.2) n.u. a, LF/HF
Evaluation of animal husbandry routines
Polar S810i
IBI, 819 (± 114.6) ms SDNN, 36 (±10.8) ms RMSSD, 16 (±8.2) ms SDANN
LF, 25.9 (±5.7) n.u. a, HF, 11.9 (± 8.6) n.u. a, LF/HF
%REC 3.3 (± 2.2) %DET, 84.0 (±6.9) ENT, 3.5 (±0.4) LMAX, 50.0 (± 24.3) TREND %REC, 3.4 (± 2.4) %DET, 76.1 (±11.5) ENT, 3.0 (±0.62) LMAX. 49.7 (±40.0)
Life Scope 6 model OEC-6301K, Nihon Kodhen, Japan Computerised data acquisition system (MacLab, AD Instruments, UK) Polar S810
HR, RMSSD
Sheep and dwarf goats Désiré et al. [42] Assessment of emotions in lambs Desprès et al. [182]
Pharmacological validation. Data for control lambs
Langbein et al. [36]
Effects of cognitive challenge on HRV
a
Normalized units.
IBI, 511(±33) ms SDNN, 23(±7) ms RMSSD, 18(± 77) HR, SDNN, RMSSD, RMSSD/SDNN
Total power, 288 (± 139) ms2 HF, 91 (±58) ms2 LF, 162 (±87) ms2 %DET
E. von Borell et al. / Physiology & Behavior 92 (2007) 293–316
In this case, normal successive IBIs may have large differences that are hard to distinguish from artefacts without reference to the original ECG. It is difficult to perform an appropriate automatic identification and correction of errors that can considerably affect the interpretation of HRV. Previously published research has documented good stability in inter-individual levels of HRV across age [40] and high degrees of repeatability when recordings are analysed over subsequent days [30,187]. Horses also exhibit an increase in HF spectral power at night, indicating that time of the day is an important factor that should be controlled for in equine HRV studies [38,187]. Some studies also report gender-related differences in ANS regulation of cardiac activity, with females appearing to have higher vagal tone which is consistent with the gender differences reported in humans [185,198]. In contrast, an unrelated study using twenty horses failed to observe any gender based differences [30]. Basal values of HRV in horses appear to contain large interindividual variations (Table 5). The exact origin of this variation is unknown but is likely due to a multitude of factors including genotype, behaviour, temperament, and nutritional status. Clinical conditions, temperament and training have been the most commonly investigated factors affecting HRV in horses. A significant shift in HRV has been demonstrated in several diseases such as grass sickness [193], laminitis [196], and atrial fibrillation [191]. The effect of pain, in horses suffering from laminitis has also been investigated [196]. In this particular work, treatment with non-steroidal anti-inflammatory drugs results in changes in LF and HF power, alongside simultaneous changes in adrenalin and weight shifting behaviours, leading the authors to conclude that HRV may be used to reliably assess pain in horses. Several horse studies have shown an effect of physical effort and training on cardiac function and sympathovagal balance [37–40,92,188]. In general, resting HR in horses is significantly decreased by training but one study has failed to find any training related changes in the vagal tone when HRV was recorded at rest [38]. Other work found that under challenging conditions (behaviour tests), untrained horses showed more pronounced, though not significant, elevations in HR and associated decreases in HRV parameters [40]. Exercise on an aqua-treadmill is associated with significantly higher sympathetic tone and decreased vagal tone [92], although immersion in warm water, without any physical effort, results in an enhancement in vagal activity that is purportedly linked to the induction of a mental and physical state of relaxation [188].
307
Several studies document negative correlations between the intensity of exercise and the overall HRV reportedly due to a progressive rise in sympathetic tone [37,39,92]. HRValso appears to be a promising indicator of temperament and coping strategies in horses. Several studies demonstrate a relationship between behavioural reactivity and HRV in horses undergoing behavioural testing [33,40,187,195]. Exposure to a novel object, as well as handling, induce a physiological state characterised by an increase in mean HR and a decrease in SDNN and RMSSD representing a decrease in PNS influence during testing [40]. Clement and Barrey [185] and Thayer et al. [37] described reduced HRV for more reactive horses, young subjects and hot-blooded breeds. Eager et al. [187] found positive correlations between the scores of six horses to a water spray test, handler scorings on a visual analogue scale and HRV with more fearful horses showing increased LF and total power. Work by Visser et al. [40] reports a relationship between HRV parameters and riders' rating scores with respect to ten temperamental traits. Additionally, HRV analysis has also been used to assess stress and susceptibility to stress in horses. In horses, baseline resting levels of LF, HF and their ratio has been found to differ between habitual crib-biting and normal control horses [33]. Other research reports on a relationship between indices of HRV (increased mean HR, LF and HF/LF and decreased HF) and stress related behaviour exhibited as a result of enforced backward movement in horses [30]. 4.3.3. Specific conclusions and recommendations HRV analysis in horses appears to be a sensitive measure of both physical and emotional stress responses. Besides the general methodological recommendations given earlier in this review, the following points are recommended when measuring and analysing HRV in horses: a) it is preferable to use a system that stores ECG due to the characteristics of equine t-waves; b) pay particular attention to the occurrence of ectopic beats and edit data accordingly, and; c) while it is not always necessary to shave electrode site, gel should be used liberally to enhance signal transmission (Table 5). 4.4. HRV in sheep and goat 4.4.1. Issues researched Several laboratories have undertaken extensive cardiac and HRV studies in sheep because the sheep heart is similar to that
Table 5 Summary of selected HRV research in horses Publication
Study objective
Equipment used
Time domain indices reported
Frequency domain indices reported
Rietmann et al. [30]
Assessment of mental stress
Polar RR Recorder
IBI, 1818 (±152) ms SDNN, 111 (± 50.55) ms
Norman et al. [100]
Validation of equipment
Telemetric ECG recorder, computerised data acquisition system (Po-Ne-Mah) and MiniDisc player
IBI, 1532(±130) ms SDNN, 313(±169) ms RMSSD, 300(±297) PNN50, 37 (± 14)
LF, 53.3 (± 19.5) n.u. a HF, 46.8 (±19.5) n.u. a LF/HF, 1.70 (±1.69) n.u. a Total power, 149.5 (± 167.8) ms2 HF, 114.1 (±153.9) ms2 LF, 35.4 (± 18.1) ms2
a
Normalized units.
308
E. von Borell et al. / Physiology & Behavior 92 (2007) 293–316
of the human in many ways, including dimensions of the chambers, coronary anatomy, and magnitude of haemodynamic variables such as BP, HR, and cardiac output [199]. Moreover, autonomic innervations of the heart in sheep are also similar to that of the human [200]. These similarities explain why a large number of studies on foetal cardiovascular regulation have been performed in the ovine foetus. Several studies [reviewed in [201]] support the existence of autonomic control of circulatory function early in the development of the foetus. In the immature foetus, basal sympathetic tone is important in the maintenance of foetal arterial pressure [202,203] and is reflected by the LF variability in the HRV power spectrum [204,205]. Monitoring the variability in the LF range has been used in estimating the level of foetal sympathetic activation during high-risk pregnancies, foetal distress after haemorrhage [206] and hypoxia [207]. The PNS is reported to have little influence on basal foetal cardiovascular function in the immature foetus, with its influence on resting HR increases progressively during postnatal maturation [202,208]. Although neurohumoral control is important in the neonatal period, sympathetic system appears to be the major regulator of vascular function up to 8 weeks of life [202,209]. By 3 months of age, vagal regulation dominates and the best indices of vagal activity are RMSSD and HF power (Table 4) [182]. 4.4.2. Methodology Equipment designed for monitoring cardiac activity in humans is usually suitable for use in sheep and goats. Data loggers are useful for short-term measurements but generally do not allow for specific event marking. Radio-telemetric equipment (e.g. Life Scope System, Nihon Kohden, Japan), that transmits to data acquisition system are more useful for longterm studies and multiple events marking. Some of them permit the acquisition of behaviour recording and are equipped with HRV analysis software packages (e.g. QuickTime Capture Module for Chart software, PowerLab System, ADInstruments, UK). When measuring HRV in free ranging animals, the belt with the electrodes needs to be protected to limit movement of the electrodes and loss of signal. The electrodes should be positioned on shaved skin on the left side of the chest corresponding to the cardiac electrical axis. To achieve this one electrode is generally placed close to the sternum and the other over the right scapula. ECG signals should ideally be recorded at a sampling rate of 1000 Hz. Time- and frequency domain analysis should be conducted following the procedures recommended earlier in this review. Frequency domain analysis is required to determine the contributions of both branches of the ANS. Stationary data should be used and this is easiest to obtain in sheep and goats when they are lying undisturbed. Since experimental conditions, such as extrinsic temperature or animal metabolism, may vary greatly, the respiratory frequency of the subjects should be simultaneously recorded to allow for accurate determination of the upper limit of the spectrum defined by Nyquist frequency. In warm environment, HR in sheep can reach 200 bpm and their respiratory
frequency 72 bpm (1.2 Hz). In this instance, if the resampling frequency of the IBI data is 3 Hz, the Nyquist frequency is 1.5 Hz and the following frequency domain ranges are advised: total power in the range 0–1.5 Hz, LF in the range 0.04–0.15 Hz, and HF in the range 0.15–1.5 Hz, including the respiratory peak at 1.2 Hz. The LF waveband includes baroreflex oscillation (0.1 Hz) as shown by pharmacological blockades studies in sheep [209]. Studies involving HRV and behaviour in sheep and goats are sparse. Désiré et al. [42] investigated the ability of lambs to react to suddenness and novelty of an event according to appraisal theories. They found that lambs responded to a sudden event with startle responses coupled with transient increases in HR that did not appear to be vagally mediated as there were no associative modifications in RMSSD levels. They responded to a novel event by orientating towards the novelty coupled with a transient increase in RMSSD. Langbein et al. [36] studied HRV and visual discrimination learning in Nigerian dwarf goats using Polar S810 monitors. To minimise the influence of physical activity, and to study the long-term effects of visual operant conditioning learning on HRV, only IBI data corresponding to resting behaviour (lying, calm and undisturbed) were incorporated into the analyses in this particular research. Whereas HR increased throughout the course of a first learning task, this relationship was the opposite in two proximate tasks, indicating different effects of different learning challenge on HR that may have been related to how familiar the goats were with the function of the learning device. Moreover, this work also found significant relationships between the time taken to perform particular tasks and several HRV indices representing vagal tone. Overall, results from this research suggest that learning related changes in HR were predominantly caused by a withdrawal of vagal tone. To investigate non-linear processes in cardiac regulation, this study used RQA (Table 4). Increased deterministic shares of HRV throughout tasks 1 and 2 indicate that the goats did not really relax until the end of task 3. 4.4.3. Specific conclusions and recommendations The recommendations for HRV measures in sheep or goat are the same as for cattle except it is necessary to share electrode sites in sheep. 4.5. Heart rate variability in poultry 4.5.1. Issues researched The main investigations of HRV analysis in birds have been focused on the mechanism underlying the development of ultradian rhythms of cardiac activity as well as to examine factors affecting welfare, including emotional states and metabolic diseases. Overall, the analysis of HRV has been used in very few studies in avian. Two main reasons can be identified: firstly, HRV analysis requires high-quality data that can be difficult to obtain in birds, particularly when using noninvasive equipment, and; secondly, a lack of fundamental research evaluating the physiological meaning of HRV indices in avian species inhibits the development of further research in this area.
E. von Borell et al. / Physiology & Behavior 92 (2007) 293–316
4.5.2. Methodology Several studies have been carried out on HR fluctuation, rather than variability itself, in chicks, emus and quail, both before and after hatching, and most of these studies have focused on the development of the cardiac rhythms [210–215]. These experiments were not designed to evaluate welfare problems but the methods are interesting and are a useful source of HRV information in normal and non-normal pre- and post-natal chicks. Cardiac activity can be measured pre-hatching by inserting specially designed electrodes through a hole in the egg in three locations. Recording in hatched chicks can be achieved using flexible Ag/AgCl gel electrodes that are attached to the skin at the lateral thoracic wall under both wings and at the ventral abdomen. The electrode wires are then fixed on the back so that the bird could move freely within a small cage. Authors of previous studies [211–215] did not use the usual indices to analyse HRV and their approach led to the identification of three types of HR fluctuations according to their frequency (high: type I HRV; low: type II HRV) and to irregularities (type III HRV). Ultradian and circadian rhythms in HR have also been reported in embryos and hatchlings, respectively, and the distinctive patterns of HR fluctuations are assumed to be partly related to ANS activity. Another study on the chick embryo used time- and frequency domain indices and demonstrated that cardiovascular function in the chick embryo was modulated by the ANS as early as day 19 of incubation and that both SNS and vagal activities have reached a ‘mature’ level by this stage [216]. HRV has also been used to better understand the relationship between coping style and feather pecking. Time domain analysis of HRV identified different autonomic responses in chicks from high- and low-feather pecking lines of laying hens during a stressful challenge [29]. This response was assumed to be related to the different coping styles of the birds as reflected in higher vagal activity in the low-feather pecking line that was perhaps related to more passive coping strategies. HRV analysis has been used to obtain physiological information about broilers at risk of sudden death syndrome which can lead to the death of 2 to 4% of male broiler chickens in a given flock [217]. In this research, birds were equipped with telemetric transmitters when they were 15-days old. The transmitters were implanted subcutaneously at the base of the neck with one electrode placed over the right shoulder and the other one over the left groin area. The freely moving chicks could then be monitored in their home cage. Unfortunately, only SDANN, calculated for three 2-s intervals, was used to evaluate HRV. This parameter was not modified by the dietary treatment purported to enhance sudden death syndrome. The study, however, clearly demonstrates that telemetric devices are powerful tools for accurately measuring cardiac activity and HRV in chickens. A similar surgically implanted telemetric device has been used to show that exposure to high levels of carbon dioxide in 2-week old broilers increases the incidence of cardiac arrhythmias [218]. Biotelemetric devices have also been used for HRV analysis in quail [219]. The purpose of this research was to understand how the ANS responded to emotional stress in strains differentially selected for fear. ANS regulation of the quail
309
heart has also been assessed using HRV analysis and pharmacological blockades [220]. Genetic lines of quail selected for either long or short duration of tonic immobility were compared to their controls. The transmitters were fixed to the back of the quail using a harness type setup. The positive electrode was fixed to the muscular fibres of the quail's back at the wing base and the negative one was fixed to the right Pectoralis major muscle. HRV analysis, in time and frequency domains, showed that the two lines did not differ in their intrinsic heart rate, i.e. heart rate during total ANS blockade. However, parameters of HRV did differ between the two strains. Vagal activity was highest in the line with short-tonic immobility duration while sympathetic activity was the highest in the quail from the long-tonic immobility duration line. It appears, therefore, that response to tonic immobility in quail appears to be reflected in underlying sympathovagal control of the heart. 4.5.3. Specific conclusions and recommendations In conclusion, the use of HRVanalysis is increasing in birds and appears to be a useful tool to study stress and welfare, especially when implanted equipment is used. In general, equipment that has been developed for use in laboratory rodents is also appropriate for use in poultry. Future research should involve establishing the exact physiological meaning of the various HRV parameters in avian species and determining what relationship exists between these parameters and stress and welfare status. 5. General conclusions and recommendations for future research During the last decade, HRV has been successfully used as a measure of autonomic regulation of cardiac activity in farm and companion animals in the following circumstances: (i) to assess stress and well-being under various housing and management conditions on the farm or under laboratory conditions; (ii) to study basic cardiovascular regulation in various test situations, including animal based model studies that enhance our understanding of human diseases; (iii) to evaluate pathological conditions, behavioural disorders, management and housing problems, training and fitness level (mainly horses), and; (iv) to characterise and understand individual traits such as temperament and coping strategies. In most studies, non-invasive ambulatory Holter monitors or telemetric HR monitors have been used for data sampling. Data are commonly analysed and expressed in the time and frequency domain as well as geometrically, although some recent studies in domestic animals and humans indicate that the non-linear indices of HRV are also reliable markers of sympathetic and vagal activation. Chronic changes (such as housing conditions) in HRV parameters should only be measured during stationary condition with minimal, or unvarying, motor activity. In order to analyse the complex oscillations of HRV using data from at least 5-min of consecutive IBIs is recommended. Age, sex and time of the day should be standardised and mentioned. Animals need to be well acclimatised to the recording device before the onset of data collection. A within-individual change in HRV, recorded before and after a treatment is applied, is more meaningful than between groups
310
E. von Borell et al. / Physiology & Behavior 92 (2007) 293–316
comparisons. Recordings of IBIs should contain less than 5% of artefacts before editing and subsequent manual editing of the data should be done to a very high standard. This Task Force has identified the following areas that warrant further study in order to improve methodology and to enhance our understanding of HRV and underlying sympathovagal mechanisms in relation to stress and welfare of farm animals: 1. Study species specific ranges of variation for HRV in animal populations in order to estimate animal numbers needed for studies comparing HRV in response to intrinsic, environmental and other social factors. 2. Study individual traits (coping styles, temperament) in relation to HRV and physiological correlates, and use these traits as possible criteria for selection purposes. 3. Measure diurnal variation and effects of season, age and metabolic state on HRV. 4. Assess HRV in relation to chronic diseases and pain. 5. Improve ease of analysis by means of automatic elimination of artefacts from tachograms. 6. Study regulatory mechanisms contributing to HRV by means of pharmacological inhibition or stimulation of the ANS activity. Appendix A. Abbreviations and main definitions ANS
AV
BP Bpm CLV ECG ENT
FFT HF
HR
Autonomic nervous system. Portion of the nervous system that controls visceral functions of the body. It is traditionally partitioned into the sympathetic (=SNS) and parasympathetic (PNS) branches in reference to the neurotransmitters released at the nerve terminals (noradrenaline for the SNS, acetylcholine for the PNS) and to the region in which the nerves have their origin (the thoracic and lumbar segments of the spinal cord for the SNS, the brainstem via the cranial nerves or the sacral segments of the spinal cord for the PNS). The vagus (= vagal nerve = 10th cranial nerve) is a major component of the ANS. Atrioventricular. The AV node has autonomous heart beat stimulation properties. It is under the control of the sinus node and both sympathetic and parasympathetic (vagal) nerves. Blood pressure. Beats per minute. Number of heart beats in 1 min. Cycle length variability. Standard deviation of IBIs calculated over 24 h. Electrocardiogram. Entropy. One of the quantitative parameters derived from a non-linear mathematical analysis of HRV (see RQA). See exact definition in part III. Fast Fourier transformation. High frequency. The component of HRV determined by spectral analysis whose usual range of variation in human is between 0.15 and 0.4 Hz. In other species, it could differ depending on the respiratory frequency. It depends mainly on vagal (parasympathetic) influences. Heart rate. Frequency of heart beats usually expressed as number of beats per min.
HRV
Heart rate variability. Usually determined by analysing the time series of normal inter-beat intervals determined by ECG or arterial pressure tracings. Various measures of heart rate variability have been proposed. IBI Inter-beat interval. Time interval between two consecutive heart beats in ms. LF Low frequency. Component of HRV determined by spectral analysis whose usual range of variation in humans is between 0.04 and 0.15 Hz. It integrates both vagal (parasympathetic) and sympathetic influences. LMAX Maxline. One of the quantitative parameters derived from a non-linear mathematical analysis of HRV (see RQA). See exact definition in part III. Lorenz plot See Poincaré plot. NN interval Normal-to-Normal interval = IBI. NN50 Normal-to-normal intervals greater than 50 ms. Number of differences between two successive IBIs greater than 50 ms. pNN50 Percentage of normal-to-normal intervals greater than 50 ms. Percentage of differences between two successive IBIs greater than 50 ms. %DET Percentage of determination. One of the quantitative parameters derived from a non-linear mathematical analysis of HRV (see RQA). See exact definition in part III. %REC Percentage of recurrence. One of the quantitative parameters derived from a non-linear mathematical analysis of HRV (see RQA). See exact definition in part III. Poincaré plot Lorenz plot. Scatter-plot where each dot represents an IBI plotted against the previous one. PNS Parasympathetic Nervous System. One of the two main branches of the ANS (see above). PSD Power spectral density. PSD analysis describes the variation of an IBI data series as a set of sine and cosine constituents. One method to calculate PSD is based on FFT. RMSSD Square root of the mean of the sum of the squares of differences between consecutive IBIs. It is the standard deviation of differences between successive IBIs. RQA Recurrence quantification analysis. A non-linear mathematical analysis of HRV. RR R-wave to R-wave. R-waves are identified by electrocardiogram. RR interval = IBI = NN interval. SD1 Standard deviation 1. It represents the short-term component of HRV derived from a quantitative analysis of Poincaré plot. See exact definition in part III. SD2 Standard deviation 2. It represents the long-term component of HRV derived from a quantitative analysis of Poincaré plot. See exact definition in part III. SDANN Standard deviation of the average normal-to-normal intervals. It is the standard deviation of the IBIs averages calculated on 5-min segments during the 24-h cycle. SDNN Standard deviation of normal-to-normal intervals. It is the standard deviation of all IBI measured. SDNNindex Mean of standard deviation of normal-to-normal intervals. It is the mean of the IBI standard deviations calculated on 5-min segments.
E. von Borell et al. / Physiology & Behavior 92 (2007) 293–316
SN
Sinus node = nodus sinu-atrialis. The heart's pacemaker that generates an intrinsic heart rate. It is under the control of both parasympathetic and sympathetic nerves. SNS Sympathetic nervous system. One of the two main branches of the ANS (see above). Tachogram A graphical record representing the variation of IBIs as a function of the interval number. TINN Triangular interpolation of NN interval histogram. One of the quantitative parameters derived from a geometrical analysis of HRV. Trend One of the quantitative parameters derived from a nonlinear mathematical analysis of HRV (see RQA). See exact definition in part III. VLF Very low frequency. It is the component of HRV determined by spectral analysis whose usual range of variation in humans is between 0.0033 and 0.04 Hz. Its physiological significance is not fully clear.
[15]
[16]
[17]
[18]
[19]
[20]
[21]
References [22] [1] Task Force of the European Society of Cardiology, North American Society of Pacing and Electrophysiology. Heart rate variability: standards of measurement, physiological interpretation, and clinical use. Circulation 1996;93:1043–65. [2] Kautzner J. Reproducibility of heart rate variability measurements. In: Malik M, Camm AJ, editors. Heart rate variability. Armonk, N.Y.: Futura Publ. Comp., Inc.; 1995. p. 165–71. [3] Arora R, Krummerman A, Vijayaraman P, Rosengarten M, Suryadevara V, Lejemtel T, et al. Heart rate variability and diastolic heart failure. Pace 2004;27:299–303. [4] Carney RM, Freedland KE, Veith RC. Depression, the autonomic nervous system, and coronary heart disease. Psychosom Med 2005;67:S29–33. [5] Mäkikallio TH, Barthel P, Schneider R, Bauer A, Tapanainen JM, Tulppo MP, et al. Prediction of sudden cardiac death after acute myocardial infarction: role of Holter monitoring in the modern treatment era. Eur Heart J 2005;26:762–9. [6] Lammers AE, Kaemmerer H, Hollweck R, Schneider R, Barthel P. Heart rate turbulence and heart rate variability predict sudden cardiac death in patients with congenital heart disease. J Am Coll Cardiol 2005;45:320A. [7] Abramkin DV, Yavelov IS, Gratsiansky NA. Relationship between heart rate changes during reflex tests and heart rate variability in patients with recent myocardial infarction. Kardiologiya 2004;44:27–34. [8] Mestivier D, Chau NP, Chanudet X, Bauduceau B, Larroque P. Relationship between diabetic autonomic dysfunction and heart rate variability assessed by recurrence plot. Am J Physiol Heart Circ Physiol 1997;272:1094–9. [9] Pagani M. Heart rate variability and autonomic diabetic neuropathy. Diabetes Nutr Metab 2000;13:341–6. [10] Madsen LB, Moller DS, Rasmussen JK, Nyvad O, Pedersen EB. Abnormal heart rate variability in essential hypertension. J Hypertens 2005;23:S382. [11] Davrath LR, Goren Y, Pinhas I, Toledo E, Akselrod S. Early autonomic malfunction in normotensive individuals with a genetic predisposition to essential hypertension. Am J Physiol Heart Circ Physiol 2003;285: H1697–704. [12] Langewitz W, Rüddel H, Schächinger H. Reduced parasympathetic cardiac control in patients with hypertension at rest and under mental stress. Am Heart J 1994;127:122–8. [13] Sharpley CS. Heart rate reactivity and variability as psychophysiological links between stress, anxiety, depression, and cardiovascular disease: implications for health psychology interventions. Aust Psychol 2002;37: 56–62. [14] Thayer JF, Friedman BH. The heart of anxiety: a dynamical systems approach. In: Tilburg MALv, Vingerhoets AJJM, editors. The (non)
[23]
[24]
[25]
[26]
[27]
[28]
[29]
[30]
[31]
[32]
[33]
[34]
[35]
311
expression of emotions in health and disease. Tilburg: Tilburg University Press, Book Tilburg,M.A.L.van and Vingerhoets, A.J.J.M.; 1996.p. 39–48. Sahar T, Shalev AY, Porges SW. Vagal modulation of responses to mental challenge in posttraumatic stress disorder. Biol Psychiatry 2001;49: 637–43. Bär KJ, Letzsch A, Jochum T, Wagner G, Greiner W, Sauer H. Loss of efferent vagal activity in acute schizophrenia. J Psychiatr Res 2005;39: 519–27. Delaney JPA, Brodie DA. Effects of short-term psychological stress on the time and frequency domains of heart-rate variability. Percept Mot Skills 2000;91:515–24. Hall M, Vasko R, Buysse D, Ombao H, Chen QX, Cashmere JD, et al. Acute stress affects heart rate variability during sleep. Psychosom Med 2004;66:56–62. Sharpley CS, Kamen P, Galatsis M, Heppel R, Veivers C, Claus K. An examination of the relationship between resting heart rate variability and heart rate reactivity to a mental arithmetic stressor. Appl Psychophysiol Biofeedback 2000;25:143–54. Donzella B, Gunnar MR, Krueger WK, Alwin J. Cortisol and vagal tone responses to competitive challenge in preschoolers: associations with temperament. Dev Psychobiol 2000;37:209–20. Jørgenson MM, Zachariae R. Autonomic reactivity to cognitive and emotional stress of low, medium, and high hypnotizable healthy subjects. Int J Clin Exp Hypn 2002;50:248–75. Sloan RP, Shapiro PA, Bagiella E, Boni SM, Paik M, Bigger Jr JT, et al. Effect of mental stress throughout the day on cardiac autonomic control. Biol Psychol 1993;37:89–100. Frazier TW, Strauss ME, Steinhauer SR. Respiratory sinus arrhythmia as an index of emotional response in young adults. Psychophysiology 2004;41:75–83. Pomfrett CJD, Glover DG, Bollen BG, Pollard BJ. Perturbation of heart rate variability in cattle fed BSE-infected material. Vet Rec 2004;154: 687–91. Little CJL, Julu POO, Hansen S, Mellor DJ, Milne MH, Barrett DC. Measurement of cardiac vagal tone in cattle: a possible aid to the diagnosis of BSE. Vet Rec 1996;139:527–8. Nolan J, Batin PD, Andrews R, Lindsay SJ, Brooksby P, Mullen H, et al. Prospective study of heart rate variability and mortality in chronic heart failure — results of the United Kingdom heart failure evaluation and assessment of risk trial (UK-Heart). Circulation 1998;98:1510–6. de Jong IC, Sgoifo A, Lambooij E, Korte SM, Blokhuis HJ, Koolhaas JM. Effects of social stress on heart rate and heart rate variability in growing pigs. Can J Anim Sci 2000;80:273–80. Mohr E, Langbein J, Nürnberg G. Heart rate variability — a noninvasive approach to measure stress in calves and cows. Physiol Behav 2002;75:251–9. Korte SM, Ruesnik W, Blokhuis HJ. Heart rate variability during manual restraint in chicks from high- and low-feather pecking lines of laying hens. Physiol Behav 1999;65:649–52. Rietmann TR, Stuart AEA, Bernasconi P, Stauffacher M, Auer JA, Weishaupt MA. Assessment of mental stress in warmblood horses: heart rate variability in comparison to heart rate and selected behavioural parameters. Appl Anim Behav Sci 2004;88:121–36. Kuwahara M, Tsujino Y, Tsubone H, Kumagai E, Tsutsumi H, Tanigawa M. Effects of pair housing on diurnal rhythms of heart rate and heart rate variability in miniature swine. Exp Anim (Tokyo) 2004;53:303–9. Geverink NA, Schouten EG, Gort G, Wiegant VM. Individual differences in behavioral and physiological responses to restraint stress in pigs. Physiol Behav 2002;77:451–7. Bachmann I, Bernasconi P, Hermann R, Weishaupt MA, Stauffacher M. Behavioural and physiological responses to an acute stressor in cribbiting and control horses. Appl Anim Behav Sci 2003;82:297–311. Francis DD, Diorio J, Plotsky PM, Meaney MJ. Environmental enrichment reverses the effects of maternal separation on stress reactivity. J Neurosci 2002;22:7840–3. Hagen K, Langbein J, Schmied C, Lexer D, Waiblinger S. Heart rate variability in dairy cows — influences of breed and milking system. Physiol Behav 2005;85:195–204.
312
E. von Borell et al. / Physiology & Behavior 92 (2007) 293–316
[36] Langbein J, Nürnberg G, Manteuffel G. Visual discrimination learning in dwarf goats and associated changes in heart rate and heart rate variability. Physiol Behav 2004;82:601–9. [37] Thayer JF, Hahn AW, Pearson MA, Sollers III JJ, Johnson PJ, Loch WE. Heart rate variability during exercise in the horse. Biomed Sci Instrum 1997;34:246–51. [38] Kuwahara M, Hiraga A, Kai M, Tsubone H, Sugano S. Influence of training on autonomic nervous function in horses: evaluation by power spectral analysis of heart rate variability. Equine Vet J 1999;Suppl. 30:178–80. [39] Physick-Sheard PW, Marlin DJ, Thornhill R, Schroter RC. Frequency domain analysis of heart rate variability in horses at rest and during exercise. Equine Vet J 2000;32:253–62. [40] Visser EK, van Reenen CG, van der Werf JTN, Schilder MBH, Knaap JH, Barneveld A, et al. Heart rate and heart rate variability during a novel object test and a handling test in young horses. Physiol Behav 2002;76:289–96. [41] Palestrini C, Previde EP, Spiezio C, Verga M. Heart rate and behavioural responses of dogs in the Ainsworth's Strange Situation: a pilot study. Appl Anim Behav Sci 2005;94:75–88. [42] Désiré L, Veissier I, Desprès G, Boissy A. On the way to assess emotions in animals: do lambs (Ovis aries) evaluate an event through its suddenness, novelty, or unpredictability? J Comp Psychol 2004;118:363–74. [43] Randall DC, Brown DR, McGuirt AS, Thompson GW, Armour JA, Ardell JL. Interactions within the intrinsic cardiac nervous system contribute to chronotropic regulation. Am J Physiol Regul Integr Comp Physiol 2003;285:R1066–75. [44] Frandson RD. Anatomy and physiology of farm animals. 4ht ed. Philadelphia: Lea & Febiger; 1986. [45] Coumel P, Maison-Blanche P, Catuli D. Heart rate and heart rate variability. In: Malik M, Camm AJ, editors. Heart rate variability. Armonk, N.Y.: Futura Publ. Comp., Inc.; 1995. p. 207–21. [46] Akselrod S. Components of heart rate variability: basic studies. In: Malik M, Camm AJ, editors. Heart rate variability. Armonk, N.Y.: Futura Publ. Comp., Inc.; 1995. p. 147–63. [47] Hainsworth R. The control and physiological importance of heart rate. In: Malik M, Camm AJ, editors. Heart rate variability. Armonk, N.Y.: Futura Publ. Comp., Inc.; 1995. p. 3–19. [48] Levy MN, Martin PJ. Neural control of the heart. In: Berne RM, editor. Handbook of physiology. Bethesda: American Physiological Society; 1979. p. 581–620. [49] Furnival CM, Linden RJ, Snow HM. Chronotropic and inotropic effects on dog heart of stimulating efferent cardiac sympathetic-nerves. J Physiol (London) 1973;230:137–53. [50] Rosenblueth A, Simeone FA. The interrelations of vagal and accelerator effects on the cardiac rate. Am J Physiol Heart Circ Physiol 1936;110: 42–55. [51] Fritsch JM, Eckberg DL, Graves LD, Wallin BG. Arterial-pressure ramps provoke linear increases of heart period in humans. Am J Physiol Heart Circ Physiol 1986;251:R1086–90. [52] Eckberg DL. Human respiratory–cardiovascular interactions in health and disease. In: Koepchen HP, Huopaniemi T, editors. Cardiorespiratory and motor coordination. Berlin, Heidelberg: Springer-Verlag; 1991. p. 253–8. [53] Malliani A. Association of heart rate variability components with physiological regulatory mechanisms. In: Malik M, Camm AJ, editors. Heart rate variability. Armonk, N.Y.: Futura Publ. Comp., Inc.; 1995. p. 173–88. [54] Moss AJ. Preface. In: Malik M, Camm AJ, editors. Heart rate variability. Armonk, N.Y.: Futura Publ. Comp., Inc.; 1995. p. iii–iv. [55] Cerutti S, Bianchi AM, Mainardi LT. Spectral analysis of the heart rate varibility signal. In: Malik M, Camm AJ, editors. Heart rate variability. Armonk, N.Y.: Futura Publ. Comp., Inc.; 1995. p. 63–74. [56] Levy MN. Autonomic interactions in cardiac control. Ann N Y Acad Sci 1990;601:209–21. [57] Saul JP. Beat-to-beat variations of heart-rate reflect modulation of cardiac autonomic outflow. News Physiol Sci 1990;5:32–7. [58] Rugh KS, Jiang B, Hatfield D, Garner HE, Hahn AW. Cardiac cycle length variability in ponies at rest and during exercise. J Appl Physiol 1992;73:1572–7. [59] Friedman BH, Thayer JF. Autonomic balance revisited: panic anxiety and heart rate variability. J Psychosom Res 1998;44:133–51.
[60] van Ravenswaaij-Arts CMA, Kollée LAA, Hopman JCW, Stoelinga GBA, Vangeijn HP. Heart-rate-variability. Ann Intern Med 1993;118: 436–47. [61] Andreassi JL. Heart activity and behavior. In: Andreassi JL, editor. Psychophysiology. Human behavior and physiological response. Heart activity and behaviorNew York, Oxford: Oxford University Press; 1980. p. 227–61. [62] van Roon A.M. Short term cardiovascular effects of mental tasks. Doctoral Thesis. University of Groningen; 1998. [63] Chapleau MW, Abboud FM. Introduction. In: Chapleau MW, Abboud FM, editors. Neuro-cardiovascular regulation: from molecules to man, vol. 940. Ann. of the New York academy of sciences; 2001. p. XIII-XXII. [64] Dun NJ, Machado BH, Pilowsky PM. Neuron mechanisms of cardiovascular regulation. Boston: Kluwer Academic Publishers; 2004. [65] Hall MC, Steel JD, Stewart GA. Cardiac monitoring during exercise tests in horse. 2. Heart-rate responses to exercise. Aust Vet J 1976;52:1–5. [66] Malik M, Camm AJ. Preface. In: Malik M, Camm AJ, editors. Heart rate variability. Armonk, N.Y.: Futura Publ. Comp., Inc.; 1995. p. ix–x. [67] Hansen S. Kurz-und langfristige Änderungen von Herzschlagvariabilität und Herzschlagfrequenz als Reaktion auf Veränderungen in der sozialen Umwelt (Gruppierung und Grooming-Simulation) von Hausschweinen. Doctoral Thesis. Landwirtschaftliche Fakultät der Martin-Luther-Universität Halle-Wittenberg; 2000. [68] Kleiger RE, Stein PK, Bosner MS, Rottman JN. Time domain measurements of heart rate variability. In: Malik M, Camm AJ, editors. Heart rate variability. Armonk, N.Y.: Futura Publ. Comp., Inc.; 1995. p. 33–45. [69] Berntson GG, Cacioppo JT, Quigley KS. Autonomic determinism — the modes of autonomic control, the doctrine of autonomic space, and the laws of autonomic constraint. Psychol Rev 1991;98:459–87. [70] Kindlon DJ, Tremblay RE, Mezzacappa E, Earls F, Laurent D, Schaal B. Longitudinal patterns of heart-rate and fighting behavior in 9-year-old and 12-year-old boys. J Am Acad Child Psychiatry 1995;34: 371–7. [71] Tulppo MP, Mäkikallio TH, Seppänen T, Laukkanen RT, Huikuri HV. Vagal modulation of heart rate during exercise: effects of age and physical fitness. Am J Physiol Heart Circ Physiol 1998;274:424–9. [72] Tiller WA, McCraty R, Atkinson M. Cardiac coherence: a new, noninvasive measure of autonomic nervous system order. Altern Ther Health Med 1996;2:52–65. [73] Sleigh JW, Henderson JD. Heart-rate-variability and preoperative anxiety. Acta Anaesthesiol Scand 1995;39:1059–61. [74] McCraty R, Atkinson M, Tiller WA, Rein G, Watkins AD. The effects of emotions on short-term power spectrum analysis of heart rate variability. Am J Cardiol 1995;76:1089–93. [75] Catipovic-Veselica K, Amidzic V, Durijancek J, Kozmar D, Sram M, Glavas B, et al. Association of heart rate and heart-rate variability with scores on the Emotion Profile Index in patients with acute coronary heart disease. Psychol Rep 1999;84:433–42. [76] Porges SW, Doussard-Roosevelt JA, Portales AL, Greenspan SI. Infant regulation of the vagal “Brake” predicts child behavior problems: a psychobiological model of social behavior. Dev Psychobiol 1996;29: 697–712. [77] Jänig W. Das vegetative Nervensystem. In: Schmidt RF, Thews G, editors. Physiologie des Menschen. Berlin, Heidelberg: Springer-Verlag; 1977. p. 114–45. [78] Porges SW. Orienting in a defensive world: mammalian modifications of our evolutionary heritage. A Polyvagal Theory. Psychophysiology 1995;32:301–18. [79] Cannon WB. Bodily changes in pain, hunger, fear and rage, an account of recent researches into the function of emotional excitement. New York: Apleton; 1929. [80] Ahmed MW, Kadish AH, Parker MA, Goldberger JJ. Effect of physiological and pharmacological adrenergic-stimulation on heart-ratevariability. J Am Coll Cardiol 1994;24:1082–90. [81] Jokkel G, Bonyhay I, Kollai M. Heart-rate-variability after complete autonomic blockade in man. J Auton Nerv Syst 1995;51:85–9. [82] Sloan RP, Shapiro PA, Bagiella E, Myers MM, Bigger JT, Steinman RC. Brief interval heart period variability by different methods of analysis correlates highly with 24-h analyses in normals. Biol Psychol 1994;38: 133–42.
E. von Borell et al. / Physiology & Behavior 92 (2007) 293–316 [83] Porges SW. Cardiac vagal tone: a physiological index of stress. Neurosci Biobehav Revev 1995;19:225–34. [84] Porges SW. The polyvagal theory: phylogenetic contributions to social behavior. Physiol Behav 2003;79:503–13. [85] Doussard-Roosevelt JA, Porges SW, Scanlon JW, Alemi B, Scanlon KB. Vagal regulation of heart rate in the prediction of developmental outcome for very low birth weight preterm infants. Child Dev 1997;68:173–86. [86] Friedman BH, Thayer JF. Anxiety and autonomic flexibility: a cardiovascular approach. Biol Psychol 1998;47:243–63. [87] Baldock NM, Sibly RM. Effects of handling and transportation on the heart rate and behaviour of sheep. Appl Anim Behav Sci 1990;28: 15–39. [88] Dressen W, Grun H, Hendrichs H. Radio telemetry of heart-rate in male Tammar Wallabies (Marsupialia, Macropodidae) — temporal variations and behavioral-correlates. Aust J Zool 1990;38:89–103. [89] Price S, Sibly RM, Davies MH. Effects of behaviour and handling on heart rate in farmed red deer. Appl Anim Behav Sci 1993;37:111–23. [90] Harri M, Kohonen HT, Mononen J. Heart rate of farmbred blue foxes in normal and simulated situations. Appl Anim Behav Sci 1995;44:262. [91] Hopster H, van der Werf JTN, Blokhuis HJ. Side preference of dairy cows in the milking parlour and its effects on behaviour and heart rate during milking. Appl Anim Behav Sci 1998;55:213–29. [92] Voss B, Mohr E, Krzywanek H. Effects of aqua-treadmill exercise on selected blood parameters and on heart-rate variability of horses. J Vet Med A Physiol Pathol Clin Med 2002;49:137–43. [93] Baldock NM, Sibly RM, Penning PD. Behavior and seasonal-variation in heart-rate in domestic sheep, Ovis aries. Anim Behav 1988;36:35–43. [94] Gabrielsen G, Kanwisher J, Steen JB. Emotional bradycardia — telemetry study on incubating Willow Grouse (Lagopus–Lagopus). Acta Physiol Scand 1977;100:255–7. [95] Gabrielsen GW, Blix AS, Ursin H. Orienting and freezing responses in incubating Ptarmigan Hens. Physiol Behav 1985;34:925–34. [96] Espmark Y, Langvatn R. Development and habituation of cardiac and behavioral-responses in young red deer calves (Cervus-elaphus) exposed to alarm stimuli. J Mammal 1985;66:702–11. [97] Marchant-Forde RM, Marchant-Forde JN. Pregnancy-related changes in behavior and cardiac activity in primiparous pigs. Physiol Behav 2004;82:815–25. [98] Tulppo MP, Hautala AJ, Mäkikallio TH, Laukkanen RT, Nissila S, Hughson RL, et al. Effects of aerobic training on heart rate dynamics in sedentary subjects. J Appl Physiol 2003;95:364–72. [99] Marchant-Forde RM, Marlin DJ, Marchant-Forde JN. Validation of a cardiac monitor for measuring heart rate variability in adult female pigs. Accuracy, artefacts and editing. Physiol Behav 2004;80:449–558. [100] Norman SE, Eager RA, Waran NK, Jeffery L, Schroter RC, Marlin DJ. Recording of ECG signals on a portable MiniDisc recorder for time and frequency domain heart rate variability analysis. Physiol Behav 2005;83:729–38. [101] Sgoifo A, Stilli D, Medici D, Gallo P, Aimi B, Musso E. Electrode positioning for reliable telemetry ECG recordings during social stress in unrestrained rats. Physiol Behav 1996;60:1397–401. [102] Sgoifo A, Koolhaas JM, Musso E, de Boer SF. Different sympathovagal modulation of heart rate during social and nonsocial stress episodes in wild-type rats. Physiol Behav 1999;67:733–8. [103] Shusterman V, Usiene I, Harrigal C, Lee JS, Kubota T, Feldman AM, et al. Strain-specific patterns of autonomic nervous system activity and heart failure susceptibility in mice. Am J Physiol Heart Circ Physiol 2002;282: H2076–83. [104] Hassimoto M, Harada T. Use of a telemetry system to examine recovery of the cardiovascular system after excitement induced by handling stress in a conscious cynomolgus monkey (Macaca fascicularis). J Med Primatol 2003;32:346–52. [105] Soloviev MV, Hamlin RL, Shellhammer LJ, Barrett RM, Wally RA, Birchmeier PA, et al. Variations in hemodynamic parameters and ECG in healthy, conscious, freely moving telemetrized beagle dogs. Cardiovasc Toxicol 2006;6:51–62. [106] Hydbring E, Cvek K, Olsson K. Telemetric registration of heart rate and blood pressure in the same unrestrained goats during pregnancy, lactation
[107] [108]
[109]
[110]
[111]
[112] [113]
[114] [115]
[116] [117]
[118]
[119]
[120]
[121]
[122]
[123]
[124]
[125]
[126] [127]
[128]
313
and the non-pregnant, non-lactating period. Acta Physiol Scand 1999;165:135–42. Hopster H, Blokhuis HJ. Validation of a heart-rate monitor for measuring a stress response in dairy cows. Can J Anim Sci 1994;74:465–74. van Oldruitenborgh-Oosterbaan SMM, van den Hoven R, Breukink HJ. The accuracy of three different heart-rate meters used for studies in the exercising horse. J Vet Med A Physiol Pathol Clin Med 1988;35: 665–72. Kingsley M, Lewis MJ, Marson RE. Comparison of Polar S810 and an ambulatory ECG system for RR interval measurement during progressive exercise. Int J Sports Med 2005;26:39–44. Loimaala A, Sievanen H, Laukkanen R, Parkka J, Vuori I, Huikuri H. Accuracy of a novel real-time microprocessor QRS detector for heart rate variability assessment. Clin Physiol 1999;19:84–8. Storck N, Ericson M, Lindblad LE, Jensen-Urstad M. Automated computerized analysis of heart rate variability with digital filtering of ectopic beats. Clin Physiol 2001;21:15–24. Berntson GG, Stowell JR. ECG artefacts and heart period variability: don't miss a beat! Psychophysiology 1998;35:127–32. Salo MA, Huikuri HV, Seppanen T. Ectopic beats in heart rate variability analysis: effects of editing on time and frequency domain measures. Ann Noninvasive Electrocardiol 2001;6:5–17. Cheung MN. Detection of recovery from errors in cardiac interbeat intervals. Psychophysiology 1981;18:341–6. Kamath MV, Fallen EL. Correction of the heart rate variability signal for ectopics and missing beats. In: Malik M, Camm AJ, editors. Heart rate variability. Armonk, NY: Futura Publ. Comp., Inc.; 1995. p. 75–85. Wilson GFA. Comparison of three cardiac ambulatory recorders using flight data. Int J Aviation Psychol 2001;12:111–9. Xia R, Odemuyiwa O, Gill J, Malik M, Camm AJ. Influence of recognition errors of computerised analysis of 24-hour electrocardiograms on the measurement of spectral components of heart rate variability. Int J Biomed Comput 1993;32:223–35. Singer DH, Ori Z. Changes in heart rate variability associated with sudden cardiac death. In: Malik M, Camm AJ, editors. Heart rate variability. Armonk, N.Y.: Futura Publ. Comp., Inc.; 1995. p. 429–48. Osterhues HH, Hanzel SR, Kochs M, Hombach V. Influence of physical activity on 24-h measurements of heart rate variability in patients with coronary artery disease. Am J Cardiol 1997;80:1434–7. Mooney DM, Groome LJ, Bentz LS, Holland S. Poincaré analysis of fetal heart rate pattern: effect of observation period. Engineering in medicine and biology societyIEEE 17th annual conference, Montreal, Que., Canada; 1995. Fei L, Copie X, Malik M, Camm AJ. Short and long-term assessment of heart rate variability for risk stratification after acute myocardial infarction. Am J Cardiol 1996;77:681–4. Bernardi L, Valle F, Coco M, Calciati A, Sleight P. Physical activity influences heart rate variability and very-low-frequency components in Holter electrocardiograms. Cardiovasc Res 1996;32:234–7. Silvetti MS, Drago F, Ragonese P. Heart rate variability in healthy children and adolescents is partially related to age and gender. Int J Cardiol 2001;81:169–74. Sgoifo A, Costoli T, Meerlo P, Buwalda B, Pico'Alfonso MA, De Boer S, et al. Individual differences in cardiovascular response to social challenge. Neurosci Biobehav Rev 2005;29:59–66. Litvack DA, Oberlander TF, Carney LH, Saul JP. Time and frequency domain methods for heart rate variability analysis: a methodological comparison. Psychophysiology 1995;32:492–504. Goldberger AL. Nonlinear dynamics, fractals and chaos: applications to cardiac electrophysiology. Ann Biomed Eng 1990;18:195–8. Zbilut JP, Webber CL, Zak M. Quantification of heart rate variability using methods derived from nonlinear dynamics. In: Drzewiecki GM, Li JKJ, editors. Assessment and analysis of cardiovascular function. New York: Springer Verlag; 1998. p. 324–34. Voss A, Kurths J, Kleiner HJ, Witt A, Wessel N, Saparin P, et al. The application of methods of non-linear dynamics for the improved and predictive recognition of patients threatened by sudden cardiac death. Cardiovasc Res 1996;31:419–33.
314
E. von Borell et al. / Physiology & Behavior 92 (2007) 293–316
[129] Guzzetti S, Signorini MG, Cogliati C, Mezzetti S, Porta A, Cerutti S, et al. Non-linear dynamics and chaotic indices in heart rate variability of normal subjects and heart-transplanted patients. Cardiovasc Res 1996;31:441–6. [130] Wagner CD, Persson PB. Chaos in the cardiovascular system: an update. Cardiovasc Res 1998;40:257–64. [131] Kamen PW, Tonkin AM. Application of the Poincaré plot to heart-ratevariability — a new measure of functional status in heart-failure. Aust N Z J Med 1995;25:18–26. [132] Mourot L, Bouhaddi M, Perrey S, Cappelle S, Henriet MT, Wolf JP, et al. Decrease in heart rate variability with overtraining: assessment by the Poincaré plot analysis. Clin Physiol Funct Imaging 2004;24:10–8. [133] Bergfeldt L, Haga Y. Power spectral and Poincaré plot characteristics in sinus node dysfunction. J Appl Physiol 2003;94:2217–24. [134] Woo MA, Stevenson WG, Moser DK, Trelease RB, Harper RM. Patterns of beat-to-beat heart rate variability in advanced heart failure. Am Heart J 1992;123:704–10. [135] Kamen PW, Krum H, Tonkin AM. Poincaré plot of heart rate variability allows quantitative display of parasympathetic nervous activity in humans. Clin Sci 1996;91:201–8. [136] Huikuri HV, Poutiainen AM, Makikallio TH, Koistinen MJ, Airaksinen KEJ, Mitrani RD, et al. Dynamic behavior and autonomic regulation of ectopic atrial pacemakers. Circulation 1999;100:1416–22. [137] Stein PK, Anand Reddy MD. Non-linear heart rate variability and risk stratification in cardiovascular disease. Indian Pacing Electrophysiol J 2005;5:210–20. [138] Huikuri HV, Seppänen T, Koistinen MJ, Airaksinen KEJ, Ikaheimo MJ, Castellanos A, et al. Abnormalities in beat-to-beat dynamics of heart rate before spontaneous onset of life-threatening ventricular tachyarrhythmias in patients with prior myocardial infarction. Circulation 1996;93: 1836–44. [139] Tulppo MP, Mäkikallio TH, Takala TES, Seppänen T, Huikuri HV. Quantitative beat-to-beat analysis of heart rate dynamics during exercise. Am J Physiol Heart Circ Physiol 1996;271:244–52. [140] Malliani A, Lombardi F, Pagani M, Cerutti S. Power spectral analysis of cardiovascular variability in patients at risk for sudden cardiac death. J Cardiovasc Electrophysiol 1994;5:274–86. [141] Houle MS, Billman GE. Low-frequency component of the heart rate spectrum: a poor marker of sympathetic activity. Am J Physiol Heart Circ Physiol 1999;276:215–23. [142] Després G, Veissier I, Boissy A. Effect of autonomic blockers on heart period variability in calves: evaluation of the sympathovagal balance. Physiol Res 2002;51:347–53. [143] Ponikowski P, Chua TP, Amadi AA, Piepoli M, Harrington D, Volterrani M, et al. Detection and significance of a discrete very low frequency rhythm in RR interval variability in chronic congestive heart failure. Am J Cardiol 1996;77:1320. [144] Wagner CD, Just A, Nafz B, Persson PB. Very low frequency oscillations in arterial blood pressure after autonomic blockade in conscious dogs. Am J Physiol Regul Integr Comp Physiol 1997;41:R2034–9. [145] Yeragani VK, Rao R, Jayaraman A, Poh R, Balon R, Glitz D. Heart rate time series: decreased chaos after intravenous lactate and increased nonlinearity after isoproterenol in normal subjects. Psychiatry Res 2002;109: 81–92. [146] Slangen BFM, Out ICM, Janssen BJA, Peeters LLH. Blood pressure and heart rate variability in early pregnancy in rats. Am J Physiol Heart Circ Physiol 1997;273:H1794–9. [147] Pagani M, Lombardi F, Guzzetti S, Rimoldi O, Furlan R, Pizzinelli P, et al. Power spectral-analysis of heart-rate and arterial-pressure variabilities as a marker of sympathovagal interaction in man and conscious dog. Circ Res 1986;59:178–93. [148] Camm AJ, Malik M, Bigger JT, Breithardt G, Cerutti S, Cohen RJ, et al. Heart rate variability — standards of measurement, physiological interpretation, and clinical use. Circulation 1996;93:1043–65. [149] Peng CK, Havlin S, Stanley HE, Goldberger AL. Quantification of scaling exponents and crossover phenomena in nonstationary heartbeat time-series. Chaos 1995;5:82–7. [150] Bigger JT, Steinman RC, Rolnitzky LM, Fleiss JL, Albrecht P, Cohen RJ. Power law behavior of RR-interval variability in healthy middle-aged
[151]
[152]
[153] [154] [155] [156] [157]
[158]
[159]
[160] [161]
[162]
[163]
[164]
[165] [166]
[167]
[168]
[169]
[170] [171]
[172]
[173]
[174]
persons, patients with recent acute myocardial infarction, and patients with heart transplants. Circulation 1996;93:2142–51. Pikkujämsä SM, Mäkikallio TH, Sourander LB, Raiha IJ, Puukka P, Skytta J, et al. Cardiac interbeat interval dynamics from childhood to senescence — comparison of conventional and new measures based on fractals and chaos theory. Circulation 1999;100:393–9. Huikuri HV, Mäkikallio TH, Perkiomaki J. Measurement of heart rate variability by methods based on nonlinear dynamics. J Electrocardiol 2003;36:95–9. Weiss JN, Garfinkel A, Spano ML, Ditto WL. Chaos and chaos control in biology. J Clin Invest 1994;93:1355–60. Filligoi GC, Felici F. Detection of hidden rhythms in surface EMG signals with a nonlinear time-series tool. Med Eng Phys 1999;21:439–48. Goldberger AL, West BJ. Applications of nonlinear dynamics to clinical cardiology. Ann N Y Acad Sci 1987;504:195–213. Signorini MG, Cerutti S, Guzzetti S, Parola R. Nonlinear dynamics of cardiovascular variability signals. Methods Inf Med 1994;33:81–4. Yamamoto Y, Hughson RL. On the fractal nature of heart-rate-variability in humans — effects of data length and beta-adrenergic-blockade. Am J Physiol Regul Integr Comp Physiol 1994;266:R40–9. Hagerman I, Berglund M, Lorin M, Nowak J, Sylvén C. Chaos-related deterministic regulation of heart rate variability in time- and frequency domains: effects of autonomic blockade and exercise. Cardiovasc Res 1996;31:410–8. Kanters JK, Højgaard MVH, Agner E, Holstein-Rathlou N. Short- and long-term variations in non-linear dynamics of heart rate variability. Cardiovasc Res 1996;31:400–9. Kantz H, Schreiber T. Human ECG: nonlinear deterministic versus stochastic aspects. IEE Proc A Sci Meas Technol 1998;145:279–84. Potapov A. Are R–R intervals data appropriate to study the dynamics of heart? In: Kantz H, Kurths J, Mayer-Kress G, editors. Nonlinear analysis of physiological data. Berlin: Springer-Verlag; 1998. p. 117–28. Costa M, Pimentel IR, Santiago T, Sarreira P, Melo J, Ducla-Soares E. No evidence of chaos in the heart rate variability of normal and cardiac transplant human subjects. J Cardiovasc Electrophysiol 1999;10:1350–7. Giuliani A, Piccirillo G, Marigliano V, Colosimo A. A nonlinear explanation of aging-induced changes in heartbeat dynamics. Am J Physiol Heart Circ Physiol 1998;44:H1455–61. Theiler J, Eubank S, Longtin A, Gadrikian B, Farmer JD. Testing for nonlinearity in time series: the method of surrogate data. Physica D 1992; D 58:77–94. Webber CL, Zbilut JP. Dynamical assessment of physiological systems and states using recurrence plot strategies. J Appl Physiol 1994;76: 965–73. Zbilut JP, Thomasson N, Webber CL. Recurrence quantification analysis as a tool for nonlinear exploration of nonstationary cardiac signals. Med Eng Phys 2002;24:53–60. Dabiré H, Mestivier D, Jarnet J, Safar ME, Chau NP. Quantification of sympathetic and parasympathetic tones by nonlinear indexes in normotensive rats. Am J Physiol Heart Circ Physiol 1998;44:H1290–7. Ikegawa S, Shinohara M, Fukunaga T, Zbilut JP, Webber CL. Nonlinear time-course of lumbar muscle fatigue using recurrence quantification. Biol Cybern 2000;82:373–82. Trulla LL, Giuliani A, Zbilut JP, Webber CL. Recurrence quantification analysis of the logistic equation with transients. Phys Lett A 1996;223: 255–60. Eckmann JP, Kamphorst SO, Ruelle D. Recurrence plots of dynamicsystems. Europhys Lett 1987;4:973–7. Webber CL, Zbilut JP. Assessing deterministic structures in physiological systems using recurrence plot strategies. In: Khoo MCK, editor. Bioengineering approaches to pulmonary physiology and medicine. New York: Plenum Press; 1996. p. 137–48. González JJ, Cordero JJ, Feria M, Pereda E. Detection and sources of nonlinearity in the variability of cardiac R–R intervals and blood pressure in rats. Am J Physiol Heart Circ Physiol 2000;279:H3040–6. Mesangeau D, Laude D, Elghozi JL. Early detection of cardiovascular autonomic neuropathy in diabetic pigs using blood pressure and heart rate variability. Cardiovasc Res 2000;45:889–99. Olmstead AL, Kramer R, Dodam JR, Rubin L. Sex hormone modulation of heart rate variability in miniature swine. FASEB J 2005;19:A618.
E. von Borell et al. / Physiology & Behavior 92 (2007) 293–316 [175] Kuwahara M, Suzuki A, Tsutsumi H, Tanigawa M, Tsubone H, Sugano S. Power spectral analysis of heart rate variability for assessment of diurnal variation of autonomic nervous activity in miniature swine. Lab Anim Sci 1999;49:202–8. [176] Khan MS, Zhao N, Sica AL, Gootman N, Gootman PM. Changes in R–R and Q–T intervals following cardiac vagotomy in neonatal swine. Exp Biol Med 2001;226:32–6. [177] Voss LJ, Bolton DPG, Galland BC, Taylor BJ. Endotoxin effects on markers of autonomic nervous system function in the piglet: implications for SIDS. Biol Neonate 2004;86:39–47. [178] Suzuki A, Tsutsumi H, Kusakabe K, Kuwahara M, Sugano S, Tanigawa M. Establishment of a 24-hour electrocardiogram recording system using a Holter recorder for miniature swine. Lab Anim UK 1998;32: 165–72. [179] Marchant-Forde R.M. Heart rate variability and sympathovagal balance during normal and stressed states in farm animals. Doctoral Thesis. De Montfort University, UK; 2003. [180] Minero M, Canali E, Ferrante V, Carenzi C. Measurement and time domain analysis of heart rate variability in dairy cattle. Vet Rec 2001;149: 772–4. [181] Hagen K, Broom DM. Emotional reactions to learning in cattle. Appl Anim Behav Sci 2004;85:203–13. [182] Desprès G, Boissy A, Désiré L, Le Neindre P, Veissier I. Validation of the measure of sympatho-vagal effect in lambs through autonomic blockades and heart rate variability indexes. J Anim Vet Adv 2003;2: 615–9. [183] Clabough DL, Swanson CR. Heart rate spectral analysis of fastinginduced bradycardia of cattle. Am J Physiol Heart Circ Physiol 1989;257: R1303–6. [184] Mestivier D, Dabiré H, Safar ME, Chau NP. Use of nonlinear methods to assess affects of clonidine on blood pressure in spontaneously hypertensive rats. J Appl Physiol 1998;84:1795–800. [185] Clement F, Barrey E. Heart rate fluctuations in the horse at rest: (1) investigation of heart rate changes by spectrum analysis. C R Acad Sci III Vie 1995;318:859–65. [186] Clement F, Barrey E. Heart rate fluctuations in the horse at rest: (2) biological variation factors related to behavioural profile. C R Acad Sci III Vie 1995;318:867–72. [187] Eager RA, Norman SE, Price J, Welsh E, Waran NK, Martin DJ. Repeatability, diurnal variation and temperament: factors affecting the use of heart rate variability in horses. Proceeding of the 38th int. congr. of the ISAE, Helsinki; 2004. p. 235. [188] Kato T, Ohmura H, Hiraga A, Wada S, Kuwahara M, Tsubone H. Changes in heart rate variability in horses during immersion in warm springwater. Am J Vet Res 2003;64:1482–5. [189] Kuwahara M, Hashimoto S, Ishii K, Yagi Y, Hada T, Hiraga A, et al. Assessment of autonomic nervous function by power spectral analysis of heart rate variability in the horse. J Auton Nerv Syst 1996;60: 43–8. [190] Kuwahara M, Hiraga A, Kai M, Tsubone H, Sugano S. Influence of training on autonomic nervous function in horses: evaluation by power spectral analysis of heart rate variability. Equine Vet J Suppl 1999;30: 178–80. [191] Kuwahara M, Hiraga A, Nishimura T, Tsubone H, Sugano S. Power spectral analysis of heart rate variability in a horse with atrial fibrillation. J Vet Med Sci 1998;60:111–4. [192] Ohmura H, Hiraga A, Aida H, Kuwahara M, Tsubone H. Effects of repeated atropine injection on heart rate variability in thoroughbred horses. J Vet Med Sci 2001;63:1359–60. [193] Perkins JD, Bowen IM, Else RW, Marr CM, Mayhew IG. Functional and histopathological evidence of cardiac parasympathetic dysautonomia in equine grass sickness. Vet Rec 2000;146:246–50. [194] Thayer JF, Hahn AW, Sollers JJ, van Doornen L, Johnson PJ. Heart rate variability in the horse by ambulatory monitoring. Biomed Sci Instrum 1997;33:482–5. [195] Visser EK, van Reenen CG, Rundgren M, Zetterqvist M, Morgan K, Blokhuis HJ. Responses of horses in behavioural tests correlate with temperament assessed by riders. Equine Vet J 2003;35:176–83.
315
[196] Rietmann TR, Stauffacher M, Bernasconi P, Auer JA, Weishaupt MA. The association between heart rate, heart rate variability, endocrine and behavioural pain measures in horses suffering from laminitis. J Vet Med A Physiol Pathol Clin Med 2004;51:218–25. [197] Patteson M. Equine cardiology. Oxford: Blackwell Science; 1996. [198] Rossy LA, Thayer JF. Fitness and gender-related differences in heart period variability. Psychosom Med 1998;60:773–81. [199] Markovitz LJ, Savage EB, Ratcliffe MB, Bavaria JE, Kreiner G, Iozzo RV, et al. Large animal model of left ventricular aneurysm. Ann Thorac Surg 1989;48:838–45. [200] McKibben JS, Getty R. A comparative study of the cardiac innervation in domestic animals: sheep. Acta Anat (Basel) 1969;74:228–42. [201] Segar JL. Ontogeny of the arterial and cardiopulmonary baroreflex during fetal and postnatal life. Am J Physiol Heart Circ Physiol 1997;273: R457–71. [202] Woods Jr JR, Dandavino A, Murayama K, Brinkman CR, Assali NS. Autonomic control of cardiovascular functions during neonatal development and in adult sheep. Circ Res 1977;40:401–7. [203] Nuwayhid B, Brinkman CR, Su C, Bevan JA, Assali NS. Development of autonomic control of fetal circulation. Am J Physiol Heart Circ Physiol 1975;228:337–44. [204] Kimura Y, Okamura K, Watanabe T, Murotsuki J, Suzuki T, Yano M, et al. Power spectral analysis for autonomic influences in heart rate and blood pressure variability in fetal lambs. Am J Physiol Heart Circ Physiol 1996;271:H1333–9. [205] Metsala T, Siimes A, Valimaki I. The effect of change in sympatho-vagal balance on heart rate and blood pressure variability in the foetal lamb. Acta Physiol Scand 1995;154:85–92. [206] Yu ZY, Lumbers ER. Effects of birth on baroreceptor-mediated changes in heart rate variability in lambs and fetal sheep. Clin Exp Pharmacol Physiol 2002;29:455–63. [207] Westgate JA, Bennet L, Gunn AJ. Fetal seizures causing increased heart rate variability during terminal fetal hypoxia. Am J Obstet Gynecol 1999;181:765–6. [208] Vapaavouri EK, Shinebourne EA, Williams RL, Heymann MA, Rudolph AM. Development of cardiovascular responses to autonomic blockade in intact fetal and neonatal lambs. Biol Neonate 1973;22:177–88. [209] Grönlund JU, Antila KJ, Siimes AS, Metsala T, Oja R, Tuominen J, et al. Beta-adrenergic control and inter-relationships between heart rate and blood pressure in neonatal lambs. Med Biol Eng Comput 1989;27: 163–70. [210] Pearson JT, Tsudzuki M, Nakane Y, Akiyama R, Tazawa H. Development of heart rate in the precocial king quail Coturnix chinensis. J Exp Biol 1998;201:931–41. [211] Moriya K, Hochel J, Pearson JT, Tazawa H. Cardiac rhythms in developing chicks. Comp Biochem Physiol A 1999;124:461–8. [212] Moriya K, Pearson JT, Burggren WW, Ar A, Tazawa H. Continuous measurements of instantaneous heart rate and its fluctuations before and after hatching in chickens. J Exp Biol 2000;203:895–903. [213] Moriya K, Kato K, Matsumura M, Dzialowski E, Burggren WW, Tazawa H. Cardiac rhythms in developing emu hatchlings. Comp Biochem Physiol A 2002;131:787–95. [214] Tazawa H, Akiyama R, Moriya K. Development of cardiac rhythms in birds. Comp Biochem Physiol A 2002;132:675–89. [215] Tazawa H, Moriya K, Tamura A, Akiyama R. Low-frequency oscillation of instantaneous heart rate in newly hatched chicks. Comp Biochem Physiol A 2002;131:797–803. [216] Aubert AE, Beckers F, Ramaekers D, Verheyden B, Leribaux C, Aerts JM, et al. Heart rate and heart rate variability in chicken embryos at the end of incubation. Exp Physiol 2004;89:199–208. [217] Blanchard SM, Degernes LA, DeWolf Jr DK, Garlich JD. Intermittent biotelemetric monitoring of electrocardiograms and temperature in male broilers at risk for sudden death syndrome. Poult Sci 2002;81:887–91. [218] Korte SM, Sgoifo A, Ruesink W, Kwakernaak C, van Voorst S, Scheele CW, et al. High carbon dioxide tension (PCO2) and the incidence of cardiac arrhythmias in rapidly growing broiler chickens. Vet Rec 1999;145:40–3.
316
E. von Borell et al. / Physiology & Behavior 92 (2007) 293–316
[219] Valance D, Boissy A, Desprès G, Constantin P, Leterrier C. Emotional reactivity modulates autonomic responses to an acoustic challenge in quail. Physiol Behav 2007;90:165–71. [220] Gaudinière D, Desprès G, Boissy A, Constantin P, Leterrier C. Heart rate variability in quail selected for duration of tonic immobility.
7th European symposium on poultry welfare, Lublin (PL); 2005. p. 21–34. [221] McCraty R, Tiller WA, Atkinson M. Head–heart entrainment: a preliminary survey. Brain mind applied neurophysiology EEG neurofeedback meeting, Key West; 1996. p. 1–9.