Heat-Shock Response in Arabidopsis thaliana Explored by Multiplexed Quantitative Proteomics Using Differential Metabolic Labeling Magnus Palmblad,* Davinia J. Mills, and Laurence V. Bindschedler The BioCentre, The University of Reading, Whiteknights, Post Office Box 221, Reading RG6 6AS, United Kingdom Received August 15, 2007; Accepted November 13, 2007
Abstract: We have developed a general method for multiplexed quantitative proteomics using differential metabolic stable isotope labeling and mass spectrometry. The method was successfully used to study the dynamics of heat-shock response in Arabidopsis thaliana. A number of known heat-shock proteins were confirmed, and some proteins not previously associated with heat shock were discovered. The method is applicable in stable isotope labeling and allows for high degrees of multiplexing. Keywords: Liquid chromatography • mass spectrometry • quantitation • multiplexing • N-15 • stable isotope • metabolic labeling • Arabidopsis thaliana • heat shock
Introduction In recent years, several families of methods for large-scale protein quantitation have been developed and applied in a wide range of biological research. Schemes for both metabolic labeling in the living organism and postlabeling of extracted proteins or peptides are used to introduce one or several labels for quantitation purposes. The labels can be a stable or radioactive isotope or a fluorescent or otherwise differentiable chemical group. The quantitation is either relative between differentially labeled proteins or absolute comparing to known and differentially labeled standards, such as in the AQUA isotope dilution method.1 Many protocols are designed for mass spectrometry (MS) to provide concomitant identification and relative quantitation on a proteomic scale, for example, isotope-coded affinity tags (ICAT),2,3 stable isotope labeling by amino acids in cell culture (SILAC),4 isotope-coded protein labels (ICPL),5 and isobaric tags for relative and absolute quantitation (iTRAQ).6 An increasingly popular method of labeling proteins in cell cultures7 and whole plants8 uses inexpensive inorganic ammonium and nitrate salts enriched in 15N. There are several advantages to using metabolic labeling in quantitative proteomics. The early pooling of samples compared to postlabeling methods eliminates errors from different sample processing, protein extraction, and enzymatic digestion. Metabolic labeling is also highly efficient and can be relatively * To whom correspondence should be addressed: Department of Parasitology, Leiden University Medical Center, P.O. Box 9600, 2300 RC Leiden, The Netherlands. E-mail:
[email protected] or magnus.palmblad@ gmail.com.
780 Journal of Proteome Research 2008, 7, 780–785 Published on Web 01/12/2008
inexpensive compared to commercial labeling reagents. However, methods for multiplexed quantitation in the MS domain suffer from signal dilution at higher degrees of multiplexing, particularly as the tandem mass spectrometry (MS/MS) signal available for peptide identification is lower given the same amount of sample loaded on the column or injected into the mass spectrometer. This may partly be overcome by mixing samples at nonuniform ratios, for instance, by increasing the fraction of unlabeled proteins best suited for identification. The applicability of metabolic labeling is also limited to species that can be grown on a defined culture medium or food source providing the isotopic label. Current state-of-the-art ion-trap mass spectrometers are fast (∼10 spectra/s) and suitable for liquid chromatography (LC)-MS/MS and peptide identification. However, they cannot easily resolve overlapping isotopic envelopes from different peptides, which makes them less suitable for MS-based quantitation. Fourier-transform ion cyclotron resonance (FTICR) mass spectrometry, on the other hand, is slow (∼1 spectra/s) and poorly suited for LC-MS/MS and large-scale peptide identification but provides the resolving power required to discriminate overlapping isotopic envelopes. We combined iontrap LC-MS/MS for peptide identification with FTICR LC-MS for quantitation using chromatographic alignment9 and developed a novel algorithm for an arbitrary degree of multiplexing in relative protein abundance measurements using differential stable isotope labeling. We then applied the multiplexed quantitation method in a study of the dynamics of heat-shock protein expression in a plant model system (Arabidopsis thaliana) and compared the results with reverse transcriptase polymerase chain reaction (RT-PCR) gene expression data from similar and previously published experiments. For a recent review of the current understanding of heat-stress response in plants, see Kotak et al.10
Experimental Section A. thaliana Heat-Shock Experiment. Sterilized A. thaliana ecotype Columbia Col-0 seeds were vernalized for 48 h at 4 °C and germinated in 200 µL pipette tips containing 0.7% agar (Fluka, Gillingham, U.K.) half-strength hydroponic medium (below) in sterile tip boxes with a transparent lid. Plants were grown under a 10 h/14 h light/dark cycle at 20 °C. After 12 days, one-third of the pipette tips were cut to allow for root growth. After 20 days, 12 plant-containing tips were transferred into a perforated lid of a black painted 1 L polyethylene box 10.1021/pr0705340 CCC: $40.75
2008 American Chemical Society
technical notes
Heat-Shock Response in A. thaliana containing 1 L of full-strength hydroponic medium. The hydroponic medium consisted of 2.5 mM KNO3, 1 mM CaCl2, 0.75 mM MgSO4, 0.5 mM KH2PO4, 0.5 mM NH4NO3, 1 mL/L micronutrient solution (50 mM H3BO3, 10 mM MnSO4 · H2O, 1.5 mM ZnSO4 · 7H2O, 1 mM CuSO4 · 5H2O, and 0.58 mM MoO3), and 1 mL/L 70 mM Fe-ethylenediaminetetraacetic acid (EDTA) solution (all chemicals from Sigma-Aldrich, Poole, Dorset, U.K.). Five different levels of 15N, ∼0% (natural 15N abundance), ∼24, ∼47, ∼65, and ∼99%, were achieved by dilution from “99%” 15N KNO3 (Cambridge Isotope Laboratories, Inc., Andover, MA) and “98+%” 15N NH4NO3 (Sigma). After 7 weeks, three boxes of differentially labeled plants were moved to a second incubator at 38 °C (dark). Plants in a fourth box and the level of 15N were used as the control and harvested immediately by cutting and flash freezing all leaf rosettes in liquid N2. Heat-shocked plants were harvested identically after 1, 2, and 4 h in 38 °C. Dark control plants at 20 °C with 47% 15 N were harvested after 4 h, and light and dark plants kept at 20 °C with 0 and 99% 15N, respectively, were harvested after 6 h. The biological heat-shock experiment was performed 3 times, varying the level of 15N harvested at a given time point (replicate 1, 99, 24, 65, and 0% 15N after 0, 1, 2, and 4 h at 38 °C; replicate 2, 0, 65, 24, and 99%; and replicate 3, 65, 0, 99, and 0%). All healthy plants in a box were harvested together; i.e., each data point is an average of 10–12 plants. Protein Extraction, Separation, and Digestion. Plant material was ground in liquid N2 with mortar and pestle and kept at -80 °C until used. Proteins were extracted in ice-cold 50 mM Tris at pH 7.6, 0.33 M sucrose, 1 mM dithiothreitol (DTT), 1 mM MgCl2, 1% (w/v) poly(vinylpolypyrrolidone), and 1/500 protease inhibitor cocktail VI (Calbiochem/Merck, Nottingham, U.K.). Samples were thawed, mixed, and kept on ice for 5 min. Particulates were removed by 2 × 10 min centrifugations at 3300g and 17860g at 4 °C, each time transferring the supernatant into a fresh tube. The protein concentration was estimated by the Bradford method (reagent from Bio-Rad, Hemel Hempstead, U.K.). Extracted proteins were separated on a 12% acrylamide SDS-PAGE gel (Protean III, Bio-Rad). The gel was fixed for 1 h in 40% ethanol and 10% acetic acid and stained with colloidal Coomassie for 12 h before transfer into 0.1% acetic acid. A total of 28 gel bands per sample were excised, cut into 1–2 mm3 pieces, and stored at -80 °C. The gel pieces were washed, each time for 10 min, in 100 µL of 25 mM ammonium bicarbonate (ABC) (twice), 50 µL of 25% acetonitrile (ACN) in ABC (once), and 30 µL of 50% ACN in ABC (3 times) and dried for 20 min in a vacuum concentrator (Eppendorf, Cambridge, U.K.). Cystines were reduced by adding 30 µL of 20 mM DTT in ABC and incubation for 45 min at 56 °C. Excess liquid was removed, and the gel pieces were covered with 30 µL of 10 mg/mL iodoacetamide in ABC and incubated for 1 h in darkness to alkylate the cysteines. The gel pieces were then washed 3 times in 50 µL of 50% ACN in ABC and dried for 20 min in a vacuum concentrator. The gel pieces were then rehydrated in 15 µL of 8 ng/µL modified sequencing-grade trypsin (Promega, Southampton, U.K.) in ABC, covered with 20 µL of ABC, and incubated overnight at 37 °C. Peptides were extracted with 3 × 30 µL 50% ACN in 5% trifluoroacetic acid (TFA). Supernatants were pooled in fresh tubes, concentrated to dryness, and kept at -80 °C until further analysis. Liquid Chromatography–Mass Spectrometry (LC-MS). Peptides from tryptic digests were reconstituted in 0.1% TFA, separated, and analyzed by LC-MS/MS using an Ultimate LC system (Dionex/LC Packings, Amsterdam, The Netherlands)
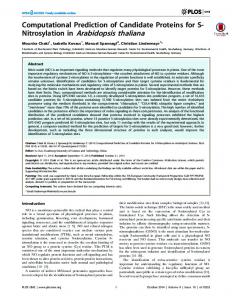
coupled to a HCT ion trap (Bruker Daltonics, Bremen, Germany) or LC-MS using an identical LC system coupled to a 7 T Apex-Qe FTICR mass spectrometer (Bruker Daltonics). Both LC systems were configured with a 10 mm × 300 µm C18 trap column (Dionex) and a 15 cm × 75 µm PepMap C18 analytical column (Dionex) with 3.5 µm particles. Gradients were formed from 2% ACN in H2O (A) and 90% ACN in H2O (B), both with 0.1% formic acid, using a flow rate over the column of 300 nL/ min. The columns were equilibrated for at least 15 min in 2% ACN before sample loading and desalting on the trap column for 5 min. Samples were then injected onto the analytical column and separated using a stepwise linear gradient starting at 0% B for 5 min and then increasing from 0 to 40% B in 85 min and from 40% to 55% B in 15 min. The LC systems were controlled through HyStar versions 3.1 and 3.2 (Bruker). The mass spectrometers were controlled from esquireControl 5.3 (HCT ion trap) and apexControl 1.0 (FTICR), respectively. Mass spectra were acquired in the HCT from m/z 200 to 2000 using parameters optimized at m/z 800 with the trap ion charge control set at 100 000 and a maximum acquisition time of 150 ms, averaging three scans per spectrum. The three most abundant ions were selected for MS/MS but dynamically excluded for 30 s after having been selected twice. FTICR LC-MS data were acquired from m/z 280 to 2500, averaging four spectra (13.7 s/spectrum), with the same gradient. Bruker DataAnalysis 3.4 was used to create peak lists from raw data (see the Supporting Information for parameters and automation script). The LC-MS/MS data was searched against the UniProtKB A. thaliana database with Mascot 2.1 (Matrix Science, London, U.K.) for peptide/protein identification, and the resulting files were converted to pepXML using Mascot2XML.11 The FTICR LC-MS data were converted to mzXML using compassXport (Bruker) and aligned with the LC-MS/MS data using common peptides confidently identified by MS/MS in the ion trap and accurate mass from the FTICR LC-MS data using a genetic algorithm to fit a piecewise linear function to these common peptides9 (www.ms-utils.org/msalign). The peptide and protein identifications were validated using PeptideProphet12 and ProteinProphet,13 and the multiplex quantitation was compared with XPRESS14 using 14N and fully 15N-labeled proteins. The XPRESS results were used without manual examination and adjustment of chromatographic peaks. The actual levels of incorporated 15N were determined by least-squares fitting of calculated distributions to five confidently identified RuBisCO peptides in spectra with signal-to-noise > 100 by adopting an algorithm previously used for determining 2H incorporation.15 Multiplexed Relative Quantitation. Deconvoluting overlapping known isotopic distributions is straightforward. For each identified peptide (Figure 1b), the measured isotopic envelope (Figure 1c) can be represented by a vector x of relative intensities
()
x1 x2 x) , l xm
m
∑ x ) 1, x ∈ [0, 1] i
i
(1)
i)1
where m is the maximum number of detectable isotopic peaks in the envelope. For tryptic peptides, m ) 40 is sufficient in practice but m could also be a function of the size of the peptide (or the number of nitrogen atoms in the peptide). To allow for the detection of overlapping species, masses from -3 to +36 Da relative to the monoisotopic (14N) peak are included Journal of Proteome Research • Vol. 7, No. 2, 2008 781
technical notes
Palmblad et al.
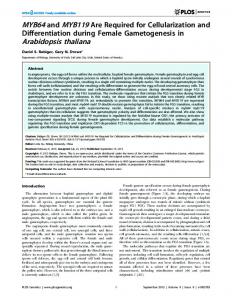
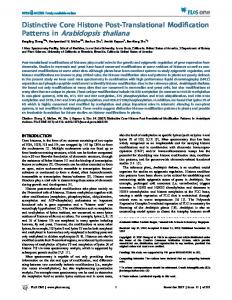
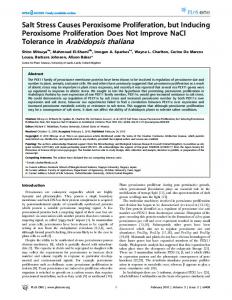
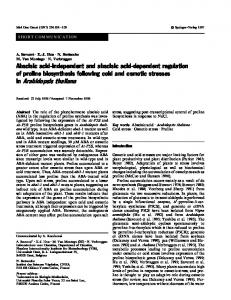
Figure 2. Three FTICR mass spectra of Hsp70 peptides unique to this protein. The distributions extracted using accurate mass are indicated by crosses, and the fit by eq 4 is indicated by circles. The excluded peaks in c are only 0.06 Da from what the highly 15 N-labeled peptides belonging to this isotopic envelope would be, a difference that would be difficult to resolve by ion trap mass spectrometry. Figure 1. All peptide identifications are based on ion-trap LC-MS/ MS data. The monoisotopic peak at m/z 872.9 in a (/) was selected for MS/MS (b). Using ∼100 identified peptides, the iontrap LC-MS/MS data set can be confidently aligned with the FTICR LC-MS data set from the same sample. This alignment is used to extract the mass spectrum of the same peptide in the FTICR data set (c). The theoretical isotopic distributions of the identified peptide, here, GFIFGVASSAYQVEGGR from myrosinase (At5g26000), with different levels of 15N are calculated (d) and fit to the isotopic envelope measured by FTICR by leastsquares minimization (e).
in the measured and calculated isotopic envelopes. The theoretical distributions, D (Figure 1d), for the n differentially labeled samples are easily calculated for identified peptides and known levels of heavy isotopes15,16
(
)
d11 d12 · · · d1n m d21 d22 · · · d2n D) , dij ) 1, j ) 1...n, dij ∈ [0, 1], n < m l l l i)1 dm1 dm2 · · · dmn (2) 782
∑
Journal of Proteome Research • Vol. 7, No. 2, 2008
The only unknowns are the relative abundances a of the n samples
()
a1 a2 , a) l an
n
∑ a ) 1, a ∈ [0, 1] i
i
(3)
i)1
The vector of actual relative abundances, amin, is retrieved by least-squares fitting to the measured isotopic envelope, i.e., finding the vector of relative abundances, a, that minimizes the sum of the squared differences between the calculated isotopic envelope, Da, and the measured envelope x (Figure 1e) amin ) arg min(Da - x)T(Da - x) a
(4)
This n-dimensional least-squares minimization is calculated by the modified Golub-Reinsch algorithm17 for singular value decomposition in the GNU scientific library (www.gnu.org/ software/gsl). There are no constraints on amin in this least-
technical notes
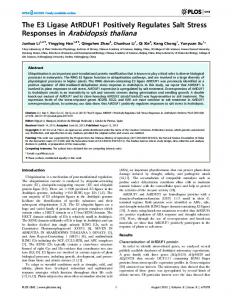
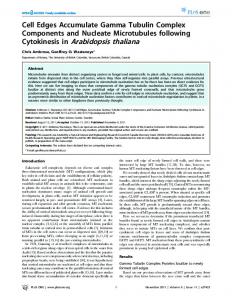
Heat-Shock Response in A. thaliana Table 1. Identified Proteins Induced by Heat Shock UniProt accession
AGI ID
protein name
Q38806 Q9S9N1 P19037 Q9LNW0 Q8H0Z5 Q9ZW31 Q8VYJ7 A0MFA3 O81822 P19036 Q9LHA8 P42730 Q9FJL3 P46422 Q9SKX4 Q9LYG3 Q9LF37 Q9LDZ0 P55737
At4g10250 At1g16030 At5g59720 At1g59860 At5g52640 At2g29500 At2g25140 At4g27670 At5g12030 At3g46230 At3g12580 At1g74310 At5g48570 At4g02520 At2g43030 At5g11670 At5g15450 At5g09590 At5g56030
Hsp22.0-ERd (19.2 kDa) Hsp70b Hsp18.1-CI Hsp17.6A-CI Hsp90 Hsp17.6B-CId (17.3 kDa) ClpB4 heat-shock proteind (102 kDa) Hsp21 Hsp17.7-CIId (18.6 kDa) Hsp17.4-CId (18.6 kDa) Hsp70 Hsp101 peptidyl-prolyl isomerase glutathione S-transferase PM24 50S ribosomal protein L3-1 NADP-malic enzyme 2 ClpB3 heat-shock protein Hsc70-5d (66.2 kDa) Hsp81-2d (79.5 kDa)
Q2V4B7 O65719 Q9ZNZ7 O03042 P22953 Q3EC72
At1g79930 At3g09440 At5g04140 AtCg00490 At5g02500 At2g04030
putative heat-shock protein Hsc70-3 Fd-GOGAT 1 RuBisCO large subunit Hsc70-1 putative heat-shock protein
unique peptides quantitya
unique peptides identityb
XPRESS ratio 4 h/0 hc
1 (1) 4 (3) 2 (2) 2 (0) 2 (1) 1 (1) 1 (0) 2 (0) 1 (1) 1 (1) 5 (3) 5 (3) 4 (3) 3 (2) 3 (1) 4 (3) 3 (3) 1 (1) 1 (1)
1 6 6 2 6 3 2 2 2 1 10 7 6 9 9 6 4 5 10
8.3 6.3 5.7 5.1 4.5 4.3 3.3 3.0 2.9 2.8 2.5 2.2 2.1 1.7 1.7 1.6 1.6 1.5 1.3
4 (3) 4 (3) 22 (3) 16 (3) 6 (3) 7 (3)
11 6 42 31 6 7
1.1 1.0 0.9 0.9 0.9 0.9
muxQuant relative abundance 0h
1h
2h
4h
0.000 0.000 0.000
0.000 0.140 0.000
0.256 0.460 0.232
0.744 0.400 0.768
0.000 0.000
0.204 0.000
0.330 0.345
0.465 0.655
0.000 0.008 0.003 0.000 0.000 0.200 0.138 0.205 0.172 0.167 0.198
0.000 0.248 0.036 0.120 0.004 0.281 0.270 0.221 0.154 0.166 0.245
0.374 0.324 0.373 0.378 0.326 0.206 0.254 0.217 0.310 0.320 0.263
0.626 0.420 0.589 0.502 0.670 0.314 0.338 0.357 0.364 0.347 0.294
0.192 0.182 0.235 0.230 0.214 0.212
0.200 0.279 0.266 0.266 0.227 0.304
0.283 0.256 0.256 0.270 0.260 0.254
0.325 0.284 0.242 0.234 0.299 0.230
a The number of peptides with Mascot ionscore > identityscore unique to this protein within the proteome and used for quantitation (the number within parenthesis is the number of matched peptides in high-quality FTICR data used for multiplexed quantitation; only the three top scoring peptides were used if more than three unique peptides were identified). b The number of different peptides observed for this protein. c The median XPRESS ratio for all peptides with Mascot ionscore > identityscore. d The protein was putatively identified using a single peptide unique to the protein, supported by accurate peptide mass from FTICR and good agreement between apparent (within parentheses) and theoretical molecular weight. The apparent molecular weight was calculated from the gel slice number using a reference curve established from 30 confidently identified proteins (ProteinProphet p > 0.95 and at least two peptides unique to protein) ranging from 14.7 to 193 kDa. See the Supporting Information for individual quantified peptides, Mascot scores, PeptideProphet and ProteinProphet probabilities, and XPRESS and muxQuant ratios with standard errors.
squares minimization, but for data of reasonable quality and D and x as above, all elements of amin are in [0, 1] and their sum is very close to 1. Significant deviation from these values is an indicator of poor data quality, such as overlapping and interfering species or missing isotopic peaks. Relative abundances amin with elements outside [-0.1, 1.1] or with a sum outside [0.9, 1.1] were not included in the calculation of relative protein abundance (the average of relative peptide abundances for each protein). The algorithm was implemented in a C program, muxQuant.
Results and Discussion No phenotypic differences between the plants as a function of level for 15N were observed. The plants had a wilted appearance after 1 h in 38 °C but subsequently recovered their turgescence. The levels of incorporated 15N estimated by the least-squares fit were 0.241 ( 0.010, 0.471 ( 0.006, 0.645 ( 0.013, and 0.988 ( 0.002, respectively. These numbers were used in all calculations of theoretical peptide isotopic distributions. Representative FTICR spectra for an induced heat-shock protein are shown in Figure 2. High resolving power is important for the extraction of the correct isotopic envelope, as can be seen in a and c of Figure 2, where another species is found in the same m/z range. A number of proteins known to be induced by heat stress were also observed to be significantly induced in these heat-shock experiments, for instance, several small heat-shock proteins,18,19 AtFKBP65/ROF2 peptidyl-prolyl cis–trans isomerase (At5g48570),20,21 Hsp101/ClpB1 (At1g74310),
ClpB3 (At5g15450), and ClpB4 (At2g25140) 22,23 and at least two members of the Hsp70 family.24 Table 1 lists all proteins, out of 571 identified in a single experiment with ProteinProphet probability > 0.95, found to be induced by at least a factor 1.5 by XPRESS using at least two peptides unique to the protein in a 1:1 mix of 0% 15N (4 h after heat shock) and 99% 15N (control) analyzed by the ion trap. These ratios are then compared to the abundances at three different times after heat shock from the multiplexed analysis using chromatographically aligned FTICR data, with each time point normalized to the abundant proteins not thought to be involved in heat-shock response. The table also includes all putative and known heatshock proteins uniquely identified and quantified by a single peptide, still with ProteinProphet probability > 0.95 and supported by accurate peptide mass from FTICR (below 5 ppm mass measurement error) and agreement between apparent and theoretical molecular weight of the protein from SDS-PAGE. Only peptides unique to one gene (or database entry) within the entire genome were used for quantitation. The nomenclature for the small heat-shock proteins follows Scharf et al.18 A few proteins not previously associated with heat-shock response were also found to be differentially abundant. The bottom of the table lists heat-shock proteins not found to be induced by XPRESS in these experiments and two of the abundant proteins used for normalization at each time point (after normalization), RuBisCO and Fd-GOGAT 1. The putative heat-shock protein At2g04030 is the only other protein in Table 1 not found to be significantly induced by heat shock after Journal of Proteome Research • Vol. 7, No. 2, 2008 783
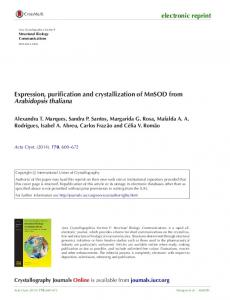
technical notes normalization against abundant proteins and taking measurement uncertainty into account. Quantitation from ion-trap data systematically underestimates ratios much larger than 1. This is due to background and interfering species in the wide m/z window of integration required for reliable XPRESS quantitation using ion trap data (1.0 m/z unit). The average relative standard deviation of peptide ratios for the same protein at maximum was 7% (at most 12%). The results were consistent over the biological replicates, although not all proteins were identified in all replicates. In the set of 571 proteins identified in one 0 and 99% 15N mixture with ProteinProphet probability p > 0.95, the estimated false-positive rate was 0.4% or two false positives. In the quadruplex sample, 267 proteins were identified with p > 0.95, with 0.4% or one false positive. The difference in the number of identified proteins is explained at least in part by signal dilution and unidentifiable tandem mass spectra of the two intermediate levels of 15N in the quadruplex mixture. In theory, the acquisition of tandem mass spectra may be made more efficient by excluding peptides with intermediate levels of 15N or selecting only the most abundant peak in each envelope for MS/MS. The observed dynamics of heat-shock protein expression was found to be consistent with gene expression data by Sung et al.,24 integrating mRNA levels over short times after heat shock (Figure 3). Busch and co-workers have reported that gene expressions for the small heat-shock proteins, Hsp70, Hsp101, and peptidyl-prolyl isomerase, are all induced after 1 h at 37 °C, with very low or zero levels at 22 °C.25 Neither the NADP-malic enzyme (NADP-ME2)26 nor ribosomal protein L3-1 has previously been shown to be induced by heat shock, but NADP-ME2 is known to be induced by osmotic stress27,28 and, interestingly, the expression of the alternative ribosomal protein L3-2 has been found to be suppressed by heat stress in Arabidopsis.29 It can be hypothesized that L3-1 is induced to replace L3-2 at high temperatures. The identified heat-shock proteins can be categorized from this data as constitutive (present at 22 °C), early induced (detected after 1 h at 38 °C but not at 22 °C), and late induced (detected after 2 h but not 1 h at 38 °C). The identified constitutive heat-shock proteins are Hsc70-1, Hsc70-3, Hsc705, Hsp81-2, and putative heat-shock proteins At1g79930 and At2g04030, the early induced Hsp17.4-CI, Hsp70b, Hsp90, and Hsp101, and the late induced Hsp17.7-CII, Hsp18.1-CI, Hsp22.0ER, Hsp17.6B-CI, Hsp70, and peptidyl-prolyl isomerase. Because of the high sequence homology (>99.5% between uniquely identifie,d Hsp81-2 and the subsumed database entries for Hsp81-3 or Hsp81-4) and the number of proteins within the same heat-shock protein family, few of the identified peptides are unique to a specific heat-shock protein. This is an example of the protein inference problem in bottom-up proteomics.30 In the data presented here, only peptides unique to one gene (or database entry) within the entire genome were used for quantitation. Plant heat-shock studies are particularly difficult for bottom-up proteomics in this regard, and the average number of peptides per protein that can be used for quantitation can be expected to be higher in studies not targeting large gene families. Given typical sequence coverage of less than 50%, it is highly likely that other heat-shock proteins are also present. The muxQuant algorithm was tested and found to work also on binary (0 and 98% 15N) and triplex (0, 47, and 98% 15N) quantitation in control experiments (data not shown). None of the proteins in Table 1 were significantly 784
Journal of Proteome Research • Vol. 7, No. 2, 2008
Palmblad et al.
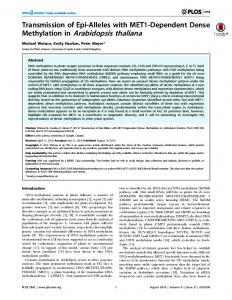
Figure 3. Hsp70b (b) has a faster response than Hsp70 (a) but reaches a plateau before 2 h, whereas the level of Hsp70 continues to increase. This is consistent with the gene expression data in Sung et al.,24 showing a significant reduction in hsp70b expression between 60 and 90 min, whereas hsp70 is still expressed at 90 min. hsc70-1/Hsc70-1 (c) is constitutively expressed at 22 °C and induced by heat shock (relative to abundant proteins, such as RuBisCO). The vast majority of proteins exhibited responses very similar to RuBisCO. The decreased RuBisCO and total protein abundance at 1 h may be explained by the normalization against wet weight and early water uptake (protein dilution) as a response to heat shock.
induced after 4 or 6 h in the dark compared to plants kept in the light in the growth chamber.
Conclusions The results clearly demonstrate that multiplexed quantitative proteomics by differential stable isotope labeling is a powerful technique for comparing a number of similar samples, for instance, protein abundance in an organism as a function of time after stimuli or grown under different conditions. The results confirm predictions from gene expression data but also include several novel findings, for instance, that ribosomal L3-1 can be induced by heat shock and more detailed dynamics of heat-shock protein expression than previously reported. The
technical notes
Heat-Shock Response in A. thaliana maximum number of differentially labeled samples that can be quantified relative to each other is theoretically limited by the number of isotopic peaks above the background (25 for the peptide in Figure 1), but it remains to be shown if the multiplexing method is robust and practical for n much larger than 4. However, even quadruplex quantitation simplifies studies of dynamics of protein expression, as in the heat-shock experiment described here and the previously reported study of protein expression over the cell cycle, labeling HeLa cells arrested in M, G1, S, and G2 phase with four different iTRAQ reagents, respectively.31 Multiplexing using uniform metabolic labeling with varying isotope ratios is attractive because it is (1) inexpensive, (2) simple (no labeling chemistry), and (3) precise (independent of reproducibility of protein extraction and separation). The algorithm described in this paper is applicable to any stable isotope or combination of isotopes, such as amino acids labeled with both 13C and 15N, and any species for which metabolic labeling and proteomic analyses are feasible. An implementation of the algorithm is freely available under the Creative Commons license on www. ms-utils.org/muxQuant/, along with a tutorial and sample data.
(10) (11) (12)
(13) (14)
(15)
(16) (17) (18)
Acknowledgment. The authors thank Professor Rainer Cramer for inspiration and support and Professor Charles Guy at the University of Florida for kindly providing RT-PCR data and insightful comments on heat-shock response in plants.
Supporting Information Available: Individual quantified peptides, Mascot scores, PeptideProphet and ProteinProphet probabilities, and XPRESS and muxQuant ratios with standard errors. This material is available free of charge via the Internet at http://pubs.acs.org.
(19) (20) (21)
(22)
References (1) Stemmann, O.; Zou, H.; Gerber, S. A.; Gygi, S. P.; Kirschner, M. W. Dual inhibition of sister chromatid separation at metaphase. Cell 2001, 107 (6), 715–726. (2) Gygi, S. P.; Rist, B.; Gerber, S. A.; Turecek, F.; Gelb, M. H.; Aebersold, R. Quantitative analysis of complex protein mixtures using isotope-coded affinity tags. Nat. Biotechnol. 1999, 17 (10), 994–999. (3) Yi, E. C.; Li, X. J.; Cooke, K.; Lee, H.; Raught, B.; Page, A.; Aneliunas, V.; Hieter, P.; Goodlett, D. R.; Aebersold, R. Increased quantitative proteome coverage with13C/12C-based, acid-cleavable isotopecoded affinity tag reagent and modified data acquisition scheme. Proteomics 2005, 5 (2), 380–387. (4) Ong, S. E.; Blagoev, B.; Kratchmarova, I.; Kristensen, D. B.; Steen, H.; Pandey, A.; Mann, M. Stable isotope labeling by amino acids in cell culture, SILAC, as a simple and accurate approach to expression proteomics. Mol. Cell. Proteomics 2002, 1 (5), 376–386. (5) Schmidt, A.; Kellermann, J.; Lottspeich, F. A novel strategy for quantitative proteomics using isotope-coded protein labels. Proteomics 2005, 5 (1), 4–15. (6) Ross, P. L.; Huang, Y. N.; Marchese, J. N.; Williamson, B.; Parker, K.; Hattan, S.; Khainovski, N.; Pillai, S.; Dey, S.; Daniels, S.; Purkayastha, S.; Juhasz, P.; Martin, S.; Bartlet-Jones, M.; He, F.; Jacobson, A.; Pappin, D. J. Multiplexed protein quantitation in Saccharomyces cerevisiae using amine-reactive isobaric tagging reagents. Mol. Cell. Proteomics 2004, 3 (12), 1154–1169. (7) Engelsberger, W. R.; Erban, A.; Kopka, J.; Schulze, W. X. Metabolic labeling of plant cell cultures with K15NO3 as a tool for quantitative analysis of proteins and metabolites. Plant Methods 2006, 2, 14. (8) Ippel, J. H.; Pouvreau, L.; Kroef, T.; Gruppen, H.; Versteeg, G.; van den Putten, P.; Struik, P. C.; van Mierlo, C. P. In vivo uniform15Nisotope labelling of plants: Using the greenhouse for structural proteomics. Proteomics 2004, 4 (1), 226–234. (9) Palmblad, M.; Mills, D. J.; Bindschedler, L. V.; Cramer, R. Chromatographic alignment of LC-MS and LC-MS/MS datasets by
(23)
(24) (25) (26)
(27)
(28)
(29) (30) (31)
genetic algorithm feature extraction. J. Am. Soc. Mass Spectrom. 2007, 18 (10), 1835–1843. Kotak, S.; Larkindale, J.; Lee, U.; von Koskull-Doring, P.; Vierling, E.; Scharf, K. D. Complexity of the heat stress response in plants. Curr. Opin. Plant Biol. 2007, 10 (3), 310–316. Keller, A.; Eng, J.; Zhang, N.; Li, X. J.; Aebersold, R. A uniform proteomics MS/MS analysis platform utilizing open XML file formats. Mol. Syst. Biol. 2005, 1, 2005.0017. Keller, A.; Nesvizhskii, A. I.; Kolker, E.; Aebersold, R. Empirical statistical model to estimate the accuracy of peptide identifications made by MS/MS and database search. Anal. Chem. 2002, 74 (20), 5383–5392. Nesvizhskii, A. I.; Keller, A.; Kolker, E.; Aebersold, R. A statistical model for identifying proteins by tandem mass spectrometry. Anal. Chem. 2003, 75 (17), 4646–4658. Han, D. K.; Eng, J.; Zhou, H.; Aebersold, R. Quantitative profiling of differentiation-induced microsomal proteins using isotopecoded affinity tags and mass spectrometry. Nat. Biotechnol. 2001, 19 (10), 946–951. Palmblad, M.; Buijs, J.; Håkansson, P. Automatic analysis of hydrogen/deuterium exchange mass spectra of peptides and proteins using calculations of isotopic distributions. J. Am. Soc. Mass Spectrom. 2001, 12 (11), 1153–1162. Rockwood, A. L.; Van Orden, S. L. Ultrahigh-speed calculation of isotope distributions. Anal. Chem. 1996, 68, 2027–2030. Golub, G. H.; Reinsch, C. Singular value decomposition and least squares solutions. Numer. Math. 1970, 14, 403–420. Scharf, K. D.; Siddique, M.; Vierling, E. The expanding family of Arabidopsis thaliana small heat stress proteins and a new family of proteins containing R-crystallin domains (Acd proteins). Cell Stress Chaperones 2001, 6 (3), 225–37. Nakamoto, H.; Vigh, L. The small heat shock proteins and their clients. Cell. Mol. Life Sci. 2007, 64 (3), 294–306. He, Z.; Li, L.; Luan, S. Immunophilins and parvulins. Superfamily of peptidyl prolyl isomerases in Arabidopsis. Plant Physiol. 2004, 134 (4), 1248–1267. Aviezer-Hagai, K.; Skovorodnikova, J.; Galigniana, M.; FarchiPisanty, O.; Maayan, E.; Bocovza, S.; Efrat, Y.; von Koskull-Doring, P.; Ohad, N.; Breiman, A. Arabidopsis immunophilins ROF1 (AtFKBP62) and ROF2 (AtFKBP65) exhibit tissue specificity, are heat-stress induced, and bind HSP90. Plant Mol. Biol. 2007, 63 (2), 237–255. Queitsch, C.; Hong, S. W.; Vierling, E.; Lindquist, S. Heat shock protein 101 plays a crucial role in thermotolerance in Arabidopsis. Plant Cell 2000, 12 (4), 479–492. Lee, U.; Rioflorido, I.; Hong, S. W.; Larkindale, J.; Waters, E. R.; Vierling, E. The Arabidopsis ClpB/Hsp100 family of proteins: Chaperones for stress and chloroplast development. Plant J. 2007, 49 (1), 115–127. Sung, D. Y.; Vierling, E.; Guy, C. L. Comprehensive expression profile analysis of the Arabidopsis Hsp70 gene family. Plant Physiol. 2001, 126 (2), 789–800. Busch, W.; Wunderlich, M.; Schoffl, F. Identification of novel heat shock factor-dependent genes and biochemical pathways in Arabidopsis thaliana. Plant J. 2005, 41 (1), 1–14. Wheeler, M. C.; Tronconi, M. A.; Drincovich, M. F.; Andreo, C. S.; Flugge, U. I.; Maurino, V. G. A comprehensive analysis of the NADP-malic enzyme gene family of Arabidopsis. Plant Physiol. 2005, 139 (1), 39–51. Cushman, J. C. Characterization and expression of a NADP-malic enzyme cDNA induced by salt stress from the facultative crassulacean acid metabolism plant, Mesembryanthemum crystallinum. Eur. J. Biochem. 1992, 208 (2), 259–266. Liu, S.; Cheng, Y.; Zhang, X.; Guan, Q.; Nishiuchi, S.; Hase, K.; Takano, T. Expression of an NADP-malic enzyme gene in rice (Oryza sativa L.) is induced by environmental stresses; overexpression of the gene in Arabidopsis confers salt and osmotic stress tolerance. Plant Mol. Biol. 2007, 64 (1–2), 49–58. Tilley, M. R. Inheritance and gene regulation in a ribosomal protein gene family of Arabidopsis thaliana. Ph.D. Dissertation, The Ohio State University, Columbus, OH, 2004. Nesvizhskii, A. I.; Aebersold, R. Interpretation of shotgun proteomic data: The protein inference problem. Mol. Cell. Proteomics 2005, 4 (10), 1419–1440. Pappin, D.; Jebanathiraja, J.; Steen, H.; Kirschner, M.; Ross, P.; Hattan, S. In Cell Cycle Proteomics Using Quantitative Mass Spectrometry; The American Society for Biochemistry and Molecular Biology, Inc.: San Francisco, CA, 2005; p S432.
PR0705340
Journal of Proteome Research • Vol. 7, No. 2, 2008 785