materials Article
Heat Transfer Performance of Functionalized Graphene Nanoplatelet Aqueous Nanofluids Roberto Agromayor 1 , David Cabaleiro 2 , Angel A. Pardinas 1 , Javier P. Vallejo 1,2 , Jose Fernandez-Seara 1 and Luis Lugo 2, * 1
2
*
Área de Máquinas y Motores Térmicos, Escola de Enxeñería Industrial, Universidade de Vigo, Vigo E-36310, Spain;
[email protected] (R.A.);
[email protected] (A.A.P.);
[email protected] (J.P.V.);
[email protected] (J.F.-S.) Departamento de Física Aplicada, Facultade de Ciencias, Universidade de Vigo, Vigo E-36310, Spain;
[email protected] Correspondence:
[email protected]; Tel.: +34-986-813-771
Academic Editor: Deepak Pant Received: 29 April 2016; Accepted: 31 May 2016; Published: 8 June 2016
Abstract: The low thermal conductivity of fluids used in many industrial applications is one of the primary limitations in the development of more efficient heat transfer systems. A promising solution to this problem is the suspension of nanoparticles with high thermal conductivities in a base fluid. These suspensions, known as nanofluids, have great potential for enhancing heat transfer. The heat transfer enhancement of sulfonic acid-functionalized graphene nanoplatelet water-based nanofluids is addressed in this work. A new experimental setup was designed for this purpose. Convection coefficients, pressure drops, and thermophysical properties of various nanofluids at different concentrations were measured for several operational conditions and the results are compared with those of pure water. Enhancements in thermal conductivity and in convection heat transfer coefficient reach 12% (1 wt %) and 32% (0.5 wt %), respectively. New correlations capable of predicting the Nusselt number and the friction factor of this kind of nanofluid as a function of other dimensionless quantities are developed. In addition, thermal performance factors are obtained from the experimental convection coefficient and pressure drop data in order to assess the convenience of replacing the base fluid with designed nanofluids. Keywords: heat transfer coefficient; nanofluid; graphene nanoplatelets; pressure drop
1. Introduction Energy is one of the most valuable resources in our society and, therefore, during the last years, many efforts have been made to increase energy efficiency and encourage the use of renewable energies. A wide variety of applications, such as those involved in the field of solar and geothermal energy, entails thermal energy transference from one fluid to another. Thus, heat management has emerged as one of the fields with the highest potential to improve thermal performance. In order to develop more efficient and compact heat transfer equipment, many heat transfer enhancement techniques have arisen since the mid-twentieth century. However, the low thermal conductivity of the fluids commonly used in industrial applications, such as water or glycols, has hindered any heat transfer enhancement. To overcome this problem, several authors have suggested the use of fluids with improved thermal properties. Based on the fact that solids exhibit thermal conductivities various orders of magnitude larger than conventional heat transfer industrial fluids, in the last decades of the 20th century some researchers proposed enhancing the thermal properties of fluids by dispersing millimetric and micrometric high-conductivity solid particles. Despite the thermal conductivity of these mixtures improving
Materials 2016, 9, 455; doi:10.3390/ma9060455
www.mdpi.com/journal/materials
Materials 2016, 9, 455
2 of 18
significantly with the addition of solid particles, these dispersions present multiple drawbacks that limit their use in industrial applications. Some of these problems are the erosion of heat transfer equipment, the sedimentation of the solid particles, or the huge increase of pressure drop associated with the higher viscosity in relation to the base fluid. Thus, the addition of solid particles was rejected as a heat enhancement alternative until the last years of the 20th century, when advances in materials science allowed the large-scale production of much smaller solid particles. In 1995, Choi and Eastman [1] resumed previous investigations about the increase of thermal conductivity through the addition of nanometric solid particles to base fluids. These samples, which they named nanofluids, have higher thermal conductivities than the initial base fluids and also lack the problems of the dispersions with millimetric and micrometric particles. Due to the small size of nanoparticles, heat transfer systems are not worn away and the sedimentation is much slower. Moreover, for small concentrations of nanoparticles, pressure drop increases are marginal compared with those of the base fluid [2,3]. The number of experimental studies and publications related to the heat transfer characteristics of nanofluids has increased exponentially in recent years [4–7]. Among the commonly used base fluids, water is one of the most widespread in heat exchange processes. For this reason, many water-based nanofluid studies have been carried out lately [8–10]. Despite the fact that nanofluids are two-phase systems (solid and liquid phases), many authors such as Pak and Cho [11], Xuan and Li [7], and Fard et al. [12] agree that their behavior is similar to that of a pure substance with increased thermal properties. In this work, the nanofluids studied are considered as a single-phase system. This approach assumes that the fluid phase and the nanoparticles are in thermal equilibrium and there is no slip in velocity between the base fluid and the solid particles. Nanoparticles of different materials such as metals, metallic oxides, and carbon nanostructures have been employed to prepare nanofluids with enhanced thermal properties for many different applications in areas like thermal engineering, renewable energies, or medicine [13–15]. The two-dimensional structure of graphene, as a single-atom-thick nanosheet of sp2-bonded carbon atoms packed into a honeycomb lattice, exhibits a higher potential than other nanostructured carbon allotropes, such as one-dimensional nanotubes or zero-dimensional fullerenes [16]. Thus, graphene combines the advantages of highly ordered graphitic carbonhigh stability, abundance in source, and low cost—with the single-layer benefits of in-plane thermal conductivity as high as 3000 to 5000 W¨ m´1 ¨ K´1 [16–18]. Although graphene is hydrophobic and, consequently, cannot be dispersed in water for a long time without agglomerating [19], stable dispersions in aqueous/organic solvents can be prepared once the material has been functionalized (using an acid treatment or amino function) by means of proper sonication [20–22]. Yarmand et al. [22] stated that water nanofluids based on functionalized graphene nanoplatelets and silver (up to 0.1 wt %) are stable without the assistance of surfactants or ultrasonication. Most of the studies about nanofluids focus on the analysis of their physical properties, both from an experimental and a theoretical point of view. The properties that play a major role in convection heat transfer are density, specific heat capacity, thermal conductivity, and viscosity. Although density and specific heat capacity can be easily predicted from a theoretical approach, thermal conductivity and viscosity must be carefully determined because there are not yet models that can accurately predict the transport properties of nanofluids [23,24]. Over the last years, several studies about the thermophysical and heat transfer performance of graphene nanoplatelet aqueous nanofluids have been reported in the literature [22,25–30]. However, most of them only analyze the effect of nanoplatelet addition at low mass concentrations. Thus, regarding thermophysical characterization, only Gupta et al. [25] and Hajjar et al. [26] reached 0.25 wt %, while Yu et al. [27] studied from 1 to 5 vol %. Forced convection heat transfer is a complex phenomenon that combines velocity and temperature profiles, as well as the thermal properties of the fluid. Significant heat transfer enhancements are expected with the addition of high-conductivity nanometric particles. The increase of the effective thermal conductivity of the fluid is not the only factor that accelerates the heat transfer process [31]. The presence of these solid particles also increases the fluctuation and turbulence of nanofluids, further
Materials 2016, 9, 455
3 of 18
enhancing the heat transfer process. The increase of turbulence causes temperature gradients within the fluid to be reduced and the boundary layers to become thinner where transport phenomena are slower. Similarly, thanks to the small size of the solid particles, the increase of the pressure drop with respect to the base fluid is minimal. These characteristics of the fluid flow and heat transfer of nanofluids were also discussed by Xuan and Li [9]. Consequently, greater energy exchanges between the fluid and the solid walls of heat transfer equipment can be achieved for the same pumping power input. This is the reason why the use of nanofluids is one alternative with high potential for improving the energy efficiency of heat transfer processes. One of the current trends consists of the study of the effects and potential benefits resulting from the application of magnetic fields in heat transfer processes with nanofluids [10,32–36]. A difficulty faced when studying nanofluids is that the conventional heat transfer coefficient correlations of pure substances fail to predict their thermal behavior, even if the measured transport properties of the nanofluids are used in the calculations. This problem was previously reported by Xuan and Li [9], among others. It is caused by the presence of moving solid particles that modify the velocity and temperature profiles of the flow with respect to those of pure substances. Thus, new correlations that account for the presence of solid particles must be explored in order to quantitatively describe the thermal behavior of nanofluids. The aim of this paper is to study the single-phase flow and thermal behavior of different sulfonic acid-functionalized graphene nanoplatelet aqueous nanofluids from an experimental point of view. Nanoplatelets and nanofluids are thermophysically characterized, and the heat transfer by forced convection is studied for different nanoparticle concentrations using a new device. The main results are discussed and compared with those obtained for water at the same operating conditions to investigate the heat transfer enhancement. Finally, new correlations to calculate the Nusselt number and the Darcy friction factor of this kind of nanofluids are proposed. 2. Nanofluid Characterization 2.1. Material and Sample Preparation Graphene nanoplatelets (GnPs) were provided by NanoInnova Technologies S.L. (Madrid, Spain) while Milli Q-Grade water was produced with a resistivity of 18.2 MΩ¨ cm by means of a Millipore system Milli-Q 185 Plus (Millipore Ltd., Watford, UK). Nanofluids were designed through a two-step method as dispersions of sulfonic acid-functionalized graphene nanoplatelets at nanoadditive mass concentrations of 0.25, 0.50, 0.75, and 1.00 wt % in water, which correspond to volume fractions of 0.19, 0.39, 0.59, and 0.79 vol %, respectively. The desired concentrations were prepared by weighing the powder in a Mettler AE-200 (Mettler Toledo, Greifensee, Switzerland), with an uncertainty of 10–4 g, and then stirring it into a predetermined volume of base fluid for 120 min. Afterwards, the suspensions were sonicated for 240 min by using an ultrasonic bath (Ultrasounds, JP Selecta S.A., Barcelona, Spain) operating at a sonication frequency of 20 kHz, with a maximum power output of 200 W. 2.2. Nanopowder Characterization The morphology of the dry sulfonic acid-functionalized graphene nanopowder was analyzed through scanning electron microscopy by using a JEOL JSM-6700F field emission gun-SEM (JEOL, Tokyo, Japan) working at an accelerator voltage of 20 kV in backscattering electron image (Yttrium Aluminum Garnet type detector). This device is coupled to an energy dispersive X-ray (EDS) spectrometer Oxford Inca Energy 300 SEM (Oxford Instruments, Oxford, UK), which also allows for carrying out chemical microanalyses of the sample. SEM samples were prepared by depositing a drop of the nanopowder dispersed in analytical grade methanol (Sigma-Aldrich, Madrid, Spain) on the top of a silica support and drying under atmospheric conditions. Figures 1 and 2 show the SEM image and EDS microanalysis of the studied GnP sample, respectively. Sulfonic acid-functionalized graphene exhibits a nanoplatelet-shape of up to some micrometers with wrinkled surfaces folding at the edges (Figure 1). The EDS spectrum shows the presence of carbon (C), oxygen (O), sulfur (S), and silica (Si), this last being due to impurities of physical support (Figure 2).
Materials 2016, 9, 455
4 of 18
Materials 2016, 9, 455
4 of 19
Materials 2016, 9, 455
4 of 19
Figure 1. SEM image of sulfonic acid-functionalized graphene nanoplatelets at 3000× magnification. Figure 1. SEM image of sulfonic acid-functionalized graphene nanoplatelets at 3000ˆ magnification. Figure 1. SEM image of sulfonic acid-functionalized graphene nanoplatelets at 3000× magnification.
(a)(a)
(b)(b)
Figure 2. EDS microanalysis of sulfonic acid-functionalized graphene nanoplatelets: (a) studied area;
Figure 2. EDS microanalysis of sulfonic acid-functionalized graphene nanoplatelets: (a) (a) studied studied area; area; (b) EDS spectrum. (b) EDS spectrum.
2.3. Thermophysical Characterization
2.3. Thermophysical Characterization 2.3. Thermophysical Characterization
Regarding the thermophysical properties of the base fluid, those values from REFPROP [37] Regarding thethermophysical thermophysical properties fluid, those values REFPROP [37] were considered. Concerning theproperties dry GnP sample, thebase specific heat capacity wasfrom experimentally Regarding the of of thethe base fluid, those values from REFPROP [37] were were considered. Concerning the dry GnP sample, the specific heat capacity was experimentally determined in this work by a quasi-isothermal temperature-modulated differential scanning considered. Concerning the dry GnP sample, the specific heat capacity was experimentally determined calorimetry (TDMSC) a heat-flux differential scanning calorimeter, DSC, Q2000 (TA determined in method work by ausing quasi-isothermal temperature-modulated scanning in this work by athis quasi-isothermal temperature-modulated differential scanningdifferential calorimetry method −3 Instruments, New(TDMSC) Castel, DE, USA) [38]. Otherwise, a density valuecalorimeter, of 1.27 g·cm forQ2000 GnP (TA calorimetry method using a heat-flux differential scanning DSC, (TDMSC) using a heat-flux differential scanning calorimeter, DSC, Q2000 (TA Instruments, New Castel, nanopowder wasCastel, used. In thisUSA) work,[38]. the densities, ρ, and specific value heat capacities, cp, of−3 GnP Instruments, DE, Otherwise, a GnP density of was 1.27used. g·cm for work, GnP DE, USA) [38].New Otherwise, a density value of 1.27 g¨ cm´3 for nanopowder In this nanofluids were obtained using the following weighted average equations [38]:
nanopowder was In heat this capacities, work, thecpdensities, ρ, and specific heat capacities, , of GnP the densities, ρ, andused. specific , of GnP nanofluids were obtained using thecpfollowing nf v weighted GnP 1 average v bf equations [38]: (1) nanofluids were obtained using the following weighted average equations [38]:
1 m v c p bfbf GnP 1 cp nfnf mv cp GnP
ρn f “ φv ˆ ρGnP ` p1 ´ φv q ˆ ρb f
(2)
(1) (1)
where φv is the nanoadditive volume is the fraction, and the nf, GnP, 1 m c pmass c p nf fraction, m φ c mp GnP nanoadditive (2) bf and bf subscripts stand for nanofluid, nanoplatelets, fluid, respectively. Obtained (2) c pnf “graphene φm ˆ c pGnP ` p1 ´ φm qand ˆ cbase pbf values density and specific heat capacity fluids in the temperature range from where φv isfor thethe nanoadditive volume fraction, φmofisthe thestudied nanoadditive mass fraction, and the nf, GnP, where ϕ is °C theare nanoadditive volume fraction, ϕm in is Figures the nanoadditive mass fraction, and the nf, GnP, v 40 20 to plotted together with the base fluid 3 and 4, respectively. Density increases and bf subscripts stand for nanofluid, graphene nanoplatelets, and base fluid, respectively. Obtained and bf subscripts stand for nanofluid, graphene nanoplatelets, and base fluid, respectively. Obtained with graphene concentration, whereas contrary heat capacity. values forincreasing the density and specific heat capacity ofthe the studiedoccurs fluidsforinthe thespecific temperature range from values for the density and specific heat capacity of the studied fluids in the temperature range Modifications in the mentioned properties as regards the base fluid overall analyzed conditions are from 20 to 40 ˝°C are plotted together with the base fluid in Figures 3 and 4, respectively. Density increases for ρtogether and 0.8%with for cthe p. 20 tolower 40 Cthan are 0.2% plotted base fluid in Figures 3 and 4, respectively. Density increases
with increasing graphene concentration, whereas the contrary occurs for the specific heat capacity. with increasing graphene concentration, whereas the contrary occurs for the specific heat capacity. Modifications in the mentioned properties as regards the base fluid overall analyzed conditions are Modifications in the mentioned properties as regards the base fluid overall analyzed conditions are lower than 0.2% for ρ and 0.8% for cp. lower than 0.2% for ρ and 0.8% for cp .
Materials 2016, 9, 455 Materials 2016, 9, 455 Materials 2016, 9, 455
5 of 18 5 of 19 5 of 19
Figure 3. 3. Density of of the sulfonic sulfonic acid-functionalized graphene graphene nanoplatelet water-based water-based nanofluids Figure Figure 3.Density Density ofthe the sulfonicacid-functionalized acid-functionalized graphenenanoplatelet nanoplatelet water-basednanofluids nanofluids and water [37]. and andwater water[37]. [37].
Figure 4. Specific heat capacity of the sulfonic acid-functionalized graphene nanoplatelet water-based Figure4. 4. Specific Specific heat heat capacity capacity of of the the sulfonic sulfonic acid-functionalized acid-functionalized graphene graphene nanoplatelet nanoplateletwater-based water-based Figure nanofluids and water [37]. nanofluidsand andwater water[37]. [37]. nanofluids
Effective thermal conductivities, k, were experimentally measured in this work from 20 to 40 °C Effective thermal conductivities, k, were experimentally measured in this work from 20 to 40˝°C Effective k, were experimentally measured in this work from 20 to 40 C by means of athermal KD2 Proconductivities, thermal analyzer (Decagon Devices, Inc., Pullman, WA, USA) together with by means of a KD2 Pro thermal analyzer (Decagon Devices, Inc., Pullman, WA, USA) together with by means of a KD2 thermal analyzer (Decagon Devices, Inc.,toPullman, USA)the together with a a KS-1 probe of 1.3Pro mm diameter and 60 mm long. In order preciselyWA, control temperature, a KS-1 probe of 1.3 mm diameter and 60 mm long. In order to precisely control the temperature, KS-1 probe of 1.3 mmimmersed diameter in and 60 mmGP200 long. In orderInstruments, to precisely control the temperature, samples samples were fully a Grant (Grant Cambridge, UK) oil bath. More samples were fully immersed in a Grant GP200 (Grant Instruments, Cambridge, UK) oil bath. More were fully immersed in a Grant GP200 (Grant Instruments, Cambridge, UK) oil bath. More details details about the experimental device and measurement procedure can be found in previous works details about the experimental device and measurement procedure can be found in previous works about theThe experimental device and measurement procedure can beof found in previous works [39–41]. [39–41]. temperature dependence of the thermal conductivity the base fluid and the different [39–41]. The temperature dependence of the thermal conductivity of the base fluid and the different The of the conductivity of the base fluidconcentration and the different GnP GnPtemperature nanofluids isdependence shown in Figure 5. thermal This property rises as the nanoplatelet increases, GnP nanofluids is shown in Figure 5. This property rises as the nanoplatelet concentration increases, nanofluids is shown Figure property rises being 12% greater forinthe 1.00 5. wtThis % nanofluid than as forthe thenanoplatelet base fluid. concentration increases, being being 12% greater for the 1.00 wt % nanofluid than for the base fluid. 12% greater 1.00 wtviscosities % nanofluid thanfluid for the base fluid. Finally,for thethe dynamic of the samples were determined in the temperature range Finally, the dynamic viscosities of the fluid samples were determined in the temperature range Finally, the dynamic viscosities of the fluid samples determined in thePaar, temperature range between 20 and 40 °C by using a rotational Physica MCRwere 101 rheometer (Anton Graz, Austria) between 20 and 40 ˝°C by using a rotational Physica MCR 101 rheometer (Anton Paar, Graz, Austria) between anda40cone-plate C by using a rotational MCR of 101 (Anton Graz, Austria) equipped20with geometry with Physica a cone angle 1°rheometer and a diameter ofPaar, 25 mm [2,41]. Both equipped with a cone-plate geometry with a cone angle of 1° and a diameter of 25 mm [2,41]. Both equipped a cone-plate geometry with behavior a cone angle 1˝ andconcentration a diameter of 25 mm [2,41]. nanofluidswith and base fluid exhibit Newtonian in theofstudied range. Obtained nanofluids and base fluid exhibit Newtonian behavior in the studied concentration range. Obtained Both and in base fluid6 exhibit Newtonian in the studied concentration range. valuesnanofluids are presented Figure as a function of thebehavior temperature, where a remarkable increase in values are presented in Figure 6 as a function of the temperature, where a remarkable increase in Obtained values presented in Figure 6 as a function of the temperature, where a remarkable viscosity with theare mass concentration can be seen. viscosity with the mass concentration can be seen. increase in viscosity with the mass concentration can be seen.
Materials 2016, 9, 455 Materials 2016, 9, 455
6 of 19
Materials 2016, 9, 455
6 of 19
6 of 18
Figure Thermal conductivityofofthe thesulfonic sulfonic acid-functionalized acid-functionalized graphene water-based Figure 5. 5. Thermal conductivity graphenenanoplatelet nanoplatelet water-based nanofluids and water [37]. Figure 5. and Thermal conductivity of the sulfonic acid-functionalized graphene nanoplatelet water-based nanofluids water [37]. nanofluids and water [37].
Figure 6. Viscosity of the sulfonic acid-functionalized graphene nanoplatelet water-based nanofluids and water [37]. Figure 6. Viscosity thesulfonic sulfonicacid-functionalized acid-functionalized graphene graphene nanoplatelet Figure 6. Viscosity ofof the nanoplateletwater-based water-basednanofluids nanofluids and water [37]. and water [37].
3. Heat Transfer Coefficient Determination
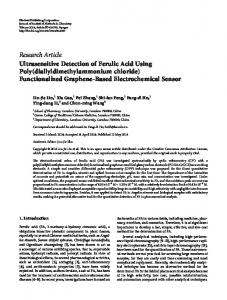
3. Heat Transfer Coefficient Determination 3. 3.1. Heat Transfer Coefficient Experimental Equipment Determination 3.1. Experimental Equipment The new experimental 3.1. Experimental Equipment facility is composed of two closed loops, using the tested fluid and hot waterThe as working fluids, andfacility an open refrigeration loop.closed The layout the experimental equipment new experimental is composed of two loops,ofusing the tested fluid and hot The new experimental facility is composed of two closed loops, using theoftested fluid and hot and the location of the devices used are shown in Figure 7. The main section the experimental water as working fluids, and an open refrigeration loop. The layout of the experimental equipment water as workingheat fluids, and an open refrigeration loop. Theconsists layout of of athe experimental equipment facility, and pressure drop are studied, stainless tube-in-tube and the where location of exchange the devices used are shown in Figure 7. The main section of steel the experimental and the location of the devices used are shown in Figure 7. The main section of the experimental heat exchanger withexchange lengths of 930 mm and 1180 for the test sections of effective heating and facility, where heat and pressure drop aremm studied, consists of a stainless steel tube-in-tube facility, where heat exchange pressure drop aremm studied, consists of a stainless tube-in-tube pressure drop, respectively. The tested is1180 pumped through thesections inner tube and steel is heated by and hot heat exchanger with lengthsand of 930 mmfluid and for the test of effective heating heat exchanger with lengths of 930 mm and 1180 mm for the test sections of effective heating and water from the other closed loop, which flows within the annular section. The internal tube has an pressure drop, respectively. The tested fluid is pumped through the inner tube and is heated by hot pressure drop, respectively. The tested fluid is pumped through the inner tube and is heated by hot inner diameter of 8 mm and an outer diameter of 10 mm, while the outer tube has an inner diameter water from the other closed loop, which flows within the annular section. The internal tube has an of 15 mm. The test section was insulated to minimize the heat losses to the environment, which were water from the other closed loop, which flows within the annular section. The internal tube has inner diameter of 8 mm and an outer diameter of 10 mm, while the outer tube has an inner diameteran estimated to of betest thanwas ofdiameter the total heat even forouter the most unfavorable operating inner diameter 8lower mm and an0.5% outer of 10 transfer mm, the tube has an inner diameter of 15 mm. The section insulated to minimize thewhile heat losses to the environment, which were of the than heat insulated exchanger be considered adiabatic, greatly simplifies the 15 conditions. mm. The test was minimize the heat losses to which the environment, which were estimated toThus, besection lower 0.5% of thetocan total heat transfer even for the most unfavorable operating analysis. conditions. Thus, thethan heat0.5% exchanger can be considered adiabatic, simplifies the estimated to be lower of the total heat transfer even for thewhich most greatly unfavorable operating analysis. Thus, the heat exchanger can be considered adiabatic, which greatly simplifies the analysis. conditions.
Materials 2016, 9, 455
7 of 18
Materials 2016, 9, 455
7 of 19
Tested fluid reservoir
Drain pipe
Plate heat exchanger
Vtf
Network water reservoir
∆ptf
Ttf out
Ttf in TTac hwein
Electric heater
~
~
Double tube heat exchanger
Thw out
Vhw
Hot water reservoir
Power regulator
Figure 7. Layout of the experimental setup for the determination of heat transfer coefficients and Figure 7. Layout of the experimental setup for the determination of heat transfer coefficients and pressure drop. pressure drop.
TheThe hothot water is stored in in a 25 L reservoir the loop loopand andisispumped pumped water is stored a 25 L reservoirthat thatgives givesthermal thermal inertia inertia to to the through a 4.5 kWkW electric heater before Similarly, the the tested testedfluid fluidisis through a 4.5 electric heater beforeit itenters entersthe theannular annularsection. section. Similarly, pumped from a 3 L reservoir tank to a plate heat exchanger, where it transfers energy to the water pumped from a 3 L reservoir tank to a plate heat exchanger, where it transfers energy to the water of of refrigeration. This tested fluid then flows into the tube-in-tube heat exchanger, where it receives refrigeration. This tested flows into the tube-in-tube heat exchanger, where it receives energy fromfrom the hot The refrigeration looploop consists of a reservoir tank where tap water is stored energy the water. hot water. The refrigeration consists of a reservoir tank where tap water is before being pumped plate the heatplate exchanger to cool the tested stored before beingthrough pumpedthe through heat exchanger to cool thefluid. tested fluid. flow rates of the water andtested testedfluid fluidare areadjusted adjusted both both with valves TheThe flow rates of the hothot water and valves and andcontrolling controlling rotation speed of the centrifugal pumpswith withproportional-integral-derivative proportional-integral-derivative (PID) the the rotation speed of the centrifugal pumps (PID)regulators. regulators. temperature of the water also controlledautomatically automatically with with aa PID PID that TheThe temperature of the hothot water is is also controlled that adjusts adjuststhe theelectric electric power delivered by a power regulator to the electric heater. The flow rate of refrigeration water, power delivered by a power regulator to the electric heater. The flow rate of refrigeration water,and and therefore temperature of the tested fluid, controlledmanually manuallywith withaa needle needle valve. valve. therefore the the temperature of the tested fluid, is iscontrolled temperatures waterand andtested testedfluid fluidatatthe the inlet inlet and and outlet outlet of TheThe temperatures of of hothot water of the the test testsection sectionare are measured with four Pt100 A Class resistance temperature sensors. The flow rate of both measured with four Pt100 A Class resistance temperature sensors. The flow rate of bothfluids fluidsisis measured with two different electromagnetic flowmeters. The pressure drop of the tested fluid measured with two different electromagnetic flowmeters. The pressure drop of the tested fluid through the tube-in-tube heat exchanger is measured with a differential pressure sensor. Lastly, the through the tube-in-tube heat exchanger is measured with a differential pressure sensor. Lastly, the experimental setup is equipped with a data acquisition system based on a 16-bit acquisition card and experimental setup is equipped with a data acquisition system based on a 16-bit acquisition card and a a PC where the measured variables are displayed in real time and stored in a spreadsheet. PC where the measured variables are displayed in real time and stored in a spreadsheet. 3.2. Experimental Procedure 3.2. Experimental Procedure With the aim of evaluating the enhancement of the convection heat transfer coefficients and the With the aim of evaluating the enhancement of the convection heat transfer coefficients and pressure drop of several sulfonic acid-functionalized graphene nanoplatelet aqueous nanofluids, a the comparison pressure drop of several acid-functionalized nanoplatelet aqueouscarried nanofluids, between thesesulfonic results and those obtained forgraphene pure water was experimentally out. a comparison between results and those for at pure water was0.75%, experimentally Thus, several sets of these tests were conducted forobtained nanofluids 0.25%, 0.50%, and 1.00%carried mass out.concentrations Thus, several sets of tests were conducted for nanofluids at 0.25%, 0.50%, 0.75%, mass of graphene nanoplatelets, together with those for pure water. Eachand test 1.00% is defined concentrations of graphene nanoplatelets, together with those for pureinwater. Each test is of defined through the values of the volumetric flow rate and average temperature the heat exchanger each through fluid. the values of the volumetric flow rate and average temperature in the heat exchanger of each fluid. Heat transfer tests were conducted by pumping the fluid under study at different flow rates Heat the transfer tests were conducted byhot pumping the the fluid under study at different flowrate ratesofwhile while average temperature of both water and tested fluid as well as the flow hot the average temperature of both hot water and the tested fluid as well as the flow rate of hot water
Materials 2016, 9, 455
8 of 18
were kept constant. The pairs of studied average temperatures in relation to tested fluid/hot water were, in Celsius, 20/40, 30/40, 30/45, 30/50, and 40/60, and the studied fluid flow rate ranged from 200 to 700 L/h in 100 L/h steps. The hot water flow rate was set to 800 L/h for all the tests. The water flow rate was selected to be as small as possible to achieve a high temperature difference across the heat exchange, but high enough to ensure turbulent regime (Re > 104 ). This was done in order to calculate the heat transfer coefficient on the water side using widely accepted correlations for forced convection through annular sections. In order to assess the validity of the experimental measurements, the convection heat transfer coefficients for pure water were compared with the values predicted by the well-known Gnielinski correlations [42]. Deviations were less than 10% for all the tested conditions. The pressure drop tests were also carried out keeping the temperature of the tested fluid constant and pumping at different flow rates. Two tests were conducted for average temperatures of 25 ˝ C and 35 ˝ C and the flow rate was varied from 250 to 700 L¨ h´1 in 50 L¨ h´1 steps. The deviations of the pressure drops measured and those calculated from Gnielinski correlations [42] were also less than 10%, finding slightly higher deviations for the lowest flow rates. 4. Data Analysis The heat transfer capability of the graphene water-based nanofluids can be quantitatively described through the convection heat transfer coefficient. The convection coefficients of the different nanofluids are compared with those of pure water to analyze the heat transfer enhancement. Similarly, the pressure drops of the nanofluids and pure water are also compared. The convection coefficient cannot be measured directly, but can be calculated from the measured data as follows. The temperatures of the tested fluid and the heating water at the inlet and the outlet of the test section (Ttf in , Ttf out , Thw in , and Thw out ) were measured experimentally. The logarithmic mean temperature difference (LMTD), normally used in heat exchangers to describe the temperature driving force, is defined as: pThwin ´ Ttf out q ´ pThwout ´ Ttf in q ´ T ´T ¯ LMTD “ (3) ln Thwin ´Ttf out hwout
tf in
The overall thermal resistance in the test section, Rov , was obtained as the quotient of the (LMTD) . and the heat flow rate on the hot water side pQq according to the following equation: Rov “
LMTD .
Q
(4)
.
where Q is given by:
.
.
Q “ ρhw ˆ c phw ˆ V hw ˆ pThwin ´ Thwout q
(5)
.
where V hw is the hot water volume flow rate while ρhw and cp hw stand for its density and specific heat capacity, respectively. The calculations were carried out using the heat flow in the hot water side, Equation (5), because the uncertainties of the water properties are lower than those of the nanofluids. The overall thermal resistance is the sum of the thermal resistance corresponding to the external forced convection (Rhw ), the conductive thermal resistance of the steel tube (Rs ), and the internal forced convection resistance (Rtf ). Fouling resistances were assumed to be negligible in this work because the tube used was cleaned before the experiments. Therefore, the thermal resistance on the tested fluid side can be calculated using the following equation: Rt f “ Rov ´ Rs ´ Rhw
(6)
The convection thermal resistance of the hot water side is given by the equation: Rhw “ pπ ˆ d2 ˆ Lh ˆ hhw q´1
(7)
Materials 2016, 9, 455
9 of 18
where d2 corresponds to the outer diameter of the inner tube and Lh is the effective heating length of the test section. The heat transfer coefficient, hhw , was calculated using the correlations proposed by Gnielinski [42] for fully developed turbulent flows in annular ducts with adiabatic outer surfaces. These relations are given by: hhw “ k hw ˆ Nuhw {dh (8)
Nu˚ w “
Nuhw “ ψ ˆ Nu˚ hw
(9)
ψ “ 0.75 ˆ a´0.17
(10)
a “ d2 {d3
(11)
p f hw {8q ˆ Rehw ˆ Prhw ˆ p1 ` pdh {Lh q2{3 q ω ` 12.7 ˆ p f hw {8q1{2 ˆ pPrhw 2{3 ´ 1q
´1 1 ω “ 1.07 ` 900 ˆ Re´ hw ´ 0.63 ˆ p1 ` 10 ˆ Prhw q ´2
f hw “ p0.782 ˆ lnpRe˚ hw q ´ 1.50q Re˚ hw “
p1 ` a2 q ˆ lnpaq ` p1 ´ a2 q p1 ´ aq2 ˆ lnpaq
ˆ Rehw
(12) (13) (14) (15)
where dh , the hydraulic diameter for the annular section, is the inner diameter of the outer tube, d3 , minus the outer diameter of the inner tube, d2 ; and khw is the thermal conductivity of hot water. The Nusselt number (Nuhw ), the Reynolds number (Rehw ), and the Prandtl number (Prhw ) of the hot water were calculated according to their usual definitions. The thermophysical and transport properties of hot water were obtained from REFPROP [37], considering water to be a saturated liquid at an average temperature between the inlet and the outlet. On the other hand, the conductive thermal resistance, Rs , was calculated assuming unidimensional heat transfer in the radial direction and according to the equation: Rs “
lnpd2 {d1 q 2π ˆ k s ˆ Lh
(16)
where d1 is the inner diameter of the inner tube of the heat exchanger, made of AISI 316L stainless steel. Its thermal conductivity (ks ) was calculated using the equation proposed by Choong [43]: k s “ 9.248 ` 0.01571 ˆ pT ` 273.15q
(17)
where the temperature of the tube, T, should be expressed in Celsius and the conductivity in W¨ m´1 ¨ K´1 . The temperature of the tube for each test was considered as a constant given by: T“
1 ˆ pTt f in ` Tt f out ` Thwin ` Thwout q 4
(18)
Consequently, once the inner thermal resistance, Rtf , due to convection was calculated using Equation (6), the convection coefficient was determined in a straightforward way using the following equation: ht f “ π ˆ d1 ˆ Lh ˆ Rt f ´1 (19) On the other hand, the pressure drop of the fluid under study was measured directly and no further analysis is required to compare the results of the different nanofluids and water. Heat transfer coefficient and pressure drop are dimensional variables and, although they can be convenient for comparing the thermal and hydrodynamic behavior of the nanofluids, they are not suitable to correlate the experimental data. Instead, dimensionless groups can be used to correlate the
Materials 2016, 9, 455
10 of 18
heat transfer and pressure drop with the parameters of the flow and the properties and composition of the nanofluid. The tested fluid Nusselt number (Nutf ) is the dimensionless form for the convection coefficient of the tested fluid (htf ) and is given by the following equation: Nut f “
h t f ˆ d1 kt f
(20)
Similarly, the Darcy friction factor of the tested fluid (ftf ), which represents the dimensionless pressure drop across the heat exchanger, is given by: ft f “
∆pt f d1 ˆ L p ρt f ˆ vt f 2 {2
(21)
where Lp stands for the effective pressure drop length of the test section while ∆ptf , ρtf , and vtf are the pressure drop, density, and average velocity of the tested fluid, respectively. In this work, the Nusselt number of the tested fluid (Nutf ) was related to its Reynolds number (Retf ), Prandtl number evaluated at the bulk temperature (Prtf ), Prandtl number evaluated at the wall temperature (Prwall ), and volumetric concentration of nanoparticles (ϕv ). The following equation is proposed in this work to correlate the heat transfer experimental data for the tested fluids: c
c
Nut f “ c1 ˆ p1 ` c2 ˆ φv qc3 ˆ Ret 4f ˆ Prt 5f ˆ pPrt f {Prwall qc6
(22)
The Prandtl number, Prwall , at the wall is included in the correlation to account for the heat transfer effect on the temperature profile and so on the thermal properties. The temperature at the wall was considered as a constant given by: Twall “
. 1 ˆ pTtf in ` Ttf out q ` Rt f ˆ Q 2
(23)
It should be noted that the volumetric concentration of nanoparticles was used to correlate the experimental data. This is because the rheological behavior of suspensions, such as nanofluids, highly depends on hydrodynamic forces, which act on the surfaces of the particles; therefore, a geometric way to describe the concentration of the fluid is preferred. This is a common practice when studying nanofluids, as is also discussed by Pak and Cho [11]. Likewise, the Darcy friction factor of the tested fluid (ftf ) was related to the Reynolds number and the volumetric concentration of nanoadditives. The functional relation proposed for the friction factor follows the expression: c f t f “ c7 ˆ p1 ` c8 ˆ φv qc9 ˆ Ret 10 (24) f In order to further evaluate the thermal performance, the comparison of the Nusselt numbers of two fluids must be balanced by the friction factors, which are influenced by the nanoparticles’ dispersion. A possible means of evaluating the thermal effectiveness of the different tested nanofluids is to use the thermal performance factor given by the following relation [44,45]: ηt f “ pNut f {Nub f q ˆ p f t f { f b f q1{3
(25)
where f is the Darcy friction factor, Nu the Nusselt number, and tf and bf stand for tested and base fluids, respectively. The experimental results were analyzed using this parameter to compare the thermal performance of the different nanofluids. The required thermophysical properties of the tested fluid, evaluated at the average temperature in the heat exchanger, were obtained from the aforementioned experimental values. A thorough uncertainty analysis of the measured and calculated magnitudes was performed following the
Materials Materials 2016, 2016, 9, 9, 455 455
11 11 of of 18 19
recommendations of the “Guide to the Expression of Uncertainty in Measurements (GUM)” [46]. The recommendations of the to thelater. Expression of Uncertainty in Measurements (GUM)” [46]. results of this analysis are“Guide summarized The results of this analysis are summarized later. 5. Results 5. Results Firstly, the heat transfer coefficients and the pressure losses of the different nanofluids are Firstly, the heat transfer coefficients and the pressure losses of the different nanofluids are compared and discussed in relation to water results. After that, the obtained numerical values for the compared and discussed in relation to water results. After that, the obtained numerical values Nusselt number and Darcy friction factor correlations are presented together with their validity for the Nusselt number and Darcy friction factor correlations are presented together with their validity ranges. In addition, the analysis of the thermal performance factor as a function of mass concentration ranges. In addition, the analysis of the thermal performance factor as a function of mass concentration is discussed. is discussed. 5.1. Heat Heat Transfer Transfer Performance Performance 5.1. The experimental experimental results results for for the the analyzed analyzed sulfonic sulfonic acid-functionalized acid-functionalized graphene graphene nanoplatelet nanoplatelet The water-based nanofluids nanofluids are are shown shown as as an an example example of of some some of of the thenumerous numeroustests. tests. The The displayed displayed water-based behaviors are representative of the rest of the tests performed, the tendency of the data being similar behaviors are representative of the rest of the tests performed, the tendency of the data being similar along all the other tests. along all the other tests. 5.1.1. Heat Heat Transfer Transfer Coefficients Coefficients 5.1.1. The experimental experimental heat heat transfer transfer coefficients coefficients of of the the different different analyzed analyzed nanofluids nanofluids and and pure pure water water The ˝ C tests in the the 20 20 ˝°C/40 8 as as aa function function of of the the mass mass in C/40 °C tests at at different different flow flow rates rates are are plotted plotted in in Figure Figure 8 concentration of graphene nanoplatelets at different flow rates. As could be expected, the heat concentration of graphene nanoplatelets at different flow rates. As could be expected, the heat transfer transfer coefficients increase the flow due to the increase mixing and turbulence. heat coefficients increase with the with flow rate due rate to the increase of mixingofand turbulence. The heatThe transfer −1 tests at different temperatures are plotted in Figure 9. Each curve ´ 1 transfer coefficients for the 300 L·h coefficients for the 300 L¨ h tests at different temperatures are plotted in Figure 9. Each curve represents the the values values measured measured at at different different tested tested fluid fluid average average temperatures, temperatures, with with 20 20 ˝°C as heat heat represents C as exchanger LMTD. coefficient is higher as the temperature of the exchanger LMTD. As As can canbe beobserved, observed,the theheat heattransfer transfer coefficient is higher as the temperature of nanofluid rises, which agrees with the decrease of the tested fluid viscosity and the increase of its the nanofluid rises, which agrees with the decrease of the tested fluid viscosity and the increase of its thermal conductivity. conductivity. thermal
Figure 8. 8. Heat Heat transfer transfer coefficient against graphene Figure coefficient against graphene nanoplatelet nanoplatelet concentration concentration at at different different flow flow rates. rates. ˝ ˝ The average temperatures of tested fluid/hot water are 20 °C/40 °C. The average temperatures of tested fluid/hot water are 20 C/40 C.
Materials 2016, 9, 455 Materials 2016, 9, 455
12 of 18 12 of 19
Figure 9.9.Heat Heat transfer coefficient graphene nanoplatelet concentration at different Figure transfer coefficient againstagainst graphene nanoplatelet concentration at different temperatures ´1 . The temperatures with a flow of 300 L·h−1.atThe at the heat is 20 °C. with a flow rate of 300 L¨ hrate LMTD theLMTD heat exchanger is exchanger 20 ˝ C.
Upon further further inspection inspection of of Figures Figures 88 and and 9, 9, it it can can be be seen seen that that the the heat heat transfer transfer coefficients coefficients have have Upon a smooth dependence with the concentration of graphene nanoplatelets. The heat transfer achieved a smooth dependence with the concentration of graphene nanoplatelets. The heat transfer achieved with the the 0.25% 0.25% nanofluid nanofluid is is greater greater than than that that of of pure pure water water and and the the results results were were even even better better when when the the with concentration was 0.50%. However, the heat transfer enhancement obtained with the 0.75% nanofluid concentration was 0.50%. However, the heat transfer enhancement obtained with the 0.75% nanofluid was smaller smaller and and the the heat heat transfer transfer coefficients coefficients for for the the 1.00% 1.00% mass mass concentration concentration were were even even worse worse than than was those of pure water under many conditions. This may be because, at low nanoparticle concentrations, those of pure water under many conditions. This may be because, at low nanoparticle concentrations, the heat heat transfer transfer enhancement enhancement due due to to the the thermal thermal conductivity conductivity and and the the increased increased degree degree of of mixing mixing the are more more important important than than the the penalty penalty caused caused by by the are the increase increase of of the the effective effective viscosity viscosity of of the the nanofluid. nanofluid. Nevertheless, at higher concentrations, the increase of viscosity due to the presence of solid particles Nevertheless, at higher concentrations, the increase of viscosity due to the presence of solid particles predominates over the other two effects and, as a result, the heat transfer is reduced with respect to predominates over the other two effects and, as a result, the heat transfer is reduced with respect to that that achieved with base Thisthesuggests existence an optimum nanoparticle achieved with the basethe fluid. Thisfluid. suggests existencethe of an optimumofnanoparticle concentration for concentration for a given set of operating conditions. The obtained relative heat transfer a given set of operating conditions. The obtained relative heat transfer enhancements with respect to enhancements with respect to water for each nanofluid (minimum, average, and maximum) are water for each nanofluid (minimum, average, and maximum) are summarized in Table 1. summarized in Table 1. Table 1. Heat transfer enhancement with respect to water for functionalized graphene nanoplatelet Table 1. nanofluids. Heat transfer enhancement with respect to water for functionalized graphene nanoplatelet aqueous aqueous nanofluids. Nanofluid
Minimum
Nanofluid ϕm = 0.25% φm = 0.25% ϕm = 0.50% φm = 0.50% ϕm = 0.75% φm = 0.75% ϕm = 1.00% φm = 1.00%
Minimum ´1.7% −1.7% 0.94% 0.94% ´2.3% −2.3% ´19.6% −19.6%
Average
Maximum
Average Maximum 6.5% 6.5% 18.6% 18.6% 15.0% 32.4% 15.0% 32.4% 22.8% 7.0% 7.0% 22.8% 4.0% –10.1% –10.1% 4.0%
In relation to the heat transfer enhancements, we notice that Sadeghinezhad et al. [28] obtained In relation to the heat transfer enhancements, we notice that Sadeghinezhad et al. [28] obtained increments in the Nusselt number up to 83% for graphene nanoplatelets nanofluids at 0.1 wt % under increments in the Nusselt number up to 83% for graphene nanoplatelets nanofluids at 0.1 wt % under turbulent forced convection through a plain stainless steel tube. Yarmand et al. [29] quantified their turbulent forced convection through a plain stainless steel tube. Yarmand et al. [29] quantified their maximum enhancement of the Nusselt number at 26.5% using a square stainless steel tube for samples maximum enhancement of the Nusselt number at 26.5% using a square stainless steel tube for at 0.1 wt %. samples at 0.1 wt %. 5.1.2. Pressure Losses 5.1.2. Pressure Losses To determine if this kind of nanofluid is suitable for heat transfer applications, the pressure determine this kindofofthe nanofluid is suitable for heat applications, the pressureofdrop drop To caused by theifpresence solid particles should also transfer be analyzed. The measurements the caused by the presence of the solid particles should also be analyzed. The measurements of the pressure drop of the 0.25%, 0.50%, and 0.75% nanofluids, as well as those of pure water, for different pressure drop of the 0.25%, 0.50%, and 0.75% nanofluids, as well as those of pure water, for different flow rates and at a test fluid temperature of 35 °C, are plotted in Figure 10, as an example. As
Materials 2016, 9, 455
13 of 18
Materials 2016, 9, 455
13 of 19
flow rates and at a test fluid temperature of 35 ˝ C, are plotted in Figure 10, as an example. As expected, the pressure increase the flow Moreover, as can be seen this figure, thefigure, pressure expected, thelosses pressure losseswith increase withrate. the flow rate. Moreover, as caninbe seen in this the drop slightly the mass This increase be duecan to the pressure dropincreases slightly with increases withconcentration. the mass concentration. Thiscan increase be higher due to viscosities the higher of the nanofluid as the and, concentration of graphene effect becomes important viscosities of theand, nanofluid as the concentration ofincreases, graphenethis increases, this effectmore becomes more and the pressure losses rise. important and the pressure losses rise.
Figure 10. 10. Pressure Pressure drops drops versus versus graphene graphene nanoplatelet nanoplatelet concentration concentration at at 35 35 ˝°C test fluid fluid temperature temperature Figure C test and for for different different flow flow rates. rates. and
Taking into account all the tests performed, it was also found that at a lower nanofluid Taking into account all the tests performed, it was also found that at a lower nanofluid temperature, temperature, e.g., 25 °C, the pressure losses were slightly higher, as a consequence of the higher e.g., 25 ˝ C, the pressure losses were slightly higher, as a consequence of the higher viscosities. viscosities. The relative experimental pressure increases with respect to pure water for each nanofluid The relative experimental pressure increases with respect to pure water for each nanofluid (minimum, (minimum, average, and maximum) are summarized in Table 2. average, and maximum) are summarized in Table 2. Table 2. Relative pressure drop in relation to pure water for graphene nanoplatelets water-based Relative pressure drop in relation to pure water for graphene nanoplatelets Table 2. nanofluids. water-based nanofluids.
Nanofluid φmNanofluid = 0.25% = 0.25% φmϕ=m 0.50% ϕ = 0.50% m φm = 0.75% ϕm = 0.75%
Minimum Minimum 0.92% 0.92% 4.11% 4.11% 13.0% 13.0%
Average
Maximum
Average 14.5%
Maximum 55.4%
14.5% 17.1% 17.1% 28.0% 28.0%
55.4% 56.9% 56.9% 73.4% 73.4%
These results are in agreement with those of Sadeghinezhad et al. [28], who found maximum Theseinresults aredrops in agreement those of Sadeghinezhad et al. [28], who found maximum increases pressure of 14.6% with for 0.1 wt %. increases in pressure drops of 14.6% for 0.1 wt %. 5.2. Dimensionless Analysis 5.2. Dimensionless Analysis Many correlations to calculate the Nusselt number and the Darcy friction factor for internal Many correlations to calculate number the Darcy friction factor internal forced forced convection in circular ductsthe areNusselt available in theand literature. However, those for correlations were convection in circular ducts are available in the literature. However, those correlations were developed developed using measurements of pure substances and are not capable of predicting the behavior of using measurements pure substances and for are not capable the of predicting the behavior of nanofluids. nanofluids. Two newofcorrelations suitable calculating Nusselt number and Darcy friction Two new correlations suitable for calculating the Nusselt number and Darcy friction factor of sulfonic factor of sulfonic acid-functionalized graphene nanofluids were developed in this work. acid-functionalized graphene nanofluids were developed in this work. 5.2.1. Nusselt Number Correlation The c1–c6 fitting coefficients in Equation (22) were determined using a least squares regression analysis. The proposed correlation for the Nusselt number and its validity ranges are given by the following equations:
Nunf 0.011 (1 100v )0.095 Re0nf.886 Prnf0.545 (Prnf / Prwall )0.495
(26)
Materials 2016, 9, 455
14 of 18
5.2.1. Nusselt Number Correlation The c1 –c6 fitting coefficients in Equation (22) were determined using a least squares regression analysis. The proposed correlation for the Nusselt number and its validity ranges are given by the following equations: Nun f “ 0.011 ˆ p1 ` 100 ˆ φv q´0.095 ˆ Re0.886 ˆ Pr0.545 ˆ pPrn f {Prwall q´0.495 nf nf
(26)
0.19% ď φv ď 0.79%
(27)
5 ˆ 103 ď Ren f ď 4 ˆ 104
(28)
4.8 ď Prn f ď 10.8
(29)
1.06 ď Prn f {Prwall ď 1.36
(30)
It should be noted that the factor Prnf /Prwall that is used to account for the effect that the heat transfer has on the temperature profile is different if the fluid is either heated or cooled. During all the tests the heat was transferred from the hot water to the nanofluid and, therefore, the correlation given by Equation (26) should only be used when the nanofluid is being heated. The uncertainty of the experimental Nusselt number was evaluated and it ranged from 6% to 12% for all the measured values. The deviation between the Nusselt numbers correlated and those measured experimentally is 13.2% for the worst case (0.25% mass concentration nanofluid, 40 ˝ C/60 ˝ C, and 700 L¨ h´1 ) and is less than 10% and 8% for 90% and 75% of the measured values, respectively. 5.2.2. Darcy Friction Factor Correlation The procedure for the friction factor correlation was similar to that of the Nusselt number. The obtained fitting parameters from c7 to c10 in Equation (24) are: 0.159 f n f “ 0.109 ˆ p1 ` 100 ˆ φv q0.215 ˆ Re´ nf
(31)
0.19% ď φv ď 0.59%
(32)
8 ˆ 103 ď Ren f ď 3.7 ˆ 104
(33)
The uncertainty analysis of the experimental friction factor leads to values below 2% for all the measured values. The deviation between the Darcy friction factors correlated and those measured experimentally is 4.7% for the worst case (0.75% mass concentration nanofluid, 35 ˝ C, and 300 L¨ h´1 ) and is less than 2.5% and 2% for 90% and 75% of the measured values, respectively. 5.2.3. Thermal Performance Factor An analysis of the thermal performance factor obtained for each graphene nanoplatelet mass concentration was carried out by combining the results of the different tests as gathered in Figure 11 for different flow rates. A reference temperature of 30 ˝ C for both experiments was selected in order to develop this comparison. Thus, Nusselt numbers were obtained from the 30 ˝ C/40 ˝ C heat transfer test (average temperature of the tested fluid at 30 ˝ C) while friction factors were obtained through an interpolation of both 25 ˝ C and 35 ˝ C pressure drop tests. As can be observed in Figure 11, the thermal performance factor rises when the flow rate increases and all nanofluids present beneficial ratios except for the 1 wt %. The concentration dependence of this factor exhibits maximum values at 0.5% mass concentration, reaching a value of 1.27 for the highest flow rate. In agreement with previous results, the 1% sample shows the worst results, with thermal performance factors below the unit for all the analyzed flow rates.
Materials 2016, 9, 455 Materials 2016, 9, 455
15 of 18 15 of 19
˝ C, with Figure 11. Thermal performance factor nanoplatelet concentration at°C, 30 with Figure 11. Thermal performance factoragainst against graphene graphene nanoplatelet concentration at 30 ˝ LMTD °C between fluids, differentflow flowrates. rates. LMTD of 10ofC10between fluids, forfor different
A reference temperature of 30 °C for both experiments was selected in order to develop this comparison. Thus, Nusselt numbers were obtained from the 30 °C/40 °C heat transfer test (average temperature of the testedexperimental fluid at 30 °C) while friction were obtained through anthe interpolation In this work, a new device was factors implemented to determine heat transfer of both and 25 °Cthe andpressure 35 °C pressure drop tests. As can be observed in Figure 11, the graphene thermal performance coefficients drops of several sulfonic acid-functionalized nanofluids in when the flow and all ananofluids beneficial ratios and except for the waterfactor up torises 1 wt % (0.79 vol rate %). increases A rheometer, transientpresent hot wire technique, a differential 1 wt %. The concentration dependence of this factor exhibits maximum values at 0.5% mass of scanning calorimeter were used to measure viscosities, thermal conductivities, and heat capacities concentration, reaching a value of 1.27 for the highest flow rate. In agreement with previous results, the analyzed samples, respectively. Enhancements in thermal conductivity reach up to 12% for the the 1% sample shows the worst results, with thermal performance factors below the unit for all the maximum analyzed concentration. analyzed flow rates.
6. Conclusions
Noticeable enhancements in the convection coefficients, htf , are achieved for all nanofluids except for 1 wt %. These coefficients increase with the flow rate and the temperature of the fluid. The mass 6. Conclusions concentration dependence shows an optimum at 0.5%, for which htf are up to 32% higher than those for In this work, a new experimental device was implemented to determine the heat transfer water.coefficients The pressure losses monotonously increase with the nanoparticle concentration as a consequence and the pressure drops of several sulfonic acid-functionalized graphene nanofluids in of thewater viscosity up toof1the wt tested % (0.79fluid. vol %). A rheometer, a transient hot wire technique, and a differential Two newcalorimeter correlations able totodescribe Nusseltthermal number and the friction factor of this scanning were used measurethe viscosities, conductivities, and heat capacities ofkind the analyzed respectively. Enhancements in thermal conductivity reach up lower to 12% than for the of dispersion as asamples, function of dimensionless numbers are presented. Deviations 13.2% maximum analyzed concentration. in the case of Nusselt and 4.7% for pressure losses are obtained. Moreover, heat transfer coefficient Noticeable enhancements in the convection coefficients, htf, are achieved forfactor all nanofluids except and pressure drop results were combined through the thermal performance to assess whether for 1 wt %. These coefficients increase with the flow rate and the temperature of the fluid. The mass replacing the base fluid with the different designed nanofluids would be beneficial. The 0.5% nanofluid concentration dependence shows an optimum at 0.5%, for which htf are up to 32% higher than those was found to exhibit the best results, reaching increases up to 27% in this factor. Hence, the use of for water. The pressure losses monotonously increase with the nanoparticle concentration as a nanofluids is an alternative with a high potential for heat transfer enhancement considering that, for consequence of the viscosity of the tested fluid. an appropriate graphene nanoplatelet concentration, inofthe heat Two new correlations able to describe the Nusseltsignificant number andimprovements the friction factor this kindtransfer of coefficients can as beaachieved, low pressure dropare increases. dispersion function ofwith dimensionless numbers presented. Deviations lower than 13.2% in the The of nanofluids would allow for developing more efficientheat andtransfer compacting heat and transfer case use of Nusselt and 4.7% for pressure losses are obtained. Moreover, coefficient pressure Itdrop were combined through the thermal and performance factor to assess whether equipment. canresults be especially significant in renewable clean energy technologies, with a replacing the base application fluid with the would be beneficial. potentially interesting in different the fielddesigned of solar nanofluids and geothermal energy. ThisThe type0.5% of new nanofluid wastofound to exhibit the temperature best results, reaching increases up fluids, to 27% increasing in this factor. material can lead reductions in the difference between theHence, efficiency the use of nanofluids is an alternative with a high potential for heat transfer enhancement considering of thermal machinery or decreasing the required flow rates, which would reduce the pumping power that, for an appropriate graphene nanoplatelet concentration, significant improvements in the heat consumption. However, the field of nanofluids is still in its early stages and new works, both theoretical transfer coefficients can be achieved, with low pressure drop increases. and experimental, should be conducted in order to understand and be able to predict their behavior. The use of nanofluids would allow for developing more efficient and compacting heat transfer equipment. It can be especially significant in renewable and clean energy technologies, with a Acknowledgments: The authors acknowledge the functionalized graphene nanoplatelets powder provided potentially Technologies interesting application in the field of solar and geothermal energy. Thiswas typesupported of new by by Nanoinnova S.L. (http://www.nanoinnova.com/Product). This work the Ministerio de Economía y Competitividad (Spain) and the FEDER program through ENE2012-32908 and ENE2014-55489-C2-2-R Projects. David Cabaleiro acknowledges the financial support under the FPU Program by the “Ministerio de Educación, Cultura y Deporte” (Spain) and Javier P. Vallejo acknowledges the FPI Program of the “Ministerio de Economía y Competitividad”.
Materials 2016, 9, 455
16 of 18
Author Contributions: Ángel Á. Pardiñas participated in the implementation of the experimental setup to develop the heat transfer tests, Roberto Agromayor determined the experimental heat transfer coefficients and pressure drops of the nanofluids, and David Cabaleiro carried out the design of the nanofluids and their thermophysical characterization. Roberto Agromayor, Ángel Á. Pardiñas, David Cabaleiro, and Javier P. Vallejo analyzed the data and wrote the paper. José Fernández-Seara and Luis Lugo conceived the study, developed its design, and coordinated the redaction of the manuscript. All authors read and approved the final manuscript. Conflicts of Interest: The authors declare no conflict of interest. The founding sponsors had no role in the design of the study; in the collection, analyses, or interpretation of data; in the writing of the manuscript, and in the decision to publish the results.
Abbreviations Nomenclature a ci cp d1 d2 d3 dh f h k LMTD Lh Lp Nu Pr .
Q R Re T v . V vol % wt % ∆p η ρ ϕm ϕv ψ|ω Subscripts bf hw in nf out ov s tf w wall
Annulus diameter ratio, dimensionless Correlation fitting constant, dimensionless Specific heat capacity, J¨ kg´1 ¨ K´1 Inner diameter of the inner tube, m Outer diameter of the inner tube, m Inner diameter of the outer tube, m Hydraulic diameter, m Darcy friction factor, dimensionless Convection coefficient, W¨ m´2 ¨ K´1 Thermal conductivity, W¨ m´1 ¨ K´1 Logarithmic mean temperature difference, ˝ C Effective heating length, m Effective pressure drop length, m Nusselt number, dimensionless Prandtl number, dimensionless Heat flow rate, W Thermal resistance, K¨ W´1 Reynolds number, dimensionless Temperature, K, ˝ C Average velocity of the fluid, m¨ s´1 Volume flow rate, m3 ¨ s´1 Percentual graphene nanoplatelets volume concentration, dimensionless Percentual graphene nanoplatelets mass concentration, dimensionless Pressure drop, Pa Thermal performance factor, dimensionless Density, kg¨ m´3 Graphene nanoplatelets mass concentration, dimensionless Graphene nanoplatelets volume concentration, dimensionless Correction factors for the Nusselt number in the annulus, dimensionless Base fluid Heating water Inlet of the test section Nanofluid Outlet of the test section Overall Steel Tested fluid Water Tube wall
References 1.
Choi, S.U.S.; Eastman, J.A. Enhancing thermal conductivity of fluids with nanoparticles. FED 1995, 231, 99–105.
Materials 2016, 9, 455
2.
3. 4. 5. 6. 7. 8. 9. 10. 11. 12. 13. 14. 15.
16. 17. 18. 19. 20.
21. 22.
23. 24. 25. 26. 27.
17 of 18
Cabaleiro, D.; Pastoriza-Gallego, M.J.; Gracia-Fernández, C.; Piñeiro, M.M.; Lugo, L. Rheological and volumetric properties of TiO2 -ethylene glycol nanofluids. Nanoscale Res. Lett. 2013, 8, 1–13. [CrossRef] [PubMed] Sharma, A.K.; Tiwari, A.K.; Dixit, A.R. Rheological behaviour of nanofluids: A review. Renew. Sustain. Energy Rev. 2016, 53, 779–791. [CrossRef] Huminic, G.; Huminic, A. Application of nanofluids in heat exchangers: A review. Renew. Sustain. Energy Rev. 2012, 16, 5625–5638. [CrossRef] Trisaksri, V.; Wongwises, S. Critical review of heat transfer characteristics of nanofluids. Renew. Sustain. Energy Rev. 2007, 11, 512–523. [CrossRef] Lomascolo, M.; Colangelo, G.; Milanese, M.; de Risi, A. Review of heat transfer in nanofluids: Conductive, convective and radiative experimental results. Renew. Sustain. Energy Rev. 2015, 43, 1182–1198. [CrossRef] Xuan, Y.; Li, Q. Heat transfer enhancement of nanofluids. Int. J. Heat Fluid Flow 2000, 21, 58–64. [CrossRef] Gu, B.; Hou, B.; Lu, Z.; Wang, Z.; Chen, S. Thermal conductivity of nanofluids containing high aspect ratio fillers. Int. J. Heat Mass Transf. 2013, 64, 108–114. [CrossRef] Mintsa, H.A.; Roy, G.; Nguyen, C.T.; Doucet, D. New temperature dependent thermal conductivity data for water-based nanofluids. Int. J. Therm. Sci. 2009, 48, 363–371. [CrossRef] Ellahi, R.; Hassan, M.; Zeeshan, A. Shape effects of nanosize particles in Cu–H2 O nanofluid on entropy generation. Int. J. Heat Mass Transf. 2015, 81, 449–456. [CrossRef] Pak, B.C.; Cho, Y.I. Hydrodynamic and heat transfer study of dispersed fluids with submicron metallic oxide particles. Exp. Heat Transf. Int. J. 1998, 11, 151–170. [CrossRef] Fard, M.H.; Esfahany, M.N.; Talaie, M. Numerical study of convective heat transfer of nanofluids in a circular tube two-phase model versus single-phase model. Int. Commun. Heat Mass Transf. 2010, 37, 91–97. [CrossRef] Rahman, S.U.; Ellahi, R.; Nadeem, S.; Zia, Q.M.Z. Simultaneous effects of nanoparticles and slip on jeffrey fluid through tapered artery with mild stenosis. J. Mol. Liq. 2016, 218, 484–493. [CrossRef] Colangelo, G.; Favale, E.; Miglietta, P.; Milanese, M.; de Risi, A. Thermal conductivity, viscosity and stability of Al2 O3 -diathermic oil nanofluids for solar energy systems. Energy 2016, 95, 124–136. [CrossRef] Colangelo, G.; Favale, E.; de Risi, A.; Laforgia, D. Results of experimental investigations on the heat conductivity of nanofluids based on diathermic oil for high temperature applications. Appl. Energy 2012, 97, 828–833. [CrossRef] Lee, G.J.; Rhee, C.K. Enhanced thermal conductivity of nanofluids containing graphene nanoplatelets prepared by ultrasound irradiation. J. Mater. Sci. 2014, 49, 1506–1511. [CrossRef] Balandin, A.A.; Ghosh, S.; Bao, W.; Calizo, I.; Teweldebrhan, D.; Miao, F.; Lau, C.N. Superior thermal conductivity of single-layer graphene. Nano Lett. 2008, 8, 902–907. [CrossRef] [PubMed] Ahmad, I.; McCarthy, J.E.; Baranov, A.; Gun’ko, Y.K. Development of graphene nano-platelet based counter electrodes for solar cells. Materials 2015, 8, 5953–5973. [CrossRef] Li, X.; Chen, Y.; Mo, S.; Jia, L.; Shao, X. Effect of surface modification on the stability and thermal conductivity of water-based SiO2 -coated graphene nanofluid. Thermochim. Acta 2014, 595, 6–10. [CrossRef] Amiri, A.; Sadri, R.; Shanbedi, M.; Ahmadi, G.; Chew, B.T.; Kazi, S.N.; Dahari, M. Performance dependence of thermosyphon on the functionalization approaches: An experimental study on thermo-physical properties of graphene nanoplatelet-based water nanofluids. Energy Convers. Manag. 2015, 92, 322–330. [CrossRef] Ijam, A.; Moradi Golsheikh, A.; Saidur, R.; Ganesan, P. A glycerol-water-based nanofluid containing graphene oxide nanosheets. J. Mater. Sci. 2014, 49, 5934–5944. [CrossRef] Yarmand, H.; Gharehkhani, S.; Ahmadi, G.; Shirazi, S.F.S.; Baradaran, S.; Montazer, E.; Zubir, M.N.M.; Alehashem, M.S.; Kazi, S.; Dahari, M. Graphene nanoplatelets-silver hybrid nanofluids for enhanced heat transfer. Energy Convers. Manag. 2015, 100, 419–428. [CrossRef] Wen, D.; Lin, G.; Vafaei, S.; Zhang, K. Review of nanofluids for heat transfer applications. Particuology 2009, 7, 141–150. [CrossRef] Rudyak, V.Y. Viscosity of nanofluids—Why it is not described by the classical theories. Adv. Nanopart. 2013, 2, 266–279. [CrossRef] Gupta, S.S.; Siva, M.V.; Krishnan, S.; Sreeprasad, T.S.; Singh, P.K.; Pradeep, T.; Das, S.K. Thermal conductivity enhancement of nanofluids containing graphene nanosheets. J. Appl. Phys. 2011, 110. [CrossRef] Hajjar, Z.; Rashidi, A.M.; Ghozatloo, A. Enhanced thermal conductivities of graphene oxide nanofluids. Int. Commun. Heat Mass Transf. 2014, 57, 128–131. [CrossRef] Yu, W.; Xie, H.; Chen, W. Experimental investigation on thermal conductivity of nanofluids containing graphene oxide nanosheets. J. Appl. Phys. 2010, 107. [CrossRef]
Materials 2016, 9, 455
28.
29.
30.
31. 32. 33.
34. 35.
36. 37.
38. 39.
40.
41.
42. 43. 44. 45.
46.
18 of 18
Sadeghinezhad, E.; Togun, H.; Mehrali, M.; Nejad, P.S.; Latibari, S.T.; Abdulrazzaq, T.; Kazi, S.; Metselaar, H.S.C. An experimental and numerical investigation of heat transfer enhancement for graphene nanoplatelets nanofluids in turbulent flow conditions. Int. J. Heat Mass Transf. 2015, 81, 41–51. [CrossRef] Yarmand, H.; Gharehkhani, S.; Shirazi, S.F.S.; Amiri, A.; Alehashem, M.S.; Dahari, M.; Kazi, S. Experimental investigation of thermo-physical properties, convective heat transfer and pressure drop of functionalized graphene nanoplatelets aqueous nanofluid in a square heated pipe. Energy Convers. Manag. 2016, 114, 38–49. [CrossRef] Solangi, K.; Amiri, A.; Luhur, M.; Ghavimi, S.A.A.; Zubir, M.N.M.; Kazi, S.; Badarudin, A. Experimental investigation of the propylene glycol-treated graphene nanoplatelets for the enhancement of closed conduit turbulent convective heat transfer. Int. Commun. Heat Mass Transf. 2016, 73, 43–53. [CrossRef] Ting, H.H.; Hou, S.S. Investigation of laminar convective heat transfer for Al2 O3 -water nanofluids flowing through a square cross-section duct with a constant heat flux. Materials 2015, 8, 5321–5335. [CrossRef] Sheikholeslami, M.; Ellahi, R. Electrohydrodynamic nanofluid hydrothermal treatment in an enclosure with sinusoidal upper wall. Appl. Sci. 2015, 5, 294–306. [CrossRef] Rashidi, S.; Dehghan, M.; Ellahi, R.; Riaz, M.; Jamal-Abad, M.T. Study of stream wise transverse magnetic fluid flow with heat transfer around an obstacle embedded in a porous medium. J. Magn. Magn. Mater. 2015, 378, 128–137. [CrossRef] Sheikholeslami, M.; Ellahi, R. Three dimensional mesoscopic simulation of magnetic field effect on natural convection of nanofluid. Int. J. Heat Mass Transf. 2015, 89, 799–808. [CrossRef] Sher Akbar, N.; Raza, M.; Ellahi, R. Influence of induced magnetic field and heat flux with the suspension of carbon nanotubes for the peristaltic flow in a permeable channel. J. Magn. Magn. Mater. 2015, 381, 405–415. [CrossRef] Calvo-Bravo, J.; Cabaleiro, D.; Piñeiro, M.M.; Lugo, L. Magnetorheological behaviour of propylene glycol-based hematite nanofluids. Rheol. Acta 2015, 54, 757–769. [CrossRef] Lemmon, E.W.; Huber, M.L.; McLinden, M.O. Reference Fluid Thermodynamic and Transport Properties (REFPROP); NIST Standard Reference Database; National Institute of Standards and Technology: Gaithersburg, MD, USA, 2010. Cabaleiro, D.; Gracia-Fernández, C.; Legido, J.L.; Lugo, L. Specific heat of metal oxide nanofluids at high concentrations for heat transfer. Int. J. Heat Mass Transf. 2015, 88, 872–879. [CrossRef] Cabaleiro, D.; Nimo, J.; Pastoriza-Gallego, M.J.; Piñeiro, M.M.; Legido, J.L.; Lugo, L. Thermal conductivity of dry anatase and rutile nano-powders and ethylene and propylene glycol-based TiO2 nanofluids. J. Chem. Thermodyn. 2015, 83, 67–76. [CrossRef] Cabaleiro, D.; Pastoriza-Gallego, M.J.; Piñeiro, M.M.; Legido, J.L.; Lugo, L. Thermophysical properties of (diphenyl ether + biphenyl) mixtures for their use as heat transfer fluids. J. Chem. Thermodyn. 2012, 50, 80–88. [CrossRef] Cabaleiro, D.; Pastoriza-Gallego, M.J.; Piñeiro, M.M.; Lugo, L. Characterization and measurements of thermal conductivity, density and rheological properties of zinc oxide nanoparticles dispersed in (ethane-1,2-diol + water) mixture. J. Chem. Thermodyn. 2013, 58, 405–415. [CrossRef] Gnielinski, V. Heat Transfer in Concentric Annular and Parallel Plate Ducts. VDI Heat Atlas; Springer: Heidelberg, Germany, 2010; pp. 701–708. Kim, C.S. Thermophysical Properties of Stainless Steels; Technical Report; Argonne National Lab.: Argonne, IL, USA, 1975. Bianco, V.; Manca, O.; Nardini, S.; Vafai, K. Heat Transfer Enhancement with Nanofluids; CRC Press: Boca Raton, FL, USA, 2015. Mehrali, M.; Sadeghinezhad, E.; Rosen, M.A.; Akhiani, A.R.; Tahan Latibari, S.; Mehrali, M.; Metselaar, H.S.C. Heat transfer and entropy generation for laminar forced convection flow of graphene nanoplatelets nanofluids in a horizontal tube. Int. Commun. Heat Mass Transf. 2015, 66, 23–31. [CrossRef] Joint Committee for Guides in Metrology. Evaluation of Measurement Data—Guide to the Expression of Uncertainty in Measurements; JCGM 100: Sèvres, France, 2008. © 2016 by the authors; licensee MDPI, Basel, Switzerland. This article is an open access article distributed under the terms and conditions of the Creative Commons Attribution (CC-BY) license (http://creativecommons.org/licenses/by/4.0/).