HERPETOLOGICAL SPECIES MAPPING FOR THE MEDITTERANEAN A.K.Skidmore a, *, A.G.Toxopeus a, K.de Bie a, , F.Corsi a, V.Venus a , D.P.Omolo a, J.Marquez a , Raimundo Real Giménezb a
b
ITC, PO Box 6, 7500 AA Enschede, The Netherlands - (
[email protected]) Departamento Biología Animal, Facultad de Ciencias, Universidad de Málaga, 29071 Málaga (Spain) Commission VII
KEY WORDS: Biodiversity, Mediterranean, NDVI, fragmentation, solar radiation, climate
ABSTRACT: Biodiversity, and changes in biodiversity as a result of human and natural processes, have a prominent place in public debate. Sustaining biodiversity requires knowledge about its geographical distribution and pattern, as well as an understanding of the processes which are driving biodiversity at different scales. The biodiversity of the Mediterranean appears to result from historical (human) effects, as well as the geodiversity (the diversity of abiotic factors). One promising approach is the investigation of indicator groups and their relationships to the abiotic factors. We report the use of modeling techniques to map the distribution and abundance of reptile and amphibian species (probability. of occurrence), and we conclude that climate-based indices yield a higher accuracy in their prediction of herpetological species compared to NDVI-derived indices.. For Europe the distribution/abundance of most species is quite well known, but North Africa lacks good species distribution data. So, reliable extrapolation/modeling methods (using limited species distribution data and available geo-diversity data derived from remotely sensed and climatic data) can be of great importance for establishing biodiversity indices (hotspots) in these data scarce areas.
1. INTRODUCTION 1.1 General Instructions Explaining the variation in species diversity at various scales (local, regional, continental and global) is a key problem in ecology, and an understanding of these phenomena would allow management to perhaps better integrate human activities with natural processes. Biodiversity is measured in many ways – species richness is a classic method (number of species at a site or habitat), but concepts such as evenness, density, and abundance of species give insights to this concept. The task of explaining, and ultimately understanding, biodiversity is complicated simply because environment itself is complicated, with many interacting biological, physical, and human (historical) factors. And of course these factors interplay and become important (and less important) at different scales. Our approach has been to initially ‘simplify’ our view of the modelling problem by using presence and absence data for species, as well as focussing on climate as the main driver of biodiversity at a regional and continental scale. In addition, we argue that climate may be construed using time-series of remotely sensed imagery as a proxy, or directly from interpolation of climate station data. Ecological theory indicates that at sub-continental (areas > 106 km2) or continental scales, productivity or energy flow through an ecosystem is considered a major determinant of species diversity (Currie, 1991; Rosenzweig & Abramsky, 1993; Said, 2003; Said et al., 2003; Wright et al., 1993). This energy is often estimated from models or indirectly from other variables * Corresponding author.
and often used interchangeably with ‘net primary productivity’ (NPP) (Gaston, 2000). However, the direct estimation of energy is difficult at continental or sub-continental scales (Box et al., 1989; Currie, 1991; Owen, 1988; Said et al., 2003). Consequently, at regional scales, NPP is typically estimated from climatic data collected at scattered sampling points that are extrapolated in order to characterize productivity over a large region. However, such climatic-based models assume that vegetation cover is ‘natural’ and ipso facto under the control of climate. Further, at finer scales, it is argued that vegetation productivity is also influenced by non-climatic factors such as soil nutrient and structure, topography, disturbance and landuse. Therefore, the maximum Normalised Difference Vegetation Index (NDVI) derived from satellite data may provide an index of ecosystem processes and productivity compared to climatebased models due to the fact that it is spatially-explicit. NDVI, and increasingly other related ecosystem variables e.g. leaf area index (LAI) have been related to distribution of plant and animal species diversity (Jorgensen & Nohr, 1996; Oindo et al., 2000; Oindo & Skidmore, 2002; Said, 2003; Said et al., 2003; Walker et al., 1992). Biodiversity studies that aim at understanding reasons behind the presence-absence of specific species at certain locations often rely on maps derived from image interpretation coupled with field work. Images used represent mostly a single frame to cover the study area, or - at best – of a few repeats at different dates. Discussions frequently focus on resolution and scale. Habitats however often show a higher temporal (seasonal) variability than a spatial one. This characteristic is in the past poorly used to support mapping due a lack of images (or due to
cash shortages to purchase them). In recent years however, the use of NOAA-AVHRR, MODIS and SPOT-Vegetation data offered the option to study and gain insights of temporal dynamics due to their almost daily global revisiting frequency; this gain simultaneously implie a loss regarding spatial resolution (250m to 7km spatial resolution at a 10-dayly availability of free synthesis products). Traditionally, vegetation monitoring by remotely sensed data has been carried out using vegetation indices, which are mathematical transformations designed to assess the spectral contribution of green plants to multi-spectral observations (Maseli, 2004). A number of studies have shown that the normalised difference vegetation index (NDVI) derived by dividing the difference between infrared and red reflectance measurements by their sum provides effective measure of photosynthetically active biomass (Sarkar and Kafatos, 2004; Justice et al., 1985; Sellers, 1985; Drenge and Tucker, 1988; Ringrose et al. 1996; Maggi and Stroppiana, 2002; Weiss et al., 2004; Unganai and Kogan, 1998; Archer, 2004). Several studies also discussed the suitability of temporal NDVI profiles for studying vegetation phenologies, especially those of crops (Groten and Octare, 2002; Gorham, 1998; Hill and Donald, 2003; Uchida, 2001; Murakami et al., 2001). Various authors have sought to map land-cover phenology, dynamics and degradation through multi-temporal NDVI data (e.g. Cayrol et al., 2000; Budde et al., 2004; Ledwith, 2000; Eerens et al., 2001; Brand and Malthus, 2004; Souza et al., 2003). An alternative approach is to use climatic data, captured by networks of weather stations, to represent the variation in environmental conditions affecting the distribution of species. Generally in ecology, two main hypotheses have been advanced that relate species diversity to climatic parameters; (i) Climatic stability hypothesis whereby stable climates permit a constant influx of resources leading to increased densities of species (Pianka, 1983) and (ii) Intermediate disturbance hypothesis whereby irregular or unpredictable climatic variation may function biologically as a form of disturbance and maintain herpetofauna species and their assemblages away from the equilibrium (Connell, 1978). In this study, annual mean temperature, annual mean precipitation and precipitation seasonality (coefficient of variation) were employed as measurements of climatic stability. Although they are temporally variable, they are nevertheless predictable since they are cyclic in nature (Owen, 1989). Likewise, measures of irregular or stochastic variability of climate were estimated by the maximum and minimum temperatures of record. The aim of this study is to test whether climate-based, or NDVI-derived data, offer the highest accuracy in modelling the distribution of herpetological species.
2. METHODS 2.1 Data Data available for the NDVI part of the study concern georeferenced and de-clouded SPOT-4 Vegetation 10-day
composite NDVI images (S10 product) at 1-km2 resolution from April 1998 to April 2005 (7 years data; 252 images) as obtained from www.VGT.vito.be. Declouded means: using by image and pixel the supplied quality record, only pixels with a ‘good’ radiometric quality for bands 2 (red; 0.61-0.68 µm) and 3 (near IR; 0.78-0.89 µm), and not having ‘shadow’, ‘cloud’ or ‘uncertain’, but ‘clear’ as general quality, were kept (removed pixels were labelled as ‘missing’). NDVI indicates chlorophyll activity and is calculated from (band 3 - band 2) / (band 3 + band 2). 2.2 Image Processing Using the ISODATA clustering algorithm of Erdas-Imagine software and all 252 NDVI image data layers, one unsupervised classification run was carried out to generate a map with a predefined number of classes (45 classes). Unsupervised indicates that no additional data were used or expert’s guidance applied, to influence the classification approach. The maximum number of iterations was set to 50 and the convergence threshold was set to 1.0. Each iteration performs an entire classification, and was "self-organizing" regarding the way in which it located the clusters that are inherent in the data; the ISODATA algorithm minimizes the Euclidian distances to form clusters (Erdas, 2003; Swain, 1973). Of the produced map, selected NDVIprofiles (annual averaged profiles) are graphically presented and their spatial representation is shown. As reference, the map units represented by the selected NDVI-profile classes are also shown on a 90m SRTM-DEM (Digital Elevation Model) that is visually improved by adding hillshade features.
2.3 Climate data processing Temperature and precipitation-related indices are important for explaining the distribution of herp species diversity and their assemblages in the Mediterranean (Gasc J. -P. et al., 2004). Climatic data layers for this study were obtained from the WORLDCLIM database which consists of precipitation records from 47,554 locations, mean temperature from 24,542 locations and minimum and maximum temperature for 14,835 locations. The climatic measurements are interpolated using mainly thin plate smoothing splines. All the layers were obtained at 8 x 8 km and in geodetic coordinate system. The relevant layers were then clipped using the study area boundary. For a full description of the database, see Hijmans et al., (2004). All environmental predictors were subsequently aggregated in ArcGIS® to the 10 x 10 Km UTM standard sampling grid by specifying: Max as the operation to perform on aggregated values of Maximum Average NDVI and Maximum temperature of record; Mean as the operation for annual mean temperature and precipitation; Min operation for the minimum temperature of record and; the value of the centre pixels was taken for the derived variables e.g. standard deviation. The climatic and NDVI predictors used are described in table 1 below.
0.9
0.8
Name
Description
Unit
(A) Climatic predictors BIO 1
Annual mean temperature
°C
Maximum temperature of the warmest month Minimum temperature of the coldest month Annual mean precipitation
°C
BIO 6 BIO 12 BIO 15
0.6
°C mm
Precipitation seasonality (Coefficient of variation)
0.5 NDVI
BIO 5
0.7
0.4
0.3
0.2
0.1
(B) NDVI predictors MavND
Maximum average NDVI
SD
Standard deviation of NDVI
CV
Coefficient of variation
%
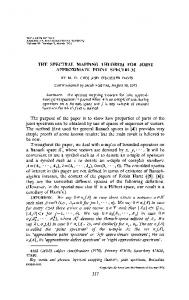
3. RESULTS AND DISCUSSION Figure 1a shows 11 selected and at the bottom all 45 generated NDVI profile classes. For clarity, only annual averages of the 7year profiles are presented in the figure. The variation in behaviour between profiles differs considerably (1a). Figure 2b suggests that in July a gradual gradient exists from rather low to very high NDVI values. Possibly this relates to a weather defined gradient based on latitude and/or altitude. 0.9
0.8
0.7
0.6
0.4
0.3
0.2
0.1
Nov
Sep
Jul
May
Mar
0 Jan
NDVI
0.5
Average Profiles (1998-2005)
Nov
Sep
Jul
May
-0.1
Table 1: List of environmental predictors used to model herpetological species distributions
-0.1
Mar
Jan
0
Average Profiles (1998-2005)
Figure 1a: Selected averaged annual SPOT NDVI-Profile classes, Figure 1b:All 45 NDVI-Profiles generated for the specified area (see Fig.2). Equally different is the area presented by each of the profiles (Figure 2). The map indicates a clear spatial stratification that is caused by a combination of weather, soil, terrain, and land use characteristics. This logic can be reversed: the NDVI-profiles reflect and are good indicators of the environment in which the ecosystems occur. Use of the temporal dimension and NDVI values as an index for habitat / ecosystem functioning, provides an untapped stratification tool for mapping. The down-side is that the product has a scale of 1:250.000 at best. A key for effective monitoring and studying of natural resources is to define map units ‘of interest’ on the basis of their behaviour in time as can be detected by the chosen procedure.
9°W
8°W
7°W
6°W
Figure 2. Spatial location of the shown 11 NDVI-Profile classes (see Fig.1), presented besides a 90m SRTM DEM product. In total, of the area shown, 45 classes were prepared (user specified number).
43°N
Amphibian and Reptile species distribution maps were derived from the “Anfibios y Reptiles de España” Atlas (Pleguezuelos et al., 2004). For each species, the distributional data was aggregated at a 10 x 10 km UTM resolution sampling grid following the European network of meshes approach, albeit at 10 km2 resolution (Gasc J. -P. et al., 2004). The observations are coded in a binary format i.e. presence/absence (1 & 0). The database contains > 5,000 observations pertaining to the 67 herp species.
42°N
41°N
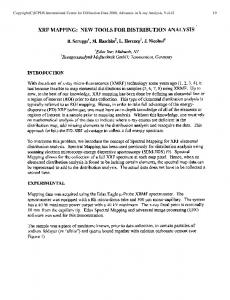
Generalised Linear Models (Chambers & Hastie, 1992; Gill, 2000; McCullagh & Nelder, 1989) were used to fit different models using the S-Plus® software for the NDVI-profile class data, as well as the climate data (Table 1). A typical result is detailed (for the Spanish data set) for the distribution (figure 3a) for a species Salamandra salamandra modelled using climate data (figure 3b) and NDVI data (figure 3c).
40°N
39°N
38°N
(a)
(b)
37°N
9°W
8°W
7°W
6°W
9°W
8°W
7°W
6°W
(c) S. salamandra Probability of species's occurence (%)
´
0 - 10 11 - 20 21 - 30 31 - 40 41 - 50
43°N
51 - 60
0
155
310
61 - 70 71 - 80
620 Kilometers
1:10,000,000
81 - 90 91 - 100
42°N
UTM Projection: Zone 30 N
Figure 3: Spatial distribution of Salamandra salamandra in Spain (a) documented distribution on 10 x 10 Km UTM square, 1981 – 1997 (b) predicted distribution by climatic model (10 x 10 Km resolution), (c) predicted distribution by NDVI model (10 x 10 km resolution).
41°N
40°N
39°N
38°N
Figure 4: Spatial distribution of the Mediterranean distribution on 10 x 10 Km UTM square, 1981 – 1997 predicted distribution by NDVI model.
37°N
9°W
8°W
7°W
6°W
Since the species dataset used in this study was sufficiently large (> 5,000 observations), we could use a quasi-independent dataset for evaluation purposes. This was obtained by randomly splitting the original dataset into a training (n = 1000) and test (n = 1000) set – ‘split-sample approach’. The accuracy of the models were tested using the kappa statistic (Cohan, 1960; Skidmore) and presented in Tables 1 and 2.
4. DISCUSSION
Remotely-sensed NDVI indices were less accurate predictors of herpetological species distributions compared to eco-climatic parameters (Table 1 and 2). This concurs with Said et al., (2003) who found similar results when comparing climate vs. NDVI in predicting mammalian species richness in East Africa. These results are consistent with natural history for these taxon groups as temperature is known to be important for explaining reptile distributions while humidity (and vegetation cover) plays the same role for amphibians (Gasc J. -P. et al., 2004). Visually, maps based on NDVI indices also appear less smooth compared to those based on climate. This could be attributed to the fact that climate depicts less variation over short distances compared to the high variability of vegetation cover which manifests itself by more contrasted values over proximate cells in the NDVI images. The results raise some interesting issues about further field sampling for biological data, and their spatial analysis. The larger the measuring or collecting ‘grid’, the more species are counted. This will give often a wrong impression of the diversity and richness of a certain area. For example, a 5x5 meter sample area might contain 1 lizard-species and may be 2 animals of that species, while in a 10x10 meter sample 10 animals of the same species might be present, but only 1 animal of another species. A snake might ‘pass by’ in that sample, but the next hour it might be elsewhere. All is depending on the habitat requirements and niche-size, but on the territorium size as well. So what are the best and most reliable distribution maps to represent biodiversity and species richness of a certain region? The issue of niche- and territorium size is a complicated matter. It looks like there might be a relationship between body size and territorium size. Which is understandable, as most amphibians and reptiles are predators and the larger the animal, the more insects or other prey they need.
the animals, reptiles even become ovoviviparous and get a darker skin-colour. Therefore, it might be possible to predict the maximum body-weight under a certain climatological conditions. In addition the solar radiation of a location will be a critical factor in modelling biodiversity. As described above, the different climatological factors like temperature (air and surface), radiation, exposure, humidity, will have a strong influence on daily activity. It might be possible to predict the daily time-interval (per season , month or week) when amphibians or reptiles can be observed during their daily activities (e.g., in the morning (warming-up and fouraging), a mid-day rest (hiding because of to hot) and afternoon activity). This is likely very much correlated/determinated by their most efficient metabolic rate in relation to the environmental/climatological variables. References Archer, E.R.M., 2004, Beyond the “climate versus grazing” impasse: using remote sensing to investigate the effects of grazing system choice on vegetation cover in the eastern Karoo. Journal of Arid Environments 57: 381-408. Box, E. O., Holben, B. N., & Kalb, V. (1989). Accuracy of AVHRR vegetation index as a predictor of biomass, primary productivity and net CO2 flux. Vegetatio, 80, 71-89. Brand S. and Malhus T.J., 2004, Evaluation of AVHRR NDVI for monitoring intra-annual and interannual vegetation dynamics in a cloudy environment (Scotland, UK). In: Proceedings of the XXth ISPRS Congress, Commission-II, 12-23 July 2004 Istanbul, Turkey. 6pp.
Budde M.E., Tappan G., Rowland J., Lewis J. and Tieszen L.L., 2004, Assessing land cover performance in Senegal, West Africa using 1-km NDVI and local variance analysis. Journal of Arid Environments 59: 481-498. Cayrol P., Chehbouni,A., Kergoat L., Dedieu G., Mordelet P. and Nouvellon Y., 2000, Grassland modelling and monitoring with SPOT-4 Vegetation instrument during the 1997-1999 SALSA experiment. Agricultural and Forest Meteorology 105: 91-115. Cohen, J. (1960). A coefficient of agreement for nominal scales. Educational Psychology Measurement, 20, 37 - 46. Connell, J. H. (1978). Diversity in tropical rainforests and coral reefs. Science, 199, 1302 - 1310. Currie, D. J. (1991). Energy and large-scale patterns of animal and plant species richness. American Naturalist, 137, 27-49.
Habitat preferences/requirements is another factor influencing the nice and/or territorium size. Amphibians are mostly waterbound, especially during the breeding season, afterwards most of them prefer moist environments. While most reptiles are less or not water-bound, etc., but may be more restricted to food availability (insects, mice) or the presence of hiding places, shelter, e.g., rocks, holes in the soil, dead leaves. These factors need to be built into further analysis of these data sets.
Drenge H.E. and Tucker C.J., 1988, Green biomass and rainfall in semi-arid sub-Saharan Africa . Journal of Arid Environments 15: 245-252.
Another interesting issue is the relation between body size/weight, daily activity and climate. Under certain climatological conditions the daily activity of amphibians and reptiles might be limited and this might have consequences concerning the possibility to gather enough food or to reproduce. It is known that the colder the climate, the smaller
ERDAS, 2003, ERDAS Field Guide. 7th ed. GIS & Mapping, LLC Atlanta, Georgia & Leica Geosystems GIS & Mapping, LLC. 698 pp.
Eerens H., Kempeneers P., Piccard I. and Verhuen Y., 2001, Crop monitoring and yield forecasting with NOAA-AVHRR or SPOT-Vegetation. http://www.geosuccess.net/geosuccess/documents/Dry_Matter_Producti vity.pdf (accessed 8 Dec’04).
Gasc J. -P., Cabela, A., Crnobrnja-Isailovic, J., Dolmen, D., Grossenbacher, K., Haffner, P., Lescure, J., Martens, H.,
Martinez Rica, J. P., Maurin, H., Oliveira, M. E., Sofianidou, T. S., Veith, M., & Zuidrewijk, A. (Eds.). (2004). Atlas of Amphibians and Reptiles in Europe. Paris: Museum National d'Histoire Naturelle. Gaston, K. J. (2000). Global patterns in biodiversity. Nature, 405, 220-227. Gorham B., 1998, Mapping multi-temporal agricultural land use in Mississippi Alluvial valley of Arkansas. In: Proceedings of the Spatial Technologies in Agricultural and Natural Resources: SRIEG-10 Annual Conference, Global Hydrology and Climate Centre, Huntsville, USA. Groten S.M.E.and Ocatre R., 2002, Monitoring the length of the growing season with NOAA. International Journal of Remote Sensing 23.14: 1271-1318. Hijmans, R. J., Cameron, S. E., Parra, J. L., Jones, P. G., & Jarvis, A. (2004). The WorldClim interpolated global terrestrial climate surfaces. Version 1.3. Retrieved September, 2005, from http://biogeo.berkeley.edu/ Hill M.J. and Donald G.E., 2003, Estimating spatio-temporal patterns of agricultural productivity in fragmented landscapes using AVHRR NDVI time series. Remote Sensing of Environment 84: 367-384. Jörgensen, A. F., & Nohr, H. (1996). The use of satellite for mapping of landscape and biological diversity in the Sahel. International journal of remote sensing,, 17, 91-109. Justice C.O., TOWNSHEND J.R.G., HOLBEN B.N. and TUCKER C.J., 1985, Analysis of the phenology of global vegetation using meteorological satellite data. International Journal of Remote Sensing 6: 1271-1318. Ledwith M., 2000, Land cover classification using SPOT Vegetation 10-day composite images – Baltic Sea catchment basin. http://www.lantmateriet.se/cms/files/pdf/pdf/ geografisk_information%5CMMA_article_glc2000.pdf (accessed 8 Dec’04). Maggi M. and Stroppiana D., 2002, Advantages and drawbacks of NOA-AVHRR and SPOT-VGT for burnt area mapping in a tropical savannah ecosystem. Canadian Journal of Remote Sensing 28.2: 231-245. Mseli, F., 2004, Monitoring forest conditions in a protected Mediterranean coastal area by analysis of multiyear NDVI data. Remote Sensing of Environment. 89: 423-433. Murakami, T., Ogawa S., Ishitshuka N., Kumagai K. and Saito G., 2001, Crop discrimination with multi-temporal SPOT/HRV data in the Saga Plains, Japan. International Journal of Remote Sensing 22.7: 1335-1348. Oindo, B., De By, R. A., & Skidmore, A. K. (2000). Interannual variability of NDVI and bird species diversity in Kenya. International journal of applied earth observation and geoinformation, 2, 172-180. Oindo, B., & Skidmore, A. K. (2002). Interannual variability of NDVI and species richness in Kenya. International journal of remote sensing,, 23, 285-298. Owen, J. G. (1988). On productivity as a predictor of rodent and carnivore diversity. Ecology, 69, 1161-1165. Owen, J. G. (1989). Patterns of Herpetofaunal Species Richness: Relation to Temperature, Precipitation and Variance in Elevation. Biogeography, 16(2), 141-150.
Pianka, E. R. (1983). Evolutionary ecology. New York: Harper and Row. Rosenzweig, M. L., & Abramsky, Z. (1993). How are diversity and productivity related? In R. E. Ricklefs & D. Schulter (Eds.), Species diversity in ecological communities. Historical and geographical perspectives (pp. 52-65). Chicago: University of Chicago Press. Ringrose S., Vanderpost C. and Mattherson W., 1996, The use of integrated remotely sensed and GIS data to determine the causes of vegetation cover change in southern Botswana. Applied Geography 16: 225-242. Said, M. Y., Skidmore, A. K., de Leeuw, A. J., Aligula, H. M., Kumar, L., & Prins, H. H. T. (2003). Analysis of relation between ungulate species richness in East Africa and climatic and remotely sensed productivity indices. Journal of African Ecology. Sarkar, S. and Kafatos M., 2004, Inter-annual variability of vegetation over the Indian sub-continent and its relation to the different meteorological parameters. Remote Sensing of Environment 90: 268-280. Selllers, P.J., 1985, Canopy reflectance, photosynthesis and transpiration. International Journal of Remote Sensing 6: 13351372. Sousa, , C.Jr., Firestone, L., Silva L.M. and Roberts D., 2003, Mapping forest degradation in the eastern Amazon from SPOT 4 through spectral mixture models. Remote Sensing of Environment 87: 494-506. Swain P.H., 1973, Pattern Recognition: A Basis for Remote Sensing Data Analysis (LARS Information Note 111572). The Laboratory for Applications of Remote Sensing, Purdue University, West Lafayette, Indiana. Uchida, S., 2001, Discrimination of Agricultural Land use using mulit-temporal NDVI data. In: Proceedings of 22nd Asian Conference of Remote Sensing. Singapore, Centre for Remote Imaging, Sensing and Processing (CRISP). 5-9 Nov. Vol 2: 813-818. Unganai, L.S. and Kogan F.N., 1998, Drought Monitoring and Corn Yield estimation in Southern Africa from AVHRR Data. Remote Sensing of Environment 63: 219-232. Walker, P. A., Stoms, D. M., Estes, J. E., & Cayocca, K. (1992, 3 - 7 March). Improved modelling of biological diversity with multi-temporal vegetation index data. Paper presented at the Annual meeting of ASPRS/ACSM, Albuquerque, New Mexico. Weiss J.L., Gutzler D.S., Coonrod J.E.A.and Dahm C.N., 2004, Long-term vegetation monitoring with NDVI in a diverse semiarid setting, central New Mexico, USA. Journal of Arid Environments (in Press). Wright, D. H., Currie, D. J., & Maurer, A. (1993). Energy supply and patterns of species richness on local and regional scales. In R. E. Ricklefs & D. Schulter (Eds.), Species diversity in ecological communities. Chicago: University of Chicago Press.
Table 1: NDVI predictors and their proportion of explained deviance for individual species. Parameters
Selected herp species
Threshold Kappa cal Kappa eva
Lacsh 0.25 0.39 0.32
Blacin 0.25 0.12 0.10
Viplat 0.11 0.10 0.10
Maccuc 0.07 0.01 0.01
Alycis 0.20 0.31 0.25
Alyobs 0.38 0.28 0.24
Hylarb 0.17 0.17 0.15
Hylmer 0.13 0.08 0.07
Salsal 0.37 0.50 0.41
Tribos 0.25 0.32 0.34
Table 2: Selected climatic predictors and their proportion of explained deviance for individual species. Parameters
Selected herp species Lacsh
Blacin
Viplat
Maccuc
Alycis
Alyobs
Hylarb
Hylmer
Salsal
Tribos
Kappa cal
0.60
0.45
0.27
0.31
0.35
0.56
0.28
0.50
0.44
0.30
Kappa eva
0.58
0.37
0.29
0.35
0.31
0.49
0.25
0.47
0.42
0.34