Page 1 of 44 Articles in PresS. J Appl Physiol (October 18, 2007). doi:10.1152/japplphysiol.00519.2007
HETEROGENEITY OF BRONCHOCONSTRICTION DOES NOT DISTINGUISH MILD ASTHMATIC SUBJECTS FROM HEALTHY CONTROLS WHEN SUPINE David A. Kaminsky, Charles G. Irvin, Lennart K.A. Lundblad, John Thompson-Figueroa, Jeffrey Klein*, Michael J. Sullivan, Frank Flynn*, Sherburn Lang, Lorraine Bourassa, Stephanie Burns, Jason H.T. Bates Vermont Lung Center, University of Vermont College of Medicine, Burlington, VT USA *Dept. of Radiology, University of Vermont, Fletcher Allen Health Care, Burlington, VT USA Running Title: Lung Heterogeneity by Forced Oscillations and CT Correspondence should be addressed to: David A. Kaminsky, M.D. Pulmonary Disease and Critical Care Medicine University of Vermont College of Medicine Given D-302, 89 Beaumont Avenue Burlington, VT 05405 Tel (802) 656-8819, Fax (802) 847-8194, email:
[email protected]
Copyright © 2007 by the American Physiological Society.
Page 2 of 44
1
ABSTRACT Heterogeneity is a fundamental property of airway constriction; however, whether it is a distinguishing feature of mild asthma is not clear.
We used computerized tomography
and the forced oscillation technique to compare lung heterogeneity between 18 mild asthmatic and 19 healthy control subjects at similar levels of bronchoconstriction while supine. We also assessed the effects of deep inhalation and albuterol on supine lung mechanics. Measures of heterogeneity included lung attenuation, from which we derived a novel index of airspace size, and the frequency dependence of respiratory system resistance between 1-20 Hz.
We found that asthmatic subjects had airways
hyperresponsiveness to methacholine in the sitting position compared to controls, but both groups had similar falls in FEV1 after inhaling methacholine while supine. There were no baseline differences between the groups in the frequency dependence of resistance, or lung attenuation, before methacholine, and both groups responded similarly with an increase in airspace size (+9.2% vs. +3.4%), airspace size heterogeneity (+9.8% vs. +4.2%), and frequency dependence of resistance (+76% vs. +86%) after methacholine.
Deep inhalation did not affect resistance in either group, but albuterol
significantly reduced resistance in both groups. We conclude that both computerized tomography and the forced oscillation technique demonstrate increased heterogeneity of airway narrowing during induced bronchoconstriction while supine, and that this heterogeneity is equivalent between subjects with mild asthma and healthy controls when bronchoconstricted to the same degree. Thus, heterogeneity appears to be a fundamental feature of bronchoconstriction, and is not unique to mild asthma.
Page 3 of 44
2 Key Words:
Respiratory system impedance, frequency dependence, lung attenuation,
airways hyperresponsiveness, supine, deep inflation
Page 4 of 44
3 INTRODUCTION Heterogeneity
is
a
fundamental
feature
of
bronchoconstriction
in
humans.
Heterogeneous bronchoconstriction has been observed by various imaging modalities as well as implicated by computational modeling of lung impedance measured by the forced oscillation technique (FOT). King and colleagues used computerized tomography (CT) to show that large airways narrow heterogeneously in response to inhaled methacholine in both asthmatic and healthy subjects (24). Venegas and colleagues imaged the lungs of asthmatics using positron emission tomography (PET) and obtained ventilation maps from which they inferred that regions of poor ventilation were caused by heterogeneous narrowing of local groups of interacting small airways (47). Similarly dramatic heterogeneous ventilation defects have been demonstrated in the lungs of asthmatics using magnetic resonance (MR) imaging of inhaled hyper-polarized helium (41). Heterogeneity of bronchoconstriction has important physiologic consequences that add to the work of breathing, reduce the efficiency of gas exchange and contribute to airways hyperresponsiveness (15). One of the functional effects of heterogeneity is an increase in the frequency dependence of respiratory system resistance (Rrs) below about 20 Hz, accompanied by variable effects on the frequency dependence of respiratory system elastance (Ers) (22, 30, 46).
While heterogeneity is clearly a feature of bronchoconstriction in humans, the extent to which heterogeneity distinguishes healthy subjects from those with asthma, independent of the degree of overall airway constriction, remains unclear. The study by King and colleagues addressed this question by comparing the heterogeneity of airway narrowing
Page 5 of 44
4 between healthy and asthmatic subjects, and found that heterogeneity was greater in asthmatics for airways > 2mm in diameter, but not for smaller airways (24). Yet, imaging studies using PET (45, 47), and modeling of lung impedance (6, 21, 30, 46), implicate narrowing of small, peripheral airways as a key feature of asthma. These airways cannot be visualized directly by CT. However, the consequences of such peripheral airway narrowing include airtrapping and hyperinflation, together with the reduced blood flow that occurs as a result of local hypoxic vasoconstriction (19). These factors all cause decreases in the CT attenuation of the lung parenchyma. The relative degree and heterogeneity of CT attenuation changes would therefore reflect the degree and heterogeneity of peripheral airway narrowing.
With this rationale in mind, we compared the heterogeneity of peripheral airway narrowing in healthy subjects and those with mild asthma at similar degrees of bronchoconstriction by measuring changes in CT attenuation of the lung parenchyma, and changes in Rrs and Ers using the FOT. Because our study design necessarily required subjects to be supine, our findings relate specifically to a comparison of structural and functional heterogeneity between healthy and asthmatic subjects in the supine position. METHODS Experimental Techniques Subjects: We recruited subjects with asthma and non-asthmatic, healthy control subjects. Based on the expected variability of Rrs (22, 23), and HU parenchymal density (18), we
Page 6 of 44
5 estimated that a sample size of 12 subjects per group would be needed to detect changes of 50% in Rrs and 10% in HU density with 80% power. We defined asthmatic subjects based on NIH guidelines (35) with the following characteristics:
no history of
cardiopulmonary disease other than asthma, no smoking within the last 3 years and less than a total of 5 pack-years, and positive methacholine challenge defined as a provocative concentration of methacholine causing a 20% fall in the FEV1 (PC20) < 8 mg/ml. Nonasthmatic control subjects met the same criteria except they had no history of asthma and had a PC20 > 16 mg/ml. Subjects were excluded from testing if they had had an upper respiratory infection within the last 4 weeks. Subjects with asthma had to withhold any short-acting bronchodilators for 8 hours and any long-acting bronchodilators for 24 hours prior to any testing. Female participants had to prove they were not pregnant by urine pregnancy testing. All subjects provided written, informed consent, and the Institutional Review Board of the University of Vermont approved the study. All subjects underwent a first visit during which we obtained baseline history and performed a physical examination. We also measured spirometry and performed a methacholine challenge using the 5 deep breath method (3), all while subjects were seated. Qualified participants then returned for a second visit during which we performed concurrent measurement of Zrs and lung imaging by CT as outlined in Figure 1. We evaluated a total of 18 asthmatic and 19 control subjects (Table 1). The two groups were similar in age, sex and baseline sitting FEV1, but the asthmatic subjects had a lower FEV1/FVC. The geometric mean PC20 of the asthmatic group at baseline, sitting, was 0.96 mg/ml, with a range of 0.02-7.2 mg/ml. None of the asthmatic subjects was on controller therapy; all used albuterol only as needed and witheld their medication
Page 7 of 44
6 according to protocol prior to all testing. All control subjects had a PC20 > 16 mg/ml while sitting. Lung Function Testing: Spirometry was performed according to standard guidelines with a commercial flow sensor (32) (Medical Graphics Corp., St. Paul, MN). Respiratory system impedance (Zrs) was measured by the FOT (23, 38, 39) using a modified computer-controlled piston ventilator (flexiVent, SCIREQ, Montreal) to deliver a 16 s oscillatory perturbation in volume (V) at the mouth. The measured V signal was obtained by multiplying the cross-sectional area of the ventilator piston by its displacement waveform, which consisted of 13 sine waves having mutually prime frequencies between 1.0-20.5 Hz. V had a peak-peak amplitude of 20-50 ml. Pressure (P) on the proximal side of the mouthpiece was measured with a piezoresistive pressure transducer embedded in the ventilator piston assembly. P and V measured during the 16 s oscillatory period were low-pass filtered at 30 Hz and sampled at 256 Hz. Subjects were instructed to suspend their breathing at end-tidal exhalation prior to commencement of measurement, and to remain relaxed while the V perturbations were delivered. In addition to nose clips, we had all subjects wear a custom made, firmly fitted mask to support their cheeks in order to minimize upper airway shunting (13). We performed a number of test runs in each subject to allow them to practice relaxation during application of the perturbations in V. Inadequate relaxation manifested as a noticeable increasing or decreasing trend in P over the 16 s measurement period, and we aborted such trials. At least 2 satisfactory measurements of Zrs were made for each subject under each experimental condition.
Page 8 of 44
7 CT Imaging: CT scans of the chest were performed during suspended breathing at endtidal exhalation in order to correspond to the conditions under which Zrs was measured. We confirmed stable end-tidal lung volume during the scans by monitoring subject breathing through a spirometer (25). Subjects were able to practice the breath-hold maneuver until they were comfortable performing it. Only when a proper breath-hold was observed did we perform the CT scan using a 16 slice helical scanner (Philips MX8000). Scans were centered approximately 4 cm below the main carina, and were focused on the right lower lobe. We chose this region for a number of reasons. First, the right side was selected in order to minimize motion artifact from cardiac activity. Second, the lower lobe was selected to focus on a dependent region that would optimize detection of changes in lung attenuation from air trapping or altered blood flow. Third, we only looked at the lower lobe, as opposed to the whole lung, in order to minimize any changes in lung attenuation from gravitational effects, which can be substantial in subjects with asthma (8). Fourth, because we purposely designed a very low dose radiation protocol to limit exposure, we reconstructed the images to a small field of view to maximize resolution and optimize visualization of density variations in the parenchyma. We obtained 16 slices of 1.5 mm thickness each, with a gantry rotation time of 0.75 s, for a total scan width of 24 mm. The x-ray parameters used were 120 kVp and 40 mA.
By design, this acquisition technique was not sufficient for reliable
measurement of airway dimensions. Instead, we inferred the extent and variability of peripheral airway narrowing based on attenuation measurements of the lung parenchyma (see below). One asthmatic participant was unable to tolerate the FOT when supine, so CT scanning was not performed on this subject.
Page 9 of 44
8 Protocol:
The objective of the protocol (Figure 1) was to obtain concurrent
measurements of Zrs and CT lung attenuation before and after inhalation of methacholine, as well as to determine the effect of deep inhalation (DI) and inhaled albuterol on Zrs. Since we used CT data as one measure of heterogeneity, all subjects were supine for administration of methacholine and the use of the FOT. First, subjects performed spirometry while seated, in order to confirm stability of lung function compared with baseline testing. If lung function was within 10% of baseline measurements, subjects then underwent the FOT while sitting. This usually involved a number of trials to allow the subjects to become comfortable and successful with the technique. Subjects then lay down on the CT gantry table and were carefully positioned with their arms over their heads, where they remained for all subsequent FOT measurements and CT imaging. We next obtained baseline supine measurements of Zrs, and then positioned the gantry inside the CT scanner, without the subjects changing body position, to obtain baseline CT imaging. The gantry was then moved back out of the scanner, and spirometry was performed to assess baseline lung function in the supine position. We then had each subject inhale 5 deep breaths of nebulized methacholine while they remained supine. We used the individual PC20 concentration of methacholine, as determined during the screening day, for each of the asthmatic subjects, and 16 mg/ml for each of the control subjects. Because we were interested in comparing the responses to methacholine in asthmatic and control subjects, we needed to select a dose of methacholine to which the control subjects would respond.
Knowing that healthy
subjects have increased responsiveness when supine (42), we chose the highest
Page 10 of 44
9 concentration of methacholine to which the control subjects had not responded when upright (16 mg/ml). Preliminary work showed that, while supine, these control subjects indeed reacted to 16 mg/ml of methacholine with a similar mean change in FEV1 (see Results) as the asthmatics had when they inhaled their upright PC20 dose of methacholine while supine. This serendipitous observation led to our choosing the 16 mg/ml dose for all control subjects, thus allowing us to compare the CT and FOT responses when both groups were bronchoconstricted to similar degrees. Two min after the methacholine administration, we repeated the FOT measurements, immediately followed by a second CT scan of the same anatomic zone as the baseline scans. This second CT scan took place 3-4 min after completion of the methacholine inhalation. We next repeated the FOT after the subjects took 3 consecutive DI’s to TLC, and then had the subjects perform spirometry again. These spirometric measurements took place approximately 5 min after completion of the methacholine challenge. We then administered two inhalations of albuterol (180 mcg) via a metered dose inhaler through a spacer, again while subjects remained supine, and performed the FOT 5 min later. Finally, subjects sat upright and a final set of spirometry measurements were made in order to determine that lung function had returned to within 10% of baseline prior to discharge from the CT suite. Data Analysis Spirometry: Spirometry values were measured in absolute terms and converted to a percentage of the predicted values based on data from Hankinson and colleagues (20).
Page 11 of 44
10 Zrs by FOT: Calculation of Zrs from the FOT measurements of P and V was complicated by the fact that many subjects experienced difficulty remaining relaxed with an open glottis throughout the entire 16 s oscillation period. Furthermore, subjects differed in where they were most relaxed during the measurement period; some subjects settled down quickly and produced their best data early on, while others took a few seconds to relax properly and so produced their best Zrs measurements toward the end of the 16 s measurement period. We therefore searched each 16 s data set for the 8 contiguous seconds during which the subjects were most relaxed. This was achieved by first smoothing both P and V signals with a 1 s running mean and reducing the sampling rate from 256 to 128 Hz. Next, Zrs was calculated within 8 s windows spaced 1 s apart across the 16 s data set, and the Zrs with the highest mean coherence across all frequencies was retained. Within each 8 s window, we calculated the ensemble averages of P(f)V*(f) and V(f)V*(f) using 2 s windows overlapping by 50%, where P(f) and V(f) are the fast Fourier transforms of P and V, respectively, * denotes complex conjugation, and f is frequency in Hz. Zrs was then calculated as –iP(f)V*(f)/2 V(f)V*(f), where i is the positive square root of -1. We initially sought to fit Zrs to the constant phase model proposed by Hantos and colleagues (21).
However, this model did not fit the imaginary part of Zrs well.
Therefore, instead, we empirically fit a hyperbolic curve only to the real part of Zrs, as
Rrs = A +
where A, B and
B (2 f )
(1)
are constants and f is frequency. Curve fitting was achieved by
minimizing the squared residuals weighting each data point inversely to its coherence. Thus we used all the data, but allowed the more reliable points to have a stronger role in
Page 12 of 44
11 generating the fitted curve (Eq. 1). We then extracted from the fitted curve the values of Rrs at 1 Hz and 20 Hz, denoted R1 and R20, respectively, and quantified the frequency dependence of Rrs as the difference R1 - R20 (10). We calculated elastance (Ers) as a function of f as -2 fXrs(f), where Xrs is the imaginary part of impedance. Because the Ers data were more highly variable than the Rrs data, consistent curve fits were not reliable.
Instead, we plotted Ers vs. frequency and
categorized the pattern according to the Type A and B designations given by Kacska and colleagues (22). Specifically, if the baseline, sitting data became more negative with frequency, then this pattern was defined as Type A, and if the baseline, sitting data became more positive with frequency, then this pattern was defined as Type B. The FOT data from one asthmatic participant were unacceptable due to low coherence and were excluded from analysis. Another asthmatic participant was unable to tolerate the FOT while supine. The FOT data from one control subject at baseline and another following methacholine were also unacceptable due to low coherence and were excluded from analysis. Airspace Dimensions Based on CT Imaging: Once we isolated the region of interest in the right lower lobe, we registered it to the same lung region pre- and post-methacholine in each subject by visually matching anatomic landmarks such as blood vessels and larger airways (Fig. 2A).
We then
calculated a histogram of Hounsfield units (HU) less than -300 within each region of interest (Fig. 2B, Left), as this corresponds to the parenchyma (17, 36). However, because HU cannot be less than -1000, the HU histogram can give a distorted view of
Page 13 of 44
12 changes in regional heterogeneity of lung aeration. For example, when more pixels occupy similar, low attenuation values, then the mean HU density will fall and the variance (standard deviation, SD) will also fall, suggesting more homogeneity of lung density. However, this may not reflect the variance in underlying airspace dimensions, which we felt was a more physically meaningful notion. We assumed that the variation in airspace dimensions would reflect (inversely) the corresponding dimensions of the peripheral airways leading to that region. In other words, as peripheral airways narrow to different degrees, then more air may be trapped distal to them depending on the degree of narrowing. This air trapping would result in larger airspaces that would vary inversely in size according to the degree of peripheral airway narrowing. However, the pixel density of these regions may be quite similar since there is a finite limit of density distribution. Therefore, in order to relate changes in HU pre- and post-methacholine to changes in regional aeration of the lung in a more effective, physical manner, we constructed a simple, computational model of the lung parenchyma.
We considered the lung
parenchyma as a foam of identical space-filling cubic alveoli having internal side length a. The airspace volume within each alveolus, which varies with regional aeration, is thus a3. The tissue volume per alveolus, Vtis, is assumed to remain constant in the setting of airtrapping. Assuming the CT image pixel dimensions are substantially greater than those of each alveolus, we can relate HU to the average air/tissue fraction within a pixel. With HU = 0 for tissue and HU = -1000 for air, the pixel air fraction is a3 HU = 1000 a 3 +Vtis
or
(1)
Page 14 of 44
13
a3 HU V = 3 tis a 1000 +1 Vtis
(2)
so that
a -HU =3 . 3 V HU +1000 tis
The quantity
3
(3)
a , which can be calculated from HU using Eq. 3, is thus an estimate of Vtis
the mean linear airspace dimension (LAD) within each pixel. Using Eq. 3 we therefore converted the HU histograms to histograms of
standard deviation (SD) of the
3
3
a (Fig. 2B, Right). The mean and Vtis
a histograms were taken as global measures of the Vtis
size and distribution of LADs across the examined lung. We thus defined airspace heterogeneity as the SD of LAD (LAD-SD). Statistics: All demographic, spirometry, and CT attenuation results are reported as means +/- SD, and PC20 is reported as geometric mean and range. All FOT data and LAD data are reported as median (25-75 interquartile range). Statistical comparisons were made using student’s t-test or Wilcoxon rank test, as appropriate, and associations were measured with Spearman rank correlation. We did not formally analyze the Ers by statistical methods due to extreme variability in response of this parameter. Instead, we made only descriptive comparisons.
To quantify the effects of methacholine, we
compared supine lung function after methacholine to supine baseline measurements.
Page 15 of 44
14 Likewise, to determine the effects of DI and albuterol, we compared lung function after DI and albuterol to post-methacholine measurements.
Finally, we measured post-
albuterol spirometry when upright again to assess any change from baseline upright values and thus ensure sufficient return of lung function to normal prior to discharge from the protocol. All p-values are two-sided and values < 0.05 were considered statistically significant. All statistical analyses were performed using a statistical software package (JMP; SAS Institute Inc., Cary, NC). RESULTS
Lung Function Upon lying down, both subject groups experienced significant falls in FEV1, but these changes were not significantly different between the two groups (Table 2). When the asthmatic subjects each inhaled their individual, sitting PC20 concentration of methacholine while in the supine position, they demonstrated a mean fall of 21 ± 15% in FEV1 compared to baseline supine values.
This was similar to the response they
exhibited to the same concentration in the sitting position; however, the total, cumulative dose of methacholine had actually been higher in the sitting position because subjects had undergone a full methacholine challenge. The control subjects demonstrated a nearly identical mean fall (20 ± 11%) in FEV1 in the supine position when they each were challenged with a dose of methacholine of 16 mg/ml. However, this same concentration had caused little fall in FEV1 (mean fall = 6 ± 4%) while sitting. As with the asthmatic subjects, this one time concentration was less than the cumulative dose the control subjects had inhaled during the full methacholine challenge done while sitting. Thus, the
Page 16 of 44
15 supine position increased reactivity to methacholine in both the asthmatic and nonasthmatic subjects.
Because both groups had essentially the same change in FEV1
following methacholine while supine, we were able to compare the heterogeneity of the response at similar levels of bronchoconstriction. At baseline, sitting, R1, R20 and R1-R20 were similar between asthmatic and control subjects (Table 1), and none of these parameters changed significantly upon lying down (Table 2). Following methacholine inhalation, both groups had significant increases in R1, but only the control subjects had a significant increase in R20 (Table 2). For both groups combined, the change in R1 after methacholine correlated with the change in FEV1 after methacholine (Spearman rho=-0.38, p=0.03).
Both groups significantly
increased R1-R20 after methacholine, indicating a substantial increase in frequency dependence, and this also correlated with the change in FEV1 after methacholine (Spearman rho=-0.38, p=0.03) for both groups combined. The changes in R1 and R20 were not significant after DI in either group, but the changes in both parameters, as well as R1-R20, were significant after albuterol in both groups. There were no significant differences in any of the responses comparing asthmatic and non-asthmatic subjects. These results are visually apparent in the plots of Rrs versus frequency shown in Figure 3. The Ers curves revealed that both asthmatic and control subjects displayed both types of patterns (Figure 4). For the subjects with Type A (n=6 asthmatics, 12 controls), the resonant frequency was typically around 5-10 Hz, whereas for the subjects with Type B (n=10 asthmatics, 6 controls), no resonant frequency was present. As shown in Figure 4, the responses to methacholine, DI and albuterol were fairly consistent among Type A
Page 17 of 44
16 subjects, but were highly variable (wider SE bars) among Type B subjects. When segregated by Ers pattern, the Type B subjects, both control and asthmatic, had higher baseline levels of Rrs (Figure 5).
However, the Type A asthmatic subjects had
significantly greater increases in R1, R20 and R1-R20 than the Type B subjects (asthmatic or control) or the Type A controls (data not shown). Otherwise, there were no significant differences between the asthmatic or control subjects in age, sex, FEV1,
FEV1 after
methacholine, PC20 or any of the CT or LAD parameters (data not shown). CT Imaging Baseline CT attenuation (Table 1) and changes in attenuation (Table 3) were very similar between groups. Methacholine inhalation caused the HU histograms of both controls and asthmatics to shift to the left, (Figure 2B, Left), with a decrease in mean HU (HU), indicative of increased air trapping or regional hypoperfusion due to local airway narrowing or closure. The HU histograms also became narrower, as seen by a decrease in the standard deviation of HU (HU-SD) in both groups. The values of mean LAD (LADmean) in asthmatic and control subjects were comparable at baseline, and increased significantly after methacholine, indicative of an increase in mean airspace dimension (Figure 2B, Right). However, unlike the distribution of HU, the standard deviation of LAD (LAD-SD), which was comparable between the groups at baseline, increased significantly after methacholine, indicative of an increased variability in airspace dimensions. The drop in FEV1, but not the change in R1, R20 or R1-R20, in response to methacholine correlated significantly with the change in HU, LAD and LAD-SD in asthmatic but not control subjects (Spearman rho = -0.68, p=0.003, rho=-0.70, p=0.002,
Page 18 of 44
17 rho=-0.64, p=0.006, respectively). There were no significant correlations between baseline values or changes in LAD-SD and R1-R20. DISCUSSION
The main findings of this study are that methacholine-induced bronchoconstriction in the supine position was manifested by concomitant increases in both structural (LAD-SD) and functional (R1-R20) measures of heterogeneity, and that both asthmatic and nonasthmatic subjects displayed similar increases in heterogeneity when constricted to equivalent levels (drop in FEV1 by ~ 20%). There was a weak correlation among all subjects between the overall degree of response as measured by FEV1 and the change in heterogeneity as measured by R1-R20. Likewise, there was a correlation between the change in FEV1 and the change in heterogeneity as measured by LAD-SD, but this occurred in the asthmatic subjects only.
However, for all subjects, there was no
correlation between the two different measures of heterogeneity themselves, R1-R20 and the LAD-SD. In addition, both asthmatic and control subjects displayed both A and B types of Ers patterns. Overall, while the asthmatic subjects clearly responded to a lower dose of methacholine compared to the control subjects, measures of heterogeneity did not distinguish between the two groups. These results demonstrate that CT imaging and the FOT reveal independent measures of heterogeneity, which are associated with airway narrowing but are not unique to mild asthma. A key component of our analysis is the use of CT to infer information about heterogeneity from the spatial distribution of HU values within the lung parenchyma. A number of other CT studies have measured changes in parenchymal x-ray densities
Page 19 of 44
18 following bronchoconstriction or anti-inflammatory therapy (9, 18, 19, 33, 36, 48), but none related these changes to heterogeneity of airspace size and corresponding peripheral airway narrowing. CT can also be used to study changes in the large airways (24, 27, 37). Indeed, heterogeneous reductions in the radii of large airways following bronchial challenge have been directly visualized in humans (11, 12, 24). Furthermore, King and colleagues (24) found greater heterogeneity among airways > 2mm in diameter in asthmatics compared to normal controls.
Also, Brown and colleagues (11) found that
large airway dimensions were closely correlated with FEV1/FVC and measures of airways hyperresponsiveness. In the present study, however, we focused on the changes in parenchymal lung density because the pattern and extent of peripheral airway narrowing are key components in determining overall lung mechanics (28, 29, 46). In addition, CT information about the lung periphery in asthma has not yet been compared with assessments of lung function beyond spirometry. Assessment of parenchymal lung density can also be made with a smaller x-ray dose than that required for measurement of airway dimensions. The analysis of the CT data was based on the hypothetical concept of the parenchyma consisting of a collection of equivalent airspaces each having a particular linear dimension a. This was necessary here because the width of the HU distribution is highly dependent on its mean; as the HU-mean decreases, the leftward spread of the histogram becomes progressively more confined by the hard lower limit of -1000. This explains why HU-SD decreased following methacholine (Table 3). To avoid this effect, we transformed the HU’s to a quantity related to a linear airspace dimension, a, which was now a function whose variability should no longer be directly related to its mean. Our
Page 20 of 44
19 results showed that the variability of airspace size, as measured by the SD of LAD, increased following methacholine (Table 3). We interpret this to mean that the airway narrowing that occurred proximal to these airspaces was, likewise, more heterogeneous following methacholine.
Nevertheless, it is important to realize that a is a purely
hypothetical quantity that merely serves to relate HU’s to an equivalent effective airspace size, so it cannot be related to any particular parenchymal structure. We used the FOT to assess the increase in heterogeneity in terms of the negative frequency dependence of Rrs below 20 Hz, which is thought to arise primarily from heterogeneous airway narrowing (28). While tissue resistance likely accounts for most of the frequency dependence of resistance and elastance at baseline, several studies have shown that airway inhomogeneities account for the majority of the frequency dependent changes in these parameters during bronchoconstriction (6, 21, 30, 46). The changes we saw in Rrs occurred predominately at low frequencies, indicating their location in the lung periphery (Figure 3). Interestingly, only the changes in R1, not R20, correlated with the changes in FEV1 after methacholine, suggesting that the common measure FEV1 reflects peripheral more than central airway resistance. Our findings of peripheral lung involvement are similar to those of Tgavalekos and colleagues (45) who obtained PET images and measured Zrs following challenge with inhaled methacholine in asthmatic subjects. Using an anatomically-based computational model of the lung, they found that both data sets could be explained in a consistent manner only if the model included constriction of airways < 2.4 mm diameter. Using a different computational approach, Venegas and colleagues (47) showed that the pattern of poorly ventilated areas seen in PET images can be attributed to self-organized clustering of highly constricted small
Page 21 of 44
20 airways. The results of the present study thus suggest that CT imaging also provides a view of regional heterogeneity in bronchoconstriction occurring at the small airway level. To determine whether other aspects of Zrs could distinguish asthmatic subjects from controls, we separated the baseline, sitting Ers data into two groups (Fig. 4) as suggested by Kaczka and colleagues (22). The group categorization was made on the basis of subjective judgment and is therefore somewhat arbitrary, but we can see an overall difference between the Type A subjects, with their tendency for baseline, sitting Ers to decrease at higher f (Fig. 4, left-hand panels), and the Type B subjects, in whom baseline, sitting Ers remains elevated (Fig. 4, right-hand panels). We found similar patterns of Ers in both healthy and asthmatic subjects when Rrs and Ers of the lung periphery were studied by applying the FOT through a wedged bronchoscope (23). In the present study, Type B subjects, both control and asthmatic, were generally characterized by higher baseline values of R1, R20 and R1-R20, likely reflecting overall increased airway resistance (Fig. 5). This finding is in accord with the explanation for the Type B pattern offered by Kaczka and colleagues (22). However, we report two additional features. First, the Type A asthmatic subjects seemed to be more reactive than the Type A controls or any of the Type B subjects, whether asthmatic or control. Perhaps the lower baseline peripheral resistance in Type A asthmatic subjects allowed a broader and deeper deposition of methacholine during inhalation. Second, the Type B subjects had more highly variable responses to sitting, methacholine, DI and albuterol than the Type A subjects. We believe this behavior may reflect the more complex interaction between peripheral airway resistance, tissue viscoelasticity and central airway shunting that computational modeling suggests are involved in the Type B subjects (22). Our finding
Page 22 of 44
21 of these patterns in healthy subjects as well as in asthmatics suggests that these fundamental elements of lung mechanics are operative in all humans. Despite the similarities in response between the control and asthmatic subjects in our study, the asthmatic subjects only had mild disease, so we cannot say that enhanced heterogeneity is not a hallmark feature of subjects with more severe disease or in a state of exacerbation.
In fact, Lutchen and colleagues have shown the severity of
heterogeneity parallels the baseline severity of asthma (28). Nevertheless, enhanced heterogeneity of bronchoconstriction does not appear to be a characteristic feature of mild asthma compared to control subjects when supine. An interesting consequence of our study design, necessitated by the practicalities of obtaining CT images, is that we focused on the nature of bronchoconstriction in the supine position. Most studies of human airway responsiveness have been performed vertically, yet responsiveness in the horizontal position is of prime concern in nocturnal asthma (5, 44). A dramatic rise in responsiveness to methacholine has been demonstrated in normal subjects when they become supine (14, 31, 40, 42) and we also found that the non-asthmatic subjects in the present study behaved like subjects with asthma when they lay down and were exposed to methacholine (Table 2). What we did not observe was that there was any change in heterogeneity, at least as measured by R1-R20, in moving from the upright to the supine position (Table 2). This would imply that heterogeneity of airway narrowing is more dependent on the state of activation of airway smooth muscle and less dependent on the effects of posture; i.e., lung volume. However, the effects of supine posture on reduced lung volume and airway-parenchymal interdependence (1, 7, 14, 31) are strongly suggested by the lack of a bronchodilatory effect of DI in both the
Page 23 of 44
22 control and asthmatic subjects (Table 2). These results are reminiscent of those of Skloot and colleagues (43) who found that preventing healthy subjects from taking a DI for a period of time reduced the bronchodilatory effectiveness of a subsequent DI. Lutchen and colleagues (28) observed a similar phenomenon in subjects with severe asthma, although not in mild asthmatics or normal controls. Thus, in lying supine for a period of time in the CT scanner, our subjects may have experienced both reduced forces of airwayparenchymal interdependence and a period of limited periodic stretch of their airway smooth muscle that caused their airway smooth muscle to become “frozen” in a constricted state (16, 28). This could explain why we were only able to relieve their bronchoconstriction pharmacologically (Table 2). Taken together, these results emphasize how both the state of activation of airway smooth muscle, as well as its load, are critically important in determining airways responsiveness (40). The results of our study must be considered in the context of a number of practical limitations we faced. For example, our measurements of Rrs included a contribution from the chest wall, which may have changed relative to that of the lung with changes in posture. However, Nagels and colleagues (34) showed that the contribution of the chest wall to total pulmonary resistance in the supine position is small. Our findings may also be limited because we restricted out analysis of CT data to one region of the lung only, and heterogeneity of lung attenuation may have occurred to different extents in different lung regions. In addition, because we designed the CT protocol to detect changes in lung attenuation only and not to detect changes in airway dimensions, we do not know whether heterogeneity as determined by the FOT might have correlated with heterogeneity of larger airway size. Another limitation is that although all CT and FOT
Page 24 of 44
23 measurements were made at end-expiration, we did not measure absolute lung volume. Consequently, we cannot be sure that air trapping secondary to bronchoconstriction did not elevate lung volume and so contribute to the increased airspace size that we detected following methacholine administration. We did not track lung volume directly, but we did track FVC before and after methacholine. Assuming TLC did not change, a fall in FVC would reflect the extent of elevation of RV and hence air trapping. We found that some degree of air trapping did occur in both asthmatic and control subjects, because FVC fell 5% and 10% respectively (p=0.18). Nevertheless our analysis indicates that airspace heterogeneity also increased in both groups, which is not what would be expected from an increase in lung volume (4). A further limitation imposed by our experimental design was that the DI’s performed following the supine methacholine challenge may have influenced the subsequent measurements. We attempted to minimize this effect by waiting 2 min (26) after methacholine administration before acquiring FOT and CT data. DI’s may have also affected the methacholine response as measured by FEV1 (2), but since performing the FEV1 itself involves a DI, we thought the effect of any preceding DI’s would be small. In conclusion, we have demonstrated a novel method of assessing parenchymal heterogeneity by CT imaging, and used the technique to show that heterogeneity of bronchoconstriction as measured by CT and the FOT increases to similar degrees in healthy and mildly asthmatic subjects when they are constricted to equivalent levels in the supine position. Heterogeneity of bronchoconstriction thus does not appear to be a function of mild asthma per se, but rather is associated with bronchoconstriction in general. Indeed, under the conditions of this study, the behavior of healthy and asthmatic
Page 25 of 44
24 subjects was strikingly similar. Yet, since the asthmatic subjects were still distinguished by their hyperresponsiveness to methacholine, important differences in airway and parenchymal function must be operative in determining the unique physiologic phenotype of asthma.
Page 26 of 44
25
ACKNOWLEDGEMENTS
We appreciate the advice on statistical analysis provided by Taka Ashikaga, PhD, of the Medical Biostatistics Department at University of Vermont. Supported by: NIH grants R01 HL67273 from the National Heart Lung and Blood Institute, and P20RR15557 from the Centers of Biomedical Research Excellence program of the National Center for Research Resources.
Page 27 of 44
26 REFERENCES
1.
Agostoni E and Hyatt RE. Static behaviour of the respiratory system. In:
Handbook of Physiology, edited by Macklem P and Mead J. Bethesda, MD: American Physiological Society, 1986, p. 113-130. 2.
Allen ND, Davis BE, Hurst TS, and Cockcroft DW. Difference between
dosimeter and tidal breathing methacholine challenge. Contributions of dose and deep inspiration bronchoprotection. Chest 128: 4018-4023, 2005. 3.
American Thoracic Society. Guidelines for methacholine and exercise challenge
testing - 1999. Am J Respir Crit Care Med 161: 309-329, 1999. 4.
Anafi RC and Wilson TA. Airway stability and heterogeneity in the constricted
lung. J Appl Physiol 91: 1185-1192, 2001. 5.
Ballard RD, Pak J, and White DP. Influence of posture and sustained loss of
lung volume on pulmonary function in awake asthmatic subjects. Am Rev Respir Dis 144: 499-503, 1991. 6.
Bates JHT, Lauzon A-M, Dechman GS, Maksym GN, and Schuessler TF.
Temporal dynamics of pulmonary response to intravenous histamine in dogs: effects of dose and lung volume. J Appl Physiol 76: 616-626, 1994. 7.
Behrakis PK, Baydur A, Jaeger MJ, and Milic-Emili J. Lung mechanics in
sitting and horizontal body positions. Chest 83: 643-646, 1983. 8.
Beigelman-Aubry C, Capderou A, Grenier PA, Straus C, Becquemin MH,
Similowski T, and Zelter M. Mild intermittent asthma: CT assessment of bronchial
cross-sectional area and lung attenuation at controlled lung volume. Radiology 223: 181187, 2002.
Page 28 of 44
27 9.
Biernacki W, Redpath AT, Best JJK, and MacNee W. Measurement of CT
lung density in patients wth chronic asthma. Eur Respir J 10: 2455-2459, 1997. 10.
Black LD, Dellaca R, Jung K, Atileh H, Israel E, Ingenito EP, and Lutchen
KR. Tracking variations in airway caliber by using total respiratory vs. airway resistance
in healthy and asthmatic subjects. J Appl Physiol 95: 511-518, 2003. 11.
Brown R, Pearse D, Pyrgos G, Liu M, Togias A, and Permutt S. The structural
basis of airways hyperresponsiveness n asthma. J Appl Physiol 101: 30-39, 2006. 12.
Brown RH, Croisille P, Mudge B, Diemer FB, Permutt S, and Togias A.
Airway narrowing in healthy humans inhaling methacholine without deep inspirations demonstrated by HRCT. Am J Respir Crit Care Med 161: 1256-1263, 2000. 13.
Cauberghs M and Van de Woestijne KP. Mechanical properties of the upper
airways. J Appl Physiol 55: 335-342, 1983. 14.
Ding DJ, Martin JG, and Macklem PT. Effects of lung volume on maximal
methacholine-induced bronchoconstriction in normal humans. J Appl Physiol 62: 13241330, 1987. 15.
Downie SR, Salmone CM, Verbanck S, Thompson BT, Berend N, and King
GG. Ventilation heterogeneity is a major determinant of airway hyperresponsiveness in
asthma, independent of airway inflammation. Thorax 62: 684-689, 2007. 16.
Fredberg JJ. Frozen objects: small airway, big breaths and asthma. J Allergy
Clin Immunol 106: 615-624, 2000. 17.
Goldin JG, McNitt-Gray MF, Sorenson SM, Johnson TD, Dauphinee B,
Kleerup EC, Tashkin DP, and Aberle DR. Airway hyperreactivity: assessment with
helical thin-section CT. Radiology 208: 321-329, 1998.
Page 29 of 44
28 18.
Goldin JG, Tashkin DP, Kleerup EC, Greaser LE, Haywood UM, Sayre JW,
Simmons MD, Suttorp M, Colice GL, Vanden Burgt JA, and Aberle DR.
Comparative effects of hydrofluoroalkane and chlorofluorocarbon beclomethasone dipropionate inhalation on small airways: Assessment with functional helical thin-section computed tomography. J Allergy Clin Immunol 104: S258-S267, 1999. 19.
Guckel C, Wells AU, Taylor DA, Chabat F, and Hansell DM. Mechanism of
mosaic attenuation of the lungs on computed tomography in induced bronchospasm. J Apppl Physiol 86: 701-708, 1999. 20.
Hankinson JL, Odencrantz JR, and Fedan KB. Spirometric reference values
from a sample of the general US population. Am J Respir Crit Care Med 159: 179-187, 1999. 21.
Hantos Z, Daroczy B, Suki B, Nagy S, and Fredberg JJ. Input imedance and
peripheral inhomogeneity of dog lungs. J Appl Physiol 72: 168-178, 1992. 22.
Kaczka DW, Ingenito EP, Israel E, and Lutchen KR. Airway and lung tissue
mechanics in asthma: effects of albuterol. Am J Respir Crit Care Med 159: 169-178, 1999. 23.
Kaminsky DA, Irvin CG, Lundblad L, Moriya HT, Lang S, Allen J, Viola T,
Lynn M, and Bates JHT. Oscillation mechanics of the human lung periphery in asthma.
J Appl Physiol 97: 1849-1858, 2004. 24.
King GG, Carroll JD, Muller NL, Whittall KP, Gao M, Nakano Y, and Pare
PD. Heterogeneity of narrowing in normal and asthmatic airways measured by HRCT.
Eur Respir J 24: 211-218, 2004.
Page 30 of 44
29 25.
Lamers RJS, Kermerink GJ, Drent M, and van Engelshoven JMA.
Reproducibility of spirometrically controlled CT lung densitometry in a clinical setting. Eur Respir J 11, 1998. 26.
Lim TK, Pride NB, and Ingram RH. Effects of volume history during
spontaneous and acutely induced air-flow obstruction in asthma. Am Rev Respir Dis 135: 591-596, 1987. 27.
Little SA, Sproule MW, Cowan MD, Macleod KJ, Robertson M, Love JG,
Chalmers GW, McSharry CP, and Thomson MC. High resolution computed
tomographic assessment of airway wall thickness in chronic asthma: reproducibility and relationship with lung function and severity. Thorax 57: 247-253, 2002. 28.
Lutchen K, Jensen A, Atileh H, Kaczka D, Israel E, Suki B, and Ingenito E.
Airway constriction pattern is a central component of asthma severity. The role of deep inspirations. Am J Respir Crit Care Med 164: 207-215, 2001. 29.
Lutchen KR and Gillis H. Relationship between heterogeneous changes in
airway morphometry and lung resistance and elastance. J Appl Physiol 83: 1192-1201, 1997. 30.
Lutchen KR, Hantos Z, Petak F, Adamicza A, and Suki B. Airway
inhomogeneities contribute to apparent lung tissue mechanics during constriction. J Appl Physiol 80: 1841-1849, 1996. 31.
Meinero M, Coletta G, Dutto L, Milanese M, Nova G, Sciolla A, Pellegrino R,
and Brusasco V. Mechanical response to methacholine and deep inspiration in supine
men. J Appl Physiol 102: 269-275, 2007.
Page 31 of 44
30 32.
Miller MR, Hankinson JL, and Brusasco V. Standardisation of spirometry. Eur
Respir J 26: 319-338, 2005. 33.
Mitsunobu F, Ashida K, Hosaki Y, Tsugeno H, Okamoto M, Nishida N,
Nagat T, Takata S, and Tanizaki Y. Decreased computed tomographic lung density
during exacerbation of asthma. Eur Respir J 22: 106-112, 2003. 34.
Nagles J, Landser J, van der Linden L, Clement J, and van de Woestijne KP.
Mechanical properties of the lungs and chest wall during spontaneous breathing. J Appl Physiol 49: 408-416, 1980. 35.
National Institutes of Health. Highlights of the Expert Panel Report 2:
Guidelines for the diagnosis and management of asthma, 1997, p. 3. 36.
Newman KB, Lynch DA, Newman LS, Ellegood D, and Newell JDJ.
Quantitative computed tomography detects air trapping due to asthma. Chest 106: 105109, 1994. 37.
Niimi A, Matsumoto H, Amiani R, Nakano Y, Mishima M, Minakuchi M,
Nishimura K, Itoh H, and Izumi T. Airway wall thickness in asthma assessed by
computed tomography. Relation to clinical indices. Am J Respir Crit Care Med 162: 1518-1523, 2000. 38.
Peslin R and Fredberg JJ. Oscillation mechanics of the respiratory system. In:
Handbook of Physiology: Section 3: The Respiratory System, edited by Fishman A. Baltimore: Williams and Wilkins Company, 1986, p. 145-177. 39.
Pride NB. Forced oscillation techniques for measuring mechanical properties of
the respiratory system. Thorax 47: 317-320, 1992.
Page 32 of 44
31 40.
Que CL, Kenyon CM, Olivenstein R, Macklem PT, and Maksym GN.
Homeokinesis and short-term variability of human airway caliber. J Appl Physiol 91: 1131-1141, 2001. 41.
Samee S, Altes T, Powers P, de Lange EE, Knight-Scott J, Rakes G, Mugler
JPI, Ciambotti JM, Alford BA, Brookeman JR, and Platts-Mills TAE. Imaging the
lungs in asthmatic patients by using hyperpolarized helium-3 magnetic resonance: Assessment of response to methacoline and exercise challenge. J Allergy Clin Immunol 111: 1205-1211, 2003. 42.
Shardonofsky FR, Martin JG, and Eidelman DH. Effect of body posture on
concentration-response curves to inhaled methacholine. Am Rev Respir Dis 145: 750-755, 1992. 43.
Skloot G, Permutt S, and Togias A. Airway hyperresponsiveness in asthma: A
problem of limited smooth muscle relaxation with inspiration. J Clin Invest 96: 23922403, 1995. 44.
Tahan M and Boulet LP. Influence of posture on expiratory flows and airway
responsiveness to methacholine in asthma. Chest 104: 143-148, 1993. 45.
Tgavalekos NT, Tawhai M, Harris RS, Mush G, Vidal-Melo M, Venegas JG,
and Lutchen KR. Identifying airways responsible for heterogeneous venitlation and
mechanical dysfunction in asthma: an image functional modeling approach. J Appl Physiol 99: 2388-2397, 2005. 46.
Thorpe CW and Bates JHT. Effect of stochastic heterogeneity on lung
impedance during acute bronchoconstriction: a model analysis. J Appl Physiol 82: 16161625, 1997.
Page 33 of 44
32 47.
Venegas JG, Winkler T, Musch G, Melo MFV, Layfield D, Tgavalekos N,
Fischman AJ, Callahan RJ, Bellani G, and Harris RS. Self-organized patchiness in
asthma as a prelude to catastrophic shifts. Nature 434: 777-782, 2005. 48.
Zelder MR, Kleerup EC, Goldin JG, Kim HJ, Truong DA, Simmons MD,
Sayre JW, Liu W, Elashoff R, and Tashkin DP. Montelukast improves regional air-
trapping due to small airways obstruction in asthma. Eur Respir J 27: 307-315, 2006.
Page 34 of 44
33 FIGURE LEGENDS
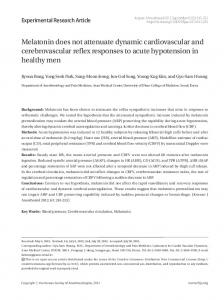
Figure 1 – Study Protocol. All subjects underwent baseline measurement of oscillation mechanics by the forced oscillation technique (FOT) and spirometry (Spiro) while sitting. Subjects then lay down on the CT table for repeat measurement of FOT followed by CT scanning. Spirometry was performed after the CT to avoid the effects of deep inhalation (DI) on the FOT and CT data. Methacholine was then administered, and 2 min later repeat FOT and CT was obtained. The subjects then took 3 DI’s, followed immediately by FOT and then spirometry.
Subjects then inhaled albuterol and had repeat FOT
measured 5 min later. Finally, subjects sat back up and had repeat spirometry. Figure 2 – Representative Change in an Asthmatic Subject of A) Lung CT Imaging; B) Left, Histogram of Pixel Attenuation in Hounsfield Units (HU), and Right, Histogram of Linear Airspace Dimension (LAD), Before (Pre) and After (Post) Methacholine (Meth). The region of interest in 2A is denoted by the speckled, closed loop. Notice in 2B that after methacholine, the mean attenuation moved toward more negative HU’s, indicating less density, while the LAD increased. In addition, the standard deviation of HU decreased, but the standard deviation of LAD increased after methacholine (Table 3). Figure 3 – Rrs vs. Frequency for Each of the Study Groups Under Each Experimental Condition (mean ± SE). Figure 4 – Ers vs. Frequency for Each of the Study Groups Under Each Experimental Condition (mean ± SE), Separated into Type A and B Patterns Based on Visual Inspection of the Baseline, Sitting Ers Data (closed circles).
Page 35 of 44
34 Figure 5 – Rrs vs. Frequency for Each of the Study Groups Under Each Experimental Condition (mean ± SE), Separated into Type A and B Patterns Based on Visual Inspection of the Baseline, Sitting Ers Data (closed circles).
Page 36 of 44
35
TABLES
Table 1 – Subject Characteristics and Baseline Values* of Lung Function and CT Attenuation in the Sitting Position
Asthmatic
Control
N
18
19
Age (yrs)
26 ± 7
26 ± 10
Gender
10M/9F
5M/13F
FEV1 (%)
94 ±13
99 ± 14
FEV1/FVC (%)
75 ± 8†
83 ± 6
PC20 (mg/ml)
0.96 (0.02-7.2)‡
> 16 mg/ml
R1 (cm H20/l/s)
8.1 (6.2-14)
8.6 (5.9-14)
R20 (cm H20/l/s)
4.9 (3.8-5.6)
4.5 (3.7-5.5)
R1-R20 (cm H20/l/s)
3.3 (2.4-8.4)
3.8 (1.5-9.4)
HU-mean
-705 ± 41
-738 ± 65
HU-SD
137 ± 12.1
135 ± 18.2
* values given as mean ± sd or median (25-75 interquartile range) † p = 0.003 asthmatic vs. control ‡ geometric mean (range)
Page 37 of 44
36 Table 2 – Absolute Values and Changes in Lung Function Parameters for Each Experimental Condition * Asthmatic
Control
FEV1 sitting (L)
3.80 ± 0.70
3.70 ±0.80
FEV1 supine (L)
3.24 ±0.76
3.32 ± 0.81
-15 ± 7†
-11 ± 6†
2.62 ± 0.81
2.72 ± 0.88
-21 ± 15†
-20 ± 11†
R1 sitting (cm H20/s/l)
8.1 (6.2-14)
8.6 (5.9-14)
R1 supine (cm H20/s/l)
10 (6.6-14)
7.8 (4.6-12)
11 (-3.4-46)
-17 (-33-16)
13 (8.7-16)
14 (9.3-21)
30 (-2.8-93) †
67 (16-116) †
13 (8.2-16)
15 (8.0-20)
-4.8 (-20-4.6)
-8.5 (-27-8.9)
6.9 (5.8-12)
8.2 (5.2-15)
-36 (-47 to -12) †
-35 (-46 to -10) †
R20 sitting (cm H20/s/l)
4.9 (3.8-5.6)
4.5 (3.7-5.5)
R20 supine (cm H20/s/l)
4.7 (3.9-6.2)
4.6 (3.5-5.9)
Spirometry:
FEV1 supine vs. sitting (%) FEV1 methacholine (L) FEV1 meth vs. supine baseline (%) FOT:
R1 supine vs. sitting (%) R1 meth (cm H20/s/l) R1 meth vs. supine baseline (%) R1 DI (cm H20/s/l) R1 DI vs. meth (%) R1 albuterol (cm H20/s/l) R1 albuterol vs. meth (%)
Page 38 of 44
37 R20 supine vs. sitting (%)
3.2 (-5.6-20)
4.8 (-5.7-16)
4.9 (4.4-5.4)
5.1 (4.5-6.4)
3.6 (-11-15)
11 (-3.1-26) †
4.9 (4.4-5.6)
5.2 (4.2-6.6)
0 (-8.6-8.5)
-0.3(-8.4-7.4)
4.3 (3.9-5.2)
5.0 (3.4-5.8)
-11 (-23 to -2.9) †
-13 (-26 to 0) †
(R1-R20) sitting
3.3 (2.4-8.4)
3.8 (1.5-9.4)
(R1-R20) supine
5.8 (2.4-8.6)
3.3 (1.1-6.2)
6.7 (-12-89)
-25 (-61-21)
7.7 (3.9-11)
8.5 (4.1-15)
76 (-2.1-194) †
86 (16-283) †
7.8 (3.9-11)
8.7 (3.7-14)
-13 (-30-12)
-6.4 (-50-32)
2.9 (2.0-6.9)
3.5 (1.9-8.9)
-53 (-62 to -29) †
-43 (-64-0.9) †
R20 meth (cm H20/s/l) R20 meth vs. supine baseline (%) R20 DI (cm H20/s/l) R20 DI vs. meth (%) R20 albuterol (cm H20/s/l) R20 albuterol vs. meth (%)
(R1-R20) supine vs. sitting (%) (R1-R20) meth (R1-R20) meth vs. supine baseline (%) (R1-R20) DI (R1-R20) DI vs. meth (%) (R1-R20) albuterol (R1-R20) albuterol vs. meth (%)
* values given as mean ± sd or median (25-75 interquartile range) †p
0.04 within groups
condition 1 vs. condition 2 = change in parameter between conditions 1 and 2 meth = methacholine DI = deep inhalation
Page 39 of 44
38 Table 3 – Absolute Values and Changes in Parameters of CT Attenuation in Asthmatic and Non-Asthmatic Control Subjects Following Methacholine.
Asthmatic
Control
HU pre
-705 ± 41
-738 ± 65
HU post
-746 ±54
-762 ± 44
5.5 ±4.6*
3.6 ± 4.9*
HU-SD pre
137 ±12.1
135 ±18.2
HU-SD post
131 ± 13.4
128 ±14.4
-4.7 ± 5.0*
-4.3 ± 5.4*
LAD pre
1.50 (1.40-1.54)
1.50 (1.41-1.56)
LAD post
1.60 (1.50-1.73)
1.56 (1.50-1.76)
9.2 (1.5-15)*
3.4 (-0.3-11)*
LAD-SD pre
0.42 (0.34-0.48)
0.45 (0.40-0.51)
LAD-SD post
0.44 (0.38-0.54)
0.49 (0.41-0.53)
9.8 (4.0-20)*
4.2 (-2.1-14)*
HU-mean (%)
HU-SD (%)
LAD-mean (%)
LAD-SD (%)
All values = mean ± SD or median (25-75 IQR) LAD = linear airspace dimension,
= tissue volume *= p
0.03 within group
3
a , where a= hypothetical airspace dimension, Vtis Vtis
Page 40 of 44
Figure 1
Sit
Sit Supine Baseline
FOT/ Spiro
FOT/CT Spiro
Meth
FOT/CT
DI
FOT/ Spiro
Albuterol
FOT
Spiro
Page 41 of 44
Figure 2
Pre-meth
Post-meth
A
100
Pre-methacholine Post-methacholine
B Frequency
Frequency
100
50
0 -900
-600
Hounsfield Unit
-300
50
0 0
2
4
Linear Airspace Dimension
Page 42 of 44
Figure 3
Non-asthmatics sitting supine methacholine deep inflation albuterol
16
12
Rrs (cmH2O.s.l-1)
8
4
0
Asthmatics 16
12
8
4
0 0
5
10
15
Frequency (Hz)
20
Page 43 of 44
Figure 4 Non-asthmatics, Type B
Ers (cmH2O.l-1)
Non-asthmatics, Type A 400
sitting 400 supine methacholine deep inhalation albuterol
200
200
0
0
0
5
10
15
20
0
Ers (cmH2O.l-1)
400
400
200
200
0
0
5
10
15
20
10
15
20
Asthmatics, Type B
Asthmatics, Type A
0
5
10
15
Frequency (Hz)
20
0
5
Frequency (Hz)
Page 44 of 44
Figure 5
Non-asthmatics, Type A
Rrs (cmH2O.s.l-1)
30
sitting supine methacholine deep inhalation albuterol
20
10
20
10
0
0 0
5
10
15
20
Asthmatics, Type A
30
Rrs (cmH2O.s.l-1)
Non-asthmatics, Type B
30
0 30
20
20
10
10
0
5
10
15
20
10
15
20
Asthmatics, Type B
0 0
5
10
15
Frequency (Hz)
20
0
5
Frequency (Hz)