Sep 28, 2012 - ogy. For this application to the LCLS copper cathode, the laser fluence used for laser cleaning was determined by the. ''vacuum activity'' in the ...
PHYSICAL REVIEW SPECIAL TOPICS - ACCELERATORS AND BEAMS 15, 090703 (2012)
High-brightness electron beam evolution following laser-based cleaning of a photocathode F. Zhou, A. Brachmann, F-J. Decker, P. Emma, S. Gilevich, R. Iverson, P. Stefan, and J. Turner SLAC National Accelerator Laboratory, 2575 Sand Hill Road, Menlo Park, California 94025, USA (Received 21 May 2012; published 28 September 2012) Laser-based techniques have been widely used for cleaning metal photocathodes to increase quantum efficiency (QE). However, the impact of laser cleaning on cathode uniformity and thereby on electron beam quality are less understood. We are evaluating whether this technique can be applied to revive photocathodes used for high-brightness electron sources in advanced x-ray free-electron laser (FEL) facilities, such as the Linac Coherent Light Source (LCLS) at the SLAC National Accelerator Laboratory. The laser-based cleaning was applied to two separate areas of the current LCLS photocathode on July 4 and July 26, 2011, respectively. The QE was increased by 8–10 times upon the laser cleaning. Since the cleaning, routine operation has exhibited a slow evolution of the QE improvement and comparatively rapid improvement of transverse emittance, with a factor of 3 QE enhancement over five months, and a significant emittance improvement over the initial 2–3 weeks following the cleaning. Currently, the QE of the LCLS photocathode is holding constant at about 1:2 � 10�4 , with a normalized injector emittance of about 0:3 �m for a 150-pC bunch charge. With the proper procedures, the laser-cleaning technique appears to be a viable tool to revive the LCLS photocathode. We present observations and analyses for the QE and emittance evolution in time following the laser-based cleaning of the LCLS photocathode, and comparison to the previous studies, the measured thermal emittance versus the QE and comparison to the theoretical model. DOI: 10.1103/PhysRevSTAB.15.090703
PACS numbers: 07.77.Ka
I. OVERVIEW The Linac Coherent Light Source (LCLS), located at the SLAC National Accelerator Laboratory, has been successfully operated for users for more than three years [1]. Its copper-cathode based photoinjector has produced an ultralow emittance electron beam [2] for the x-ray free-electron laser (FEL). To date, three polycrystalline copper photocathodes have been used in the LCLS injector operation since its initial commissioning [3]. The first cathode had quantum efficiency (QE), 2–3 � 10�5 after some processing, sufficient for initial commissioning from early of 2007 to July 2008. The second cathode had the QE of about 5 � 10�5 and was used for about three years of operation, from July 2008 to May 2011. When the LCLS repetition rate was increased from 60 to 120 Hz, the cathode QE quickly decayed to one half its initial value within 7–10 days. For this reason, the transverse position of the drive laser on the cathode had to be moved frequently to find new high-QE spots. This movement and subsequent retuning of the photoinjector occupied significant LCLS machine time, and only a limited number of laser locations on the cathode could deliver the desired low emittance electron beam for reasonably good FEL performance. The second cathode was then replaced by a third one in May 2011, but the initial QE of this third cathode was only
Published by the American Physical Society under the terms of the Creative Commons Attribution 3.0 License. Further distribution of this work must maintain attribution to the author(s) and the published article’s title, journal citation, and DOI.
1098-4402=12=15(9)=090703(7)
�5 � 10�6 , insufficient for user operations. Eventually, laser-based cleaning was initiated on the third photocathode, in order to boost the QE. Previous cleaning attempts for the third cathode, using in situ hydrogen plasma cleaning [3], failed to achieve adequate QE improvement. Laser-based cleaning techniques have been used in the photoinjector community for many years on metal cathodes, such as copper and Mg, to enhance QE [4–6]. A highintensity laser beam, interacting with the cathode, may ablate the cathode surface and/or remove contamination, thereby resulting in a QE increase. However, the impact of laser cleaning on cathode uniformity and electron beam emittance are unknown at present. We evaluated whether this technique could be used to revive the LCLS photocathode for x-ray FEL facilities, which have stringent requirements on the beam emittance as well as the QE. Laser-based cleaning for the LCLS photocathode was successfully performed in July 2011, and we observed an evolution of the QE and emittance following the cleaning. This paper will first introduce parameters and procedures used for the laser-based cleaning of the LCLS copper photocathode. Then, the observed evolution of the QE and emittance following the laser-based cleaning and corresponding analyses are presented. Finally, we present the measured LCLS thermal emittance for different QE. II. LASER-BASED CLEANING PARAMETERS AND PROCEDURES The applied laser fluence is a key parameter in the laserbased cleaning of metal cathodes. The fluence of the
090703-1
Published by the American Physical Society
F. ZHOU et al.
Phys. Rev. ST Accel. Beams 15, 090703 (2012) TABLE I. Major parameters for the cleaning of the third LCLS cathode.
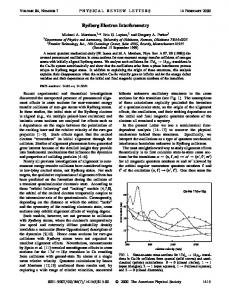
FIG. 1. Picture of the LCLS rf gun and its accessories [7].
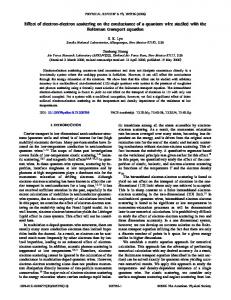
refocused UV drive laser (253 nm) needs to be properly chosen so that the laser can effectively remove surface contamination to enhance the QE, but will not destroy the cathode surface quality or change the surface morphology. For this application to the LCLS copper cathode, the laser fluence used for laser cleaning was determined by the ‘‘vacuum activity’’ in the photocathode rf gun [5]. In other words, the applied laser fluence (laser energy for a given laser spot size) had to be gradually increased until a change in vacuum pressure in the rf gun was observed. In the LCLS gun system, the nearest vacuum gauge to monitor the gun vacuum is located at a nearby rf-feed waveguide, as shown in Fig. 1 [7]. The cold cathode ion gauge on the waveguide is about 50 cm away from the cathode. An estimate shows the vacuum pressure on the cathode is 1.3–1.5 times higher than the ion gauge [8]. A pressure rise of �0:5 � 10�10 Torr was observed in the LCLS gun waveguide when the pulse energy of the laser illuminating −9
1.8
x 10
Gun vacuum (Torr)
1.6 Cleaning tests
1.4 1.2 1 Formal cleaning
0.8 0.6 11:45 12:00 12:15 12:30 12:45 13:00 13:15 13:30 13:45
Laser pulse energy (�J) 17–20 30=30 Laser rms spot size on cathode, �x =�y (�m rms) Laser scan step size (�m) 30 Laser shots on each spot 60 or 120 Laser beam rate (Hz) 120 Base vacuum on the gun waveguide �7 � 10�10 prior to the laser cleaning with rf off (Torr) Vacuum rise on the gun waveguide �0:5 � 10�10 during the cleaning with rf off (Torr) Gun rf power during the cleaning rf power off QE measurements: QE before the cleaning �5 � 10�6 QE after three runs of cleaning �4 � 10�5 QE measured at: Laser launch phase 30� from zero crossing Peak gun accelerating field (MV=m) 115 Laser spot size on the cathode 1 mm diameter
the photocathode was increased to 17 �J with a 30 �m rms spot size. With this vacuum activity, removal of cathode surface contamination was expected. The laser was then rastered in a 2D grid across the cathode to clean the surface, using a 30 �m step size in x and y. Figure 2 shows the typical vacuum activity in the gun waveguide during the laser cleaning. The gun-waveguide vacuum increased to about 7:5 � 10�10 Torr from the base value of 7 � 10�10 Torr. Note that the base vacuum on the gun waveguide was elevated to 7 � 10�10 Torr, from the typical steady-state vacuum of 3 � 10�10 Torr (with the gun rf off), due to a few previous hydrogen cleanings and laser fluence-determination testing prior to the formal laser cleaning. After the first run of the cleaning, the QE increased to �1 � 10�5 from an original value of 6 � 10�6 . Two more runs followed, with laser pulse energy slightly increased to about 20 �J, maintaining a 30-�m rms spot size. The cleanings enhanced the QE to �4 � 10�5 , 7–8 times before the laser cleaning. Table I gives the major parameters used for cleaning the LCLS cathode. The rf power for the gun was always turned off during the lasercleaning process. All QE data were measured at a 30� laser launch phase from zero crossing, with 115 MV=m of peak gun electric field, using a 1 mm diameter drive laser spot on the cathode. During the QE measurements, the laser energy on the cathode was varied to produce a constant 150 pC bunch charge.
Time
FIG. 2. Typical ‘‘vacuum activity’’ in the rf gun waveguide during the laser-cleaning process: about 0:5 � 10�10 Torr of the pressure rise in the gun waveguide (blue) is observed during the laser-cleaning process.
III. EVOLUTION OF QE AND EMITTANCE FOLLOWING CATHODE LASER CLEANING Two separate square areas on the LCLS cathode (2 mm � 2 mm each) were processed by the laser-based
090703-2
HIGH-BRIGHTNESS ELECTRON BEAM EVOLUTION . . .
Phys. Rev. ST Accel. Beams 15, 090703 (2012)
FIG. 3. White light images of the LCLS cathode before (a) and after (b) the laser cleaning. The x-y coordinate in the plot (b) is with respect to the solenoid axis.
cleaning technique on July 4 and July 26, 2011, using the focused drive laser beam. The focus size was �x ¼ 30 �m rms. Figures 3(a) and 3(b) show white-light images of the cathode before and after the laser cleaning. The polycrystalline copper grain patterns are clearly seen on the cathode surface before the cleaning [Fig. 3(a)]. After the cleaning, clearly, the surface reflectivity decreases as a result of laser exposure [Fig. 3(b)]. The central top square area A shown in Fig. 3(b) was processed by the laser cleaning on July 4, 2011 and is located at the cathode center. The lower region B was processed on July 26, 2011 and its central position has a �2:5 mm in y offset from the cathode center. A 1 mm diameter spot marked with a yellow circle in area A is currently being illuminated to produce the electron beam for the LCLS user operations from July 4, 2011 to now, July 21, 2012; no other areas are used during the LCLS user operations. Evolution of the QE and emittance for continually used and unused spots are presented in the following sections. All QE data reported in this paper are characterized using a 1 mm diameter drive laser beam size. A. QE evolution The QE measured immediately after the cleaning process was about 4 � 10�5 in the areas exposed to the laser cleaning. Figure 4 shows the evolution of the QE and gunwaveguide vacuum from July 4, 2011 to December 15, 2011 following the cleaning process on July 4, 2011, for the spot marked with a yellow circle in area A, being used for routine operations. From December 2011 to now, July 25, 2012, the QE is holding constant, about 1:2 � 10�4 . Note that the LCLS machine is always operated at a 120 Hz repetition rate for user operations. The figure shows that over time the QE increased by a factor of 3 and reached about 1:2 � 10�4 after about 5 months of operation. The gun-waveguide vacuum also improved, from 8 � 10�10 Torr to 6:5 � 10�10 Torr during this period. The QE for the unused-but-laser-cleaned spots in area B is also improved following the cleaning on July 26, 2011. About 6 weeks later, the QE was increased to 6 � 10�5 from 5 � 10�5 . The QE was mapped again on
FIG. 4. Evolution of the QE (top) and gun-waveguide vacuum (bottom) during the five months following the laser cleaning, for the cathode spot with yellow circle.
February 2, 2012, eight months following the cleaning (Fig. 5). We measured the QE of area B [Fig. 3(b)], by moving the drive laser beam from �1:5 mm to þ1:5 mm in the x plane for different y locations, �2:5 mm, �2:0 mm, and �3:0 mm, respectively. Because a 1-mmdiameter laser spot size was used to measure the QE, the full laser beam was located within the cleaned area for a laser central x location ranging from �0:5 mm to þ0:5 mm (Fig. 5). For a central x location beyond þ1:5 mm or �1:5 mm, the full laser beam diameter was located completely outside the cleaned area. The data in Fig. 5 show that the QE for the spots within the cleaned area had also increased from 5 � 10�5 to �1:3 � 10�4 . The data shown in both Figs. 4 and 5 suggest that the QE improvement in both areas might be related to the gun vacuum. Figure 5 also shows that the QE data for the uncleaned areas, beyond þ1:5 mm or �1:5 mm for laser central x location, was still within the 10�6 scale. Figure 6 shows an electron beam image (20 pC bunch charge) at a yttrium-aluminum-garnet screen located about 1.43 m
090703-3
F. ZHOU et al.
Phys. Rev. ST Accel. Beams 15, 090703 (2012)
FIG. 5. The QE measured eight months following laser cleaning, for area B, using a 1-mm-diameter laser spot size. The area has a �2:5 mm y offset from the cathode center. Within �0:5 mm of the central x location, the full laser spot was located within the cleaned area, while it was located completely outside the cleaned area for a central x location beyond þ1:5 mm or �1:5 mm. For central x locations at �1:0 mm, one half of the laser spot was in a cleaned area while the other half was in an uncleaned area.
Data in both Figs. 5 and 6 indicate that the QE measured eight months later in the uncleaned area was still at a very low level, although the overall gun vacuum had continuously improved. Table II summarizes the QE evolution for areas A, B, and the non-laser-cleaning area. B. Discussion of the QE evolution and comparison to previous studies
FIG. 6. The QE image for a laser spot half on a cleaned area and half on an uncleaned area. The image was taken at a screen located about 1.43 m downstream of the gun, with a 20 pC bunch charge.
downstream of the gun. One half of the 1-mm-diameter laser beam illuminated a cleaned area while the other half fell in an uncleaned area. In general, we consider the electron image on the screen to be equivalent to a QE emission profile on the cathode (negligible space charge force at 20 pC and 1-mm laser spot size on the cathode).
TABLE II. Area A Prior to the cleaning: QE � 5 � 10�6 7/4/2011: laser cleaning, QE � 4 � 10�5 (QE increased by 8 times) 9/1/2011: QE � 7:5 � 10�5 12/4/2011: QE � 1:2 � 10�4 7/27/2012: QE � 1:2 � 10�4
Although detailed surface and material science studies for the third LCLS cathode are still pending, we assume that the cathode surface exposed to laser cleaning still retained contaminants, which were pumped out over time, causing a slow increase in the QE. However, the contaminants on the uncleaned surface remain unchanged, and appear strongly bound to the surface, and are not removed as a result of vacuum improvement. Cathode R&D programs to further understand the detailed surface and material processes that take place during the laser cleaning are under way at the SLAC [9]. The first LCLS cathode was also processed by laser cleaning for a few times in 2007 and 2008 but using different procedures compared to the one for the third LCLS cathode. The QE of the first cathode decayed
Summary of the QE evolution for the third LCLS cathode. Area B Prior to the cleaning: QE � 5 � 10�6 7/26/2011: laser cleaning, QE � 5 � 10�5 (QE increased by about 10 times) 9/6/2011: QE � 6 � 10�5 2/2/2012: QE � 1:3 � 10�4
090703-4
Non-laser-cleaning area 7/4/2011: QE � 5 � 10�6 2/2/2012: QE � 5 � 10�6
HIGH-BRIGHTNESS ELECTRON BEAM EVOLUTION . . .
Phys. Rev. ST Accel. Beams 15, 090703 (2012)
FIG. 7. Emittance evolution for the cathode spot with yellow circle: the emittance assumes a normal value, between 0.3 and 0:4 �m (for 150 pC), within 2–3 weeks following the laser cleaning. The cathode spot being used for user operations is close to the cathode center. No data is shown from the middle of December 2011 to early in January 2012 since the LCLS machine was shut down. The emittance improvement after February 9, 2012 is due to use of a Gaussian-cut laser spatial profile, rather than a pseudouniform profile [13].
quickly during the operations following the cleaning. During the laser-cleaning process in 2007, the vacuum measured on the gun-waveguide increased to about 1 � 10�8 Torr from the base vacuum of 1 � 10�9 Torr. The first cathode was laser cleaned again in 2008. The gun vacuum rise during the cleaning in 2008 was at least 2–3 times higher than during laser cleaning of the third cathode (� 0:5 � 10�10 Torr). The laser fluence for cleaning the first cathode was at least twice for the third cathode. A small vacuum leak in the waveguide for the first accelerator section following the gun system was observed during the early days of the LCLS operations, which caused an additional gas load to the cathode. Similar phenomena for cleaning Mg cathodes were also observed [6]. Upon the laser cleaning, the QE of the Mg cathode improved 2 orders of magnitude [6] against about 1 order for the third LCLS cathode. The laser fluence and/or laser exposed time for the cleaning [6] were much higher than for the current third LCLS photocathode. During operation of the Mg cathode the QE following the laser cleaning did not decay during the first three months of operation but did not further increase as we observed for the third LCLS cathode. The comparison of the previous cleaning results
to the third LCLS cathode illustrates that the laser fluence and laser exposed time for the cleaning need to be properly chosen to have a good QE evolution during operations following the laser cleaning. C. Emittance evolution The LCLS injector emittance measurements are made using a quadrupole scan. After acceleration of the electron beam to 135 MeV, the beam is intercepted by a 1-�m thick aluminum screen. Here, the transverse electron beam size is measured using optical transition radiation (OTR) from the screen, which is imaged onto a digital camera. The strength of an upstream quadrupole is varied over several settings while the horizontal beam size is measured on the OTR screen. Figure 7 shows the emittance evolution from July 4, 2011, to February 2012, for the spot marked with a yellow circle in area A, following the laser cleaning. The location of the cathode spot is at x ¼ þ0:3 mm and y ¼ þ0:35 mm, close to the cathode center, in area A shown in Fig. 3(b). The emittance measured immediately after the laser cleaning was about 0:75 �m for a 150 pC bunch charge. It then improved to the normal value of 0:3–0:4 �m within 2–3 weeks following the cleaning
TABLE III. Summary of the emittance evolution following the laser cleanings. Area A (spot at x=y ¼ 0:3=0:35 mm) Date Charge (pC) "x ="y (�m) Measurements
Simulations
7/4/2011 8/1/2011
150 150
0:75=0:75 0:34=0:37
150 250
0:35=0:35 0:45=0:45
090703-5
Area B (spot at x=y ¼ 0= � 2:2 mm) Date Charge (pC) "x ="y (�m) 7/26/2011 9/6/2011 2/6/2012
150 250 150 150 250
0:74=0:55 0:54=0:48 0:50=0:38 0:50=0:38 0:52=0:48
F. ZHOU et al.
Phys. Rev. ST Accel. Beams 15, 090703 (2012)
FIG. 8. The QE emission improvement: taken immediately after the laser cleaning (left) and a few months following the cleaning (right). The image was taken at a screen located about 1.43 m downstream of the gun, with a 20 pC bunch charge.
process. The converged emittance was close to expectation from the simulation with the IMPACTT [10], 0:35 �m for 150 pC. The corresponding slice emittance also improved for both 150 and 250 pC bunch charge, as shown in Fig. 7. The emittance for an ‘‘idle’’ spot in area B cleaned on July 26, 2011 and centrally located at a �2:2 mm of y offset from the cathode center, was also characterized. The emittance measured on September 6, 2011 had been converged to our expectation, "x ="y ¼ 0:52=0:48 �m from simulations for 250 pC. About 90� of phase advance through the solenoid results in the coupling of y plane to x plane, which indicates that the y offset on the cathode may cause x-emittance growth. A summary of the emittance evolution of the spots in areas A and B following the cleanings and comparison to the simulations is given in Table III. The emittance improvement, compared with the value measured immediately after cleaning, is attributed to an improved,
FIG. 9. Thermal emittance for the previous 2nd LCLS cathode (red squares), which was never laser-cleaning processed, and the current third LCLS cathode, which was processed by the laser cleaning. Laser cleaning of the current cathode was performed on July 4, 2011.
more-uniform QE emission. Figure 8 shows a comparison of the QE emission measured immediately after cleaning and a few months following the cleaning. The continuous rf conditioning and the formation of residual gas layers on the cathodes surface during routine user operations may smooth out a nonuniform surface created by the laser cleaning. D. Thermal emittance versus QE An S-band transverse rf cavity, located upstream of the OTR screen, is used to streak the beam vertically across the screen, in order to time resolve the horizontal emittance. The horizontal emittance measurement is then ‘‘sliced up’’ into a number of bins in time (thirteen, for example). The thermal emittance is taken from the core time-sliced emittance measurements at 20 pC as a function of laser spot size, assuming that space charge forces and other emittance-growth sources are negligible for this charge. Figure 9 shows a comparison of the thermal emittance for the previous copper cathode, which was never lasercleaning processed, and the current copper cathode, processed by laser cleaning. For the previous copper cathode, the measured thermal emittance was 0:9 �m=mm rms [11], as shown in Fig. 9 (slice emittance divided by laser rms beam size). For the current cathode, processed by the laser cleaning on July 4, 2011, the thermal emittance measured a week after the cleaning was much worse than the normal value. This is now understood, since it appears to take 2–3 weeks for the emittance to evolve to a normal value following the laser cleaning, as described in the previous section. A few measurements taken months later, for the same spot on the cathode, following the laser cleaning, as shown in Fig. 9, illustrate that the thermal emittance values for the current cathode with cleaning were: (1) close to the thermal emittance of the previous cathode, and (2) close to each other, despite exhibiting different QE values (up to a factor of 2), which does not
090703-6
HIGH-BRIGHTNESS ELECTRON BEAM EVOLUTION . . . agree with theoretical predictions [12]. According to the model, the ‘‘theoretical’’ thermal emittance is correlated to the measured QE. However, the recent data shows thermal emittance is independent of, rather than correlated to, the measured QE. Some residual contamination that changes the QE may not modify the work function, and thereby the cathode thermal emittance. We conclude that the theoretical model does not completely describe the photoemission process. IV. CONCLUSION The laser-cleaning technique has been successfully applied to the LCLS injector, for cleaning the copper photocathode. The QE was enhanced by 8–10 times upon the laser cleanings. Since the laser cleaning was performed on the LCLS cathode, routine operations have shown a slow improvement of the QE and comparatively rapid improvement of the transverse emittance, with a factorof-3 QE enhancement over five months and a significant emittance improvement over the initial 2–3 weeks following the cleaning. Currently, the LCLS photocathode QE is holding constant at about 1:2 � 10�4 , with a normalized injector emittance of about 0:3 �m for a 150-pC bunch charge. Similar evolutions of both QE and emittance for the two separate areas exposed to the laser cleaning are observed. Discussions on the QE evolution and comparison to previous studies are presented. With the proper procedures, the laser-cleaning technique appears to be a viable tool to revive the LCLS photocathodes for x-ray FEL operations. In addition, measurements show that the LCLS cathode with different QE (up to a factor of 2) has similar thermal emittances, which suggests that cathode surface contamination impacting QE may not modify the work function, and thereby the thermal emittance. ACKNOWLEDGMENTS We would like to thank the dedicated LCLS physicists and operations team for their contributions and strong support. We particularly thank Vitaly Yakimenko (BNL) for providing the laser-cleaning recipe and helpful advice,
Phys. Rev. ST Accel. Beams 15, 090703 (2012)
and Marcelo Ferreira for the estimate of vacuum on the cathode with the vacuum data on the ion gauge. This work is supported by DOE under Contract No. DE-AC0276SF00515.
[1] P. Emma et al., Nature Photon. 4, 641 (2010). [2] R. Akre, D. Dowell, P. Emma, J. Frisch, S. Gilevich, G. Hays, Ph. Hering, R. Iverson, C. Limborg, H. Loos, A. Miahnahri, J. Schmerge, J. Turner, J. Welch, W. White, and J. Wu, Phys. Rev. ST Accel. Beams 11, 030703 (2008). [3] A. Brachmann, J. Decker, R. Iverson, J. Turner, P. Stefan, and F. Zhou, in Proceedings of IPAC2011, San Sebastia´n, Spain (EPS-AG, Spain, 2011). [4] X.-J. Wang, T. Srinivasan-Rao, K. Batchelor, I. Ben-Zvi, and J. Fischer, Nucl. Instrum. Methods Phys. Res., Sect. A 356, 159 (1995). [5] V. Yakimenko (private communication). [6] T. Shrinivasan-Rao, I- Ben-Zvi, J. Smedley, X. J. Wang, M. Woodle, and D. T. Palmer, in Proceedings of the Particle Accelerator Conference, Vancouver, BC, Canada, 1997 (IEEE, New York, 1997). [7] D. Dowell, E. Jongewaard, J. Lewandowski, C. Limborg, Z. Li, J. Schmerge, A. Vlieks, J. Wang, and L. Xiao, Report No. SLAC-PUB-13401, 2008. [8] M. Ferreira (private communication). [9] E. Jongewaard, R. Akre, A. Brachmann, J. Corbett, S. Gilevich, K. Gouev, P. Hering, P. Krejicik, J. Lewandowski, H. Loos, T. Montagne, J. C. Sheppard, P. Stefan, A. Vlieks, S. Weathersby, and F. Zhou, in Proceedings of IPAC2012, New Orleans, LA [http://accelconf.web.cern.ch/AccelConf/IPAC2012/papers/ moppp046.pdf]. [10] J. Qiang, Report No. LBNL-62326, 2007. [11] Y. Ding, A. Brachmann, F.-J. Decker, D. Dowell, P. Emma, J. Frisch, S. Gilevich, G. Hays, Ph. Hering, Z. Huang, R. Iverson, H. Loos, A. Minahnahri, H.-D. Nuhn, D. Ratner, J. Turner, J. Welch, W. White, and J. Wu, Phys. Rev. Lett. 102, 254801 (2009). [12] D. Dowell and J. Schmerge, Phys. Rev. ST Accel. Beams 12, 074201 (2009). [13] F. Zhou, A. Brachmann, P. Emma, S. Gilevich, and Z. Huang, Phys. Rev. ST Accel. Beams 15, 090701 (2012).
090703-7