Sep 16, 2005 - of the brown phase indicates also that part of the sample either ... Fiz. 47 758 (in Russian). [14] Oxford Diffraction 2002 CrysAlis RED version ...
INSTITUTE OF PHYSICS PUBLISHING
JOURNAL OF PHYSICS: CONDENSED MATTER
J. Phys.: Condens. Matter 17 (2005) 6285–6300
doi:10.1088/0953-8984/17/39/013
High pressure effects on the structural and vibrational properties of antiferromagnetic KFe(MoO4 )2 M M˛aczka1 , A Pietraszko1 , G D Saraiva2 , A G Souza Filho2 , W Paraguassu2 , V Lemos2 , C A Perottoni3,4 , M R Gallas4 , P T C Freire2 , P E Tomaszewski1 , F E A Melo2 , J Mendes Filho2 and J Hanuza1,5 1 Institute of Low Temperature and Structure Research, Polish Academy of Sciences, PO Box 1410, 50-950 Wrocław 2, Poland 2 Universidade Federal do Cear´ a, Departamento de F´ısica, PO Box 6030, CEP 60455-900, Fortaleza, CE, Brazil 3 Universidade de Caxias do Sul, Centro de Ciˆ encias Exatas e Tecnologia, Departamento de F´ısica e Qu´ımica, 95070-560 Caxias do Sul, RS, Brazil 4 Universidade Federal do Rio Grande do Sul, Instituto de F´ısica, Laborat´ orio de Altas Press˜oes e Materiais Avan¸cados, 91501-970 Porto Alegre, RS, Brazil 5 Department of Bioorganic Chemistry, Faculty of Industry and Economics, Wrocław University of Economics, 118/120 Komandorska Street, 53-345 Wrocław, Poland
Received 21 June 2005, in final form 9 August 2005 Published 16 September 2005 Online at stacks.iop.org/JPhysCM/17/6285 Abstract The crystal structure of the paraelastic phase of KFe(MoO4 )2 at 360 K was reinvestigated and high pressure Raman scattering experiments were performed on this material. The studies indicated that this molybdate crystallizes in the ¯ P 3m1 structure above 312 K. At room temperature the structure is monoclinic ¯ ¯ and low symmetry phases and it transforms under pressure into P 3m1, P 3c1 at 0.25, 1.3 and 1.6 GPa, respectively. The phase transitions observed at 0.25 and 1.6 GPa are irreversible whereas the 1.3 GPa transition is reversible. The ¯ lattice dynamics calculations performed for the P 3m1 phase allowed us to obtain an assignment of observed modes and helped us to obtain insight into the mechanism driving the structural changes occurring in this material. The x-ray study of the highest pressure phase, recovered during the decompression experiment, shows that the crystal structure of this phase is monoclinic or triclinic. When this phase is subjected to heat treatment at 673 K, it either transforms into another phase or decomposes.
1. Introduction KFe(MoO4 )2 belongs to the family of layered trigonal molybdates and tungstates with chemical formula M+ M3+ (MoO4 )2 , where M+ = Na, K, Rb, Cs and M3+ = Al, Sc, Cr, Fe [1–4]. These materials have been the subject of many studies owing to the richness of structural instabilities induced either by heat or hydrostatic pressure [1–6]. Recently, KFe(MoO4 )2 and 0953-8984/05/396285+16$30.00
© 2005 IOP Publishing Ltd
Printed in the UK
6285
6286
M M˛aczka et al
RbFe(MoO4 )2 molybdates attracted considerable attention since these compounds constitute rare examples of nearly two-dimensional ‘triangular’ antiferromagnets available in singlecrystal form [7–9]. The aim of the present work is to gain information on the structural changes occurring in KFe(MoO4 )2 crystal under hydrostatic pressure and the pressure dependence of the phonon properties. The Raman technique was employed for this purpose because it proved to be a valuable tool in molybdate and tungstate phase transition investigations in the past [1–6]. Therefore, KFe(MoO4 )2 Raman scattering may help us to understand the driving mechanism of structural changes observed in this crystal and other related layered materials. For a better understanding of such mechanisms, detailed information on the crystal structure of the prototype phase is required. In previous published works the trigonal phase of this family of crystals is described as ¯ belonging to either the P 3m1 = D33d space group with a ∼ 5–6 Å and c ∼ 7–8 Å or 4 ¯ the P 3c1 = D3d space group with a ∼ 5–6 Å and c ∼ 14–15 Å [10–12]. The room temperature x-ray diffraction studies of KFe(MoO4 )2 show that the c unit cell parameter is ¯ 14.24 Å and its crystal structure was obtained by Klevtsova et al by assuming the P 3c1 structure, accordingly [10]. However, later optical studies revealed that this crystal exhibits two ferroelastic phase transitions at T1 = 312 K and T2 = 139 K into monoclinic and triclinic phases, respectively [1, 13]. On the basis of this finding, the room temperature phase should be monoclinic and the remaining data on the crystal structure of KFe(MoO4 )2 in the literature may be incorrect. This controversy requires further investigation of the crystal structure of KFe(MoO4 )2 , particularly in the case of the prototype phase, for temperatures above the ferroelastic phase transition reported as 312 K. In this paper we reinvestigate this prototype phase by performing x-ray diffraction measurements at 360 K, well above the T1 phase transition temperature. The analysis of ¯ our data shows that the crystal structure of the prototype phase is not P 3c1, as previously ¯ ¯ assumed, but P 3m1. Using P 3m1 as the space group of the prototype phase we performed lattice dynamics calculations of Brillouin zone centre phonon modes to obtain the eigenvalues and their corresponding eigenmodes. The results were employed to assign the bands in the Raman spectrum of the prototype phase of KFe(MoO4 )2 . We also investigated the pressure dependence of KFe(MoO4)2 Raman spectra which revealed a rich sequence of phase transitions in the 0.0–4.0 GPa pressure range. 2. Experiment 2.1. Sample preparation The KFe(MoO4 )2 crystals were grown from the flux. The mixture of K2CO3 , Fe2 O3 and MoO3, corresponding to the compositions KFe(MoO4 )2 and K2 Mo2 O7 in a ratio 1:1, was placed in a platinum crucible, heated to 800 ◦ C, kept at this temperature for 40 h, cooled at a rate of 2 ◦ C h−1 to 600 ◦ C and then cooled at a rate 10 ◦ C h−1 to room temperature. The light green crystals of optical quality obtained were extracted from the crucible by washing with hot water. 2.2. Ambient pressure x-ray experiments and structure refinement The x-ray diffraction data on KFe(MoO4 )2 single crystal at ambient pressure were collected using an automatic x-ray four-circle KUMA Diffraction diffractometer with CCD area detectors. Graphite monochromated Mo Kα radiation (λ = 0.071 073 nm) was generated at 50 kV and 23 mA. A single image for 1◦ rotation around the ω axis was obtained in 30 s and the full set of x-ray diffraction data in the 2θ angle was collected over the range from 3◦
Structural and vibrational properties of AF KFe(MoO4 )2
6287
Table 1. Crystal data and structure refinement for KFe(MoO4 )2 at 360 K. Empirical formula Formula weight Temperature Wavelength Crystal system, space group Unit cell dimensions
Volume Z , calculated density (Mg m −3 ) Absorption coefficient F(000) Crystal size Theta range for data collection Index ranges Reflections collected/unique Completeness to 2� = 46.29 Refinement method Data/restraints/parameters Goodness-of-fit on F 2 Final R indices (I > 2σ (I )) R indices (all data) Extinction coefficient Largest diff. peak and hole
KFe(MoO4 )2 414.83 360(2) K 0.71073 Å ¯ Trigonal, P 3m1 a = 5.6650(8) Å α = 90◦ b = 5.6650(8) Å β = 90◦ c = 7.1380(14) Å γ = 120◦ 198.38(6) Å3 1, 3.472 5.467 mm−1 193 0.24 × 0.18 × 0.14 mm 3 5.05◦ –46.29◦ −11 � h � 5, −10 � k � 11, −9 � l � 14 3599/666 (R(int) = 0.0280) 94.2% Full-matrix least squares on F 2 666/0/18 1.020 R1 = 0.0229, w R2 = 0.0420 R1 = 0.0273, w R2 = 0.0429 0.094(3) 1.442 and −1.743 e Å−3
to 93◦ . The intensities of the reflections were recorded in 1200 frames (each frame consisting of 512 × 512 pixels with 2 × 2 pixel binning). The lattice parameters were calculated for refinement of positions of all measured reflections. The measurements were performed at 360 K with a KUMA Diffraction temperature stage, the temperature of which was stabilized to within 0.5 K. The analytical absorption correction for all samples was calculated with the CrysAlis procedure [14]. Details of data collection and structure refinement are presented in table 1. The crystal structure at 360 K was obtained using the direct method—with the SHELXL-97 program [15]. The same program was used for the successive cycles of refinement of the crystal structure. 2.3. In situ high pressure Raman experiments The pressure dependent Raman spectra were obtained with a Jobin-Yvon T64000 spectrometer operating in the double-subtractive mode, equipped with a N2 -cooled charge coupled device (CCD) detection system. The 514.5 nm line of an argon ion laser was used as the excitation. An Olympus microscope lens with a focal distance f = 20.5 mm and numeric aperture NA = 0.35 was used to focus the laser beam on the sample surface. High pressure Raman experiments were performed at room temperature using a diamond anvil cell (DAC) with 4:1 methanol:ethanol mixture as the transmitting fluid. The pressure calibration was achieved by using the well known pressure shift of the ruby luminescence lines. The spectrometer slits were set for a resolution of 2 cm−1 . 2.4. Ex situ high pressure x-ray experiments The high pressure/high temperature x-ray experiments were carried out using a toroidal-type chamber (a detailed description of this high pressure method is given elsewhere [16, 17]). The
6288
M M˛aczka et al Table 2. Atomic coordinates (×104 ) and equivalent isotropic displacement parameters (Å2 ×10³ ) for KFe(MoO4 )2 at 360 K. U (eq) is defined as one third of the trace of the orthogonalized Ui j tensor.
Fe(1) Mo(1) K(1) O(1) O(2)
x
y
z
U (eq)
0 6667 0 8381(1) 6667
0 3333 0 6762(2) 3333
5000 2582(1) 0 3335(2) 179(3)
12(1) 12(1) 38(1) 34(1) 31(1)
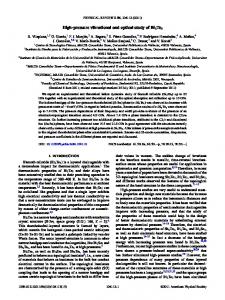
temperature was measured with a chromel–alumel type K thermocouple encapsulated in an Al2 O3 sleeve. The pressure cell consisted of a graphite heater (height of 9.2 mm, diameter of 7.0 mm, wall thickness of 1.5 mm), two small discs of fired pyrophyllite and two h-BN discs (diameter of 4.0 mm). A capsule of h-BN (3.0 mm internal diameter) is placed between these discs, and inside it, the sample. In this experimental set-up, h-BN acts as a nearly hydrostatic pressure-transmitting medium and, in lower temperature experiments (up to 800 ◦ C), it behaves as an inert material. The pressure calibration was performed by the ‘fixed points’ technique [16]. Two metals were used, Bi and Yb, which allowed calibrating the pressure using the following three fixed points: Bi with phase transitions at 2.5 and 7.7 GPa, and Yb with a phase transition at 4.0 GPa. The pressure is considered accurate to ±0.5 GPa. In a typical experiment, the samples were compacted at 4.0 GPa at room temperature. A small piece of Yb was put on top of the sample in order to check the applied pressure. After pressure stabilization, the sample was maintained at this pressure for 15 min. In the high temperature experiment, the sample processed at high pressure was subjected to heat treatment up to 653 K, under an argon atmosphere, kept in this temperature for 30 min, cooled down, and heated again to the same temperature for 150 min. In the high temperature, high pressure experiment, after pressure stabilization at 4.0 GPa, the sample (without the Yb gauge) was heated to 673 K for 30 min. Quenching was processed by turning off the power and, after 5–10 min, pressure was released. X-ray diffraction data on the pristine and quenched samples were obtained at ambient conditions with a Siemens D500 diffractrometer equipped with Soller slits in the incident beam, a 1◦ divergence slit, a 0.15 mm receiving slit, and a graphite monochromator in the secondary beam. Data were collected with Cu Kα radiation, in the angular range from 5◦ to 100◦ (2θ ◦ ), with a scan step of 0.05◦ and an acquisition time of 1.0 s per step for the pristine sample, 2.0 s per step for the samples processed at high pressure and room temperature, and 4.0 s for the sample processed at high pressure and high temperatures. 3. Results and discussion 3.1. X-ray diffraction studies at 360 K X-ray diffraction results show that KFe(MoO4 )2 crystallizes, at 360 K, in the centrosymmetric ¯ space group P 3m1 with lattice parameters that are given in table 1. This result shows that the ¯ symmetry [10] is not correct and KFe(MoO4 )2 crystallizes in the previously assumed P 3c1 ¯ same space group, P 3m1, as the majority of trigonal double molybdates and tungstates. Final parameters together with the equivalent thermal displacement amplitudes Ueq and anisotropic displacement parameters are listed in tables 2 and 3. Supplementary data for this structure are available in CIF format from the authors. The crystal structure consists of MoO4 tetrahedra bound to the FeO6 octahedra through O(2) oxygen atoms as shown in figure 1. The bound MoO4 tetrahedra and FeO6 octahedra
Structural and vibrational properties of AF KFe(MoO4 )2
6289
¯ Figure 1. View of the P 3m1 crystal structure of KFe(MoO4 )2 along with the a axis (upper part) and c axis (lower part). The Mo atoms are placed in the centres of the tetrahedra shown.
(This figure is in colour only in the electronic version) Table 3. Anisotropic displacement parameters (Å2 × 10³ ) for KFe(MoO4 )2 at 360 K. The 2 anisotropic displacement factor exponent takes the form −2π i2 [h 2 a ∗ U11 + · · · + 2hka ∗ b∗ U12 ].
Fe(1) Mo(1) K(1) O(1) O(2)
U11
U22
U33
10(1) 12(1) 49(1) 37(1) 37(1)
10(1) 12(1) 49(1) 20(1) 37(1)
17(1) 13(1) 17(1) 39(1) 18(1)
U23
U13
0 0 0 −14(1) 0
0 0 0 −7(1) 0
U12 5(1) 6(1) 24(1) 10(1) 19(1)
form layers perpendicular to the c axis. K atoms form layers of a second type perpendicular to the c axis. These ions are surrounded by 12 oxygen atoms forming a distorted cubic cubo-octahedron. The distances between potassium and oxygen atoms are 2.856(3) Å and 3.270(3) Å for O(1) and O(2), respectively. It is worth noting that the two non-equivalent oxygen atoms in the MoO4 tetrahedra are involved in different interactions, i.e., whereas the
6290
M M˛aczka et al Table 4. The correlation diagram showing the correspondence between the optical modes in ¯ ¯ structures of KFe(MoO4 )2 (the data for the P 3c1 ¯ structure are given in the P 3m1 and P 3c1 parentheses). Ion
Free ion symmetry
Site symmetry
Factor group symmetry
MoO2− 4
Td ν1 − A1
C3v (C3 ) A1 (A)
ν2 − E
E(E)
ν3 , ν4 , translation − F2
A1 (A)
D3d (D3d ) A1g (A1g + A2g ) A2u (A1u + A2u ) Eg (2Eg ) Eu (2Eu ) A1g (A1g + A2g ) A2u (A1u + A2u ) Eg (2Eg ) Eu (2Eu ) A2g (A1g + A2g ) A1u (A1u + A2u ) Eg (2Eg ) Eu (2Eu )
E(E) Libration − F1
A2 (A) E(E)
K+
D3d (D3 ) A2u (A2 ) Eu (E)
D3d (D3d ) A2u (A2u + A2g ) Eu (Eu + Eg )
Fe3+
D3d (C3i ) A2u (Au ) Eu (Eu )
D3d (D3d ) A2u (A1u + A2u ) Eu (2Eu )
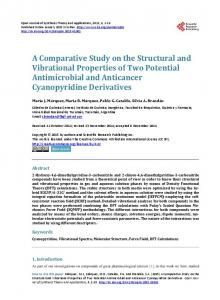
O(2) atoms are relatively strongly bound to Fe atoms, the O(1) atoms interact weakly and only with potassium atoms. 3.2. Lattice dynamics ¯ First the symmetry and vibrational properties of the P 3m1 structure of KFe(MoO4 )2 will be described in order to establish a basis for discussing the high pressure Raman results. For this trigonal structure, group theory predicts nine Raman active modes which are [7] �Raman = 4A1g + 5Eg . These Raman modes can be subdivided into symmetric stretching (ν1 − A1g ), asymmetric stretching (ν3 − A1g + Eg ), symmetric bending (ν2 − Eg ), asymmetric bending (ν4 − A1g + Eg ), translational (A1g + Eg ), and librational (Eg ) modes of the MoO2− 4 ions (see the correlation diagram presented in table 4). The Raman spectra of KFe(MoO4 )2 crystal measured at room temperature are shown figures 2 and 3. In order to adequately assign the Raman peaks to the atomic vibrations, we performed lattice dynamics calculations giving as results both frequencies (eigenvalues) and atomic displacements (eigenvectors) for each Raman active normal mode. Since KFe(MoO4 )2 is mostly ionic, we performed the calculations on the basis of a partially ionic model described in the paper by Nozaki et al [18]. The atomic positions used in the calculations were taken from our present x-ray data. The following interatomic potential was used in the lattice dynamics calculations: � � z i z j e2 ai + a j − r i j ci c j + (bi + b j ) exp − 6 Ui j (ri j ) = ri j bi + b j ri j + Di j (exp[−2βi j (ri j − ri∗j )] − 2 exp[−2βi j (ri j − ri∗j )]).
Structural and vibrational properties of AF KFe(MoO4 )2
6291
Figure 2. (a) Raman spectra of KFe(MoO4 )2 crystal in the low frequency region recorded at different pressures during compression and decompression experiments performed in the 0–1.5 GPa pressure range. (b) The same as in (a) except that the data are for the 0–4.0 GPa pressure range.
This interatomic potential consists of: a Coulomb interaction (first term) to model the long range interactions; a Born–Mayer-type repulsive interaction (second term) for accounting the short range forces; a van der Waals attractive interaction (third term) to model the dipole–dipole interaction; and, finally, the Morse potential contribution (last term) to take into account the covalent bond character. z i and z j are the effective charges of the ions i and j , respectively, separated by the distance ri j . The parameters (ai , a j ) and (bi , b j ) correspond to the ionic radii and ionic stiffness, respectively. The parameters used in the present calculations are listed in table 4. Since we consider covalency for the Mo–O bond only, Di j , βi j , and ri∗j are given for this bond. The parameters were set to the values shown in table 5 in order to obtain the best agreement between the observed (Raman and infrared (not discussed here) results) and calculated frequencies. The atomic displacement vectors for some Raman active modes of KFe(MoO4)2 are shown in figure 4. In this figure, the numbers are for calculated frequencies in units of cm −1 , and the numbers in parentheses are for experimental values also in units of cm −1 . The results of the calculations show that the A1g modes at 983 (976) cm−1 , 939 (927) cm−1 and the Eg mode at 797 (766) cm−1 should be assigned to the stretching modes of the MoO2− 4 units. Note that the displacement vectors corresponding to the 939 cm−1 A1g mode (observed at 927 cm−1 ) involve very large stretching motion of that Mo–O(1) bond which projects into the interlayer. This mode has an unusually narrow linewidth (∼2.5 cm−1 ) and its frequency is practically constant under temperature variation, thus indicating a quasi-harmonic behaviour [6]. The large displacement along Mo–O(1) bond is in agreement with polarized Raman measurements
6292
M M˛aczka et al
Figure 3. (a) Raman spectra of KFe(MoO4 )2 crystal in the high frequency region recorded at different pressures during compression and decompression experiments performed in the 0–1.5 GPa pressure range. (b) The same as in (a) except that the data are for the 0–4.0 GPa pressure range. The peaks marked with an asterisk relate to the most intense modes of ethanol (888 cm −1 ) and methanol (1033 cm −1 ) [20]. Table 5. Potential parameters used for the lattice dynamics calculations of KFe(MoO4 )2 . Ion
z (e)
a (Å)
b (Å)
C (kcal1/2 Å3 mol−1/2 )
O K Fe Mo
−1.05 0.6 2.2 2.8
1.926 1.674 0.854 0.814
0.16 0.09 0.08 0.09
20 15 0 0
Ion pair
Di j (kcal mol−1 )
βi j (Å)
ri∗j (Å)
Mo–O
28.0
2.3
1.92
which indicate that in (zz) polarization it is much stronger than in (x x) geometry. The remaining stretching modes involve large stretching motions of the other Mo–O(2) bond (figure 4). The same behaviour was also observed for previously studied KSc(MoO4 )2 [6]. According to the calculations the two Raman bands at 495 (368) cm−1 and 362 (341) cm−1 can be assigned to the bending modes. In the same frequency region a third bending mode should be observed, which did not appear in our spectra. The calculations show also that the 167 (149) cm−1 band −1 can be assigned to the A1g translation of the MoO2− 4 ions. The Eg modes at 186 (172) cm 2− −1 and 116 (60) cm involve translational and librational motions of the MoO4 ions.
Structural and vibrational properties of AF KFe(MoO4 )2
6293
A1g
983 (976)
A1g
A1g
167 (149)
Eg 797 (766)
Eg
362 (341)
Eg 186 (172)
939 (927)
A1g
584 (...)
Eg
495 (368)
Eg
116 (60)
Figure 4. Calculated frequencies in units of cm −1 of the Raman active modes for KFe(MoO4 )2 crystals and their related atomic displacements. The experimental frequencies are in parentheses.
3.3. Pressure dependent Raman studies Once a clear picture of the vibrational properties of the trigonal phase of KFe(MoO4 )2 is obtained we next discuss the effects of hydrostatic pressure on the structural and vibrational properties of this compound. The Raman spectra of KFe(MoO4 )2 crystal measured at several pressures and room temperature are shown in figures 2 and 3. The figures show spectra for the two kinds of experiments performed, the first, for which the releasing pressure value started from 1.5 GPa, and the second, for which this releasing started at 4.0 GPa. At room temperature the crystal symmetry is monoclinic as a result of the lowering of symmetry occurring below T1 = 312 K. One expects, therefore, to observe at room temperature more modes than predicted for the trigonal phase. However, the monoclinic distortion at room temperature is very small and the Raman spectrum looks nearly the same as the spectrum of isomorphic trigonal KSc(MoO4 )2 , studied previously by Saraiva et al [6]. The only visible influence of the T1 = 312 K phase transition is the presence of a weak splitting of the Eg band observed around 766 cm−1 (see the lower trace in figure 3(b)). The two modes at ∼766 cm−1 are not well resolved because, at room temperature, the crystal is very close to the monoclinic–trigonal structure transformation (the onset of this transition being 312 K). On applying pressure, the separation of these Eg modes decreases
6294
M M˛aczka et al
Figure 5. Frequency versus pressure plot in the low frequency (a) and high frequency (b) regions observed during compression. The solid lines are linear fits of the data to ω(P) = ω0 + α P. The vertical lines indicate the pressures at which the phase transitions take place.
with pressure and at 0.25 GPa a single peak replaces the two bands. This change could not be taken as continuous because the slopes in the frequency dependence on the pressure are large. As a consequence, the separation would be zero at a pressure value higher than 0.25 GPa, if the change was continuous. For pressures higher that 1.3 GPa a qualitative change is observed with significant frequency and intensity changes occurring in the Raman spectra. Moreover, new peaks show up in the low frequency region (see figures 2(a) and (b) and 5(b)). These changes indicate that at this pressure a second phase transition takes place. Upon further increase of pressure, remarkable changes in the Raman spectra become evident when the pressure is close to 1.6 GPa. The number of observed modes is nearly doubled and many modes exhibit drastic intensity changes. The narrow peak at 927 cm−1 decreases in intensity with pressure and becomes very weak for P > 3 GPa. The observed changes indicate the onset of a third pressure induced phase transition at about 1.6 GPa. The overall changes in the Raman spectra can be appreciated by analysing the frequency (ω) versus pressure (P) plot shown in figure 5. For all peaks the ω(P) behaviour can be described using a linear function (ω(P) = ω0 + α P). The data were fitted to this expression through the least squares method. The results for pressure coefficients of all Raman modes are listed in table 6. The results shown in figure 5 clearly indicate that the material experiences a first structural phase transition at about 0.25 GPa. Since the most characteristic feature in the 0–0.25 GPa pressure range is a continuous decrease of the ∼766 cm−1 Eg mode splitting, the Raman spectra indicate that the monoclinic distortion of the unit cell decreases continuously with increasing pressure. The observation of a single peak at ∼766 cm−1 for P � 0.25 GPa in this
Structural and vibrational properties of AF KFe(MoO4 )2
6295
Table 6. Pressure intercepts ω0 and pressure coefficients α for high pressure phases of KFe(MoO4 )2 . Intermediate phase Phase II ω0 α Band (cm −1 ) (cm −1 GPa
−1
ω(P) = ω0 + α P Intermediate phase Phase III ω0 α ) Band (cm−1 )
High pressure phase Phase IV ω0 α
(cm −1 GPa−1 ) Band (cm −1 )
1005.4 −28.3
A1g
978.7
2.6
I
A1g
925.9
0.2
H
916.3
Eg
766.1
6.5
G
774.9 −3.3
8.5
Eg Eg
369.1 341.2
5.3 2.3
F E
333.6 332.9
22.9 2.3
Eg A1g
169.4 150.3
14.2 4.1
A1g
60.5
8.9
D C B A
89.2 135.6 49.9 45.2
98.3 20.4 35.0 19.6
(cm −1 GPa−1 ) Assignment ν1 (MoO4 ) ν1 (MoO4 ) ν3 (MoO4 )
Z Y X W V U T
962.7 971.6 924.8 808.5 772.0 708.8 640.7
3.6 −7.0 3.5 1.5 −0.6 3.0 3.0
S R Q P O N
489.6 450.1 402.1 361.7 322.4 301.9
2.2 5.1 4.4 5.7 2.7 2.6
ν2, ν4 (MoO4 )
M L J
213.1 178.1 103.2
7.7 4.0 4.9
T � (MoO4 ) T � (MoO4 ) L(MoO4 ) L(MoO4 )
pressure range can, therefore, be attributed to the phase transition from the monoclinic phase ¯ (phase I in table 6) into the P 3m1 structure (phase II in table 6). This structure corresponds to the phase observed at ambient pressure for temperatures above T1 = 312 K. This result indicates that ∂ T1 /∂ P < 0. On further increasing the pressure, the Raman spectra remain qualitatively the same up to 1.3 GPa, except for the upshift observed for all peaks due to compression. The highest ∂ω/∂ P is observed for the 169.4 cm−1 mode in this intermediate pressure range. The changes observed at ∼1.3 GPa indicate that the KFe(MoO4 )2 crystal exhibits a second phase transition. The most characteristic features of this phase transition are: (i) a significant frequency decrease of the highest frequency Raman mode; (ii) a large intensity change of the 377 cm−1 (at 1.19 GPa) mode; (iii) a very large frequency change of the 172 cm−1 mode (observed at 186 cm−1 at 1.19 GPa) and the appearance of new modes close to 99 cm−1 . No splitting of the doubly degenerate modes, including the particular mode close to 766 cm−1 , could be observed. These results indicate that the crystal experiences relatively weak structural changes at the phase transition and its symmetry remains trigonal. We believe, therefore, that ¯ symmetry (phase III in table 6). this phase transition happens to the structure having to P 3c1 This sequence of phase transition was previously observed in the temperature dependent studies of RbFe(MoO4 )2 [7]. It was shown that at Tc = 190 K, the RbFe(MoO4 )2 crystal experiences changes very similar to those observed near 1.3 GPa for KFe(MoO4 )2 . Such striking similarity between the Raman spectra observed for the two compounds gives a very strong indication that the mechanism of the pressure induced phase transition in KFe(MoO4 )2 is the same as that of ¯ structure, as mentioned the temperature induced phase transition in RbFe(MoO4 )2 . The P 3c1 ¯ ¯ above, is very similar to the P 3m1 structure. It can be obtained from the P 3m1 structure by 2− small rotations of the MoO4 tetrahedra along the threefold axis, in opposite directions in the
6296
M M˛aczka et al
¯ structure, reported neighbouring unit cells along the c axis. Factor group analysis for the P 3c1 ¯ ¯ phase transition by us and by Klimin et al [7, 19], shows that as a result of the P 3m1 to P 3c1 all Eg modes should split into doublets (see table 4). The A1g modes should also split into doublets (A1g + A2g ), but since the A2g modes are Raman inactive, we should observe in our experiment only single lines for these modes. Inspection of table 4 shows also that the A2g librational mode and Eu translational mode of the K+ ions, which are Raman inactive for the ¯ ¯ phase since they should split into A1g + A2g P 3m1 phase, should be observed for the P 3c1 and Eu + Eg components, respectively. Our results show that the doubling of the Eg modes is not observed, but a new lattice mode gives rise to a peak at 99 cm −1 (peak B in figure 2(b)). Our lattice dynamics calculations + suggest that this mode can be attributed to MoO2− 4 libration. A K ion translational mode is also expected to make a contribution in the spectra. Although a very weak structure was observed to appear at 58 cm −1 in the spectrum taken at 1.5 GPa, its linewidth was too small compared with the currently observed Raman bands and we disregarded this peak. It should be recalled at this point that the lack of this mode can be explained since weakly polarizable K+ ions should either give rise to very weak Raman bands or no band at all. This agrees with the previous report by Klimin et al for RbFe(MoO4 )2 since the T � (Rb+ ) translational modes do not manifest in their Raman spectra either. It is noticeable that the highest frequency lattice mode (173 cm −1 at ambient pressure), which experienced the largest frequency shift at the phase transition, exhibits also an unusually high ∂ω/∂ P value (98.3 cm−1 GPa−1 ; see table 6), an order of magnitude larger than the values observed for the phases I and II. Moreover, the highest frequency Raman mode exhibits an unusually large negative ∂ω/∂ P value (−28.3 cm−1 GPa−1 ). The origin of this peculiar behaviour is not completely understood but it indicates that pressure induces large changes in the Mo–O–Fe distances and angles due to significant rotations of FeO6 octahedra and MoO2− 4 tetrahedra. The third phase transition occurs at about 1.6 GPa. The analysis of the Raman spectra indicates that this transition has first-order character and the material undergoes drastic structural changes. First of all it should be said that this transition leads to significant distortion of the MoO2− 4 tetrahedra. This is clearly seen since the stretching and bending mode spread over broader regions (646–970 and 307–495 cm−1 ) than in the phases observed below 1.6 GPa, thus meaning a much larger distribution of Mo–O bond lengths. Since the number of modes increases when the phase transition takes place, the high pressure phase (denoted as phase IV in table 6) has symmetry lower than trigonal. It is clear from figure 5(b) that stretching modes split into seven components. Since there are four stretching modes for a MoO2− 4 unit, the observation of seven components indicates that this new phase has two non-equivalent MoO2− 4 units occupying low symmetry sites. As a result of this transition, large changes are also observed for the narrow stretching mode observed near 927 cm−1 . The intensity of this mode decreases and bandwidth increases rapidly with increasing pressure. Since this mode corresponds to vibration of that oxygen atom which projects into the layer and interacts only with K+ ions, the observed changes show that K–O bonds are also strongly affected by this transition. The pressure dependence of the vibrational modes is not only much weaker than that observed for the phase stable in the 1.3–1.6 GPa range, but also weaker than that observed for phases I and II. The Raman study suggests, therefore, that the structure of this phase is more compact, but tetrahedral coordination of molybdenum atoms is preserved. In order to get new insight into the mechanism of phase transitions in KFe(MoO4 )2 , we have also performed Raman studies of KFe(MoO4 )2 crystal during the decompression. This study shows that upon releasing the pressure from 1.5 GPa, i.e. from the pressure at which the intermediate trigonal phase III is stable, the starting phase I was not recovered (see figures 2(a) and 3(a)). In figure 6, we show the spectra taken at 0.0 GPa for the starting phase and after
Structural and vibrational properties of AF KFe(MoO4 )2
6297
Figure 6. Raman spectra of KFe(MoO4 )2 crystals recorded at 0.0 GPa before (lower trace) and after compression (upper trace). The maximum pressure attained in this run was 1.5 GPa. The intermediate trace stands for the spectrum recorded at 0.41 GPa during the compression run where ¯ phase is stable. the P 3c1
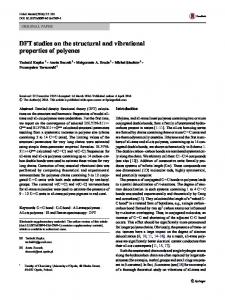
releasing the pressure, as well as the phase at 1.5 GPa. We can note that the feature associated with the monoclinic phase (splitting of the Eg mode) is not observed in the spectra obtained at 0.0 GPa after releasing the pressure. This indicates that the transition from monoclinic ¯ ¯ ¯ to P 3m1 (from P 3m1 to P 3c1) observed at 0.25 GPa (1.35 GPa) is not (is) reversible. This result shows that the energy difference between the two polymorphs is very small and probably some defects induced by pressure or some level of residual strain are enough to stabilize the trigonal phase. When the sample is transformed to the low symmetry, high pressure phase IV above 1.3 GPa, however, the starting phase is not recovered upon releasing pressure down to the ambient conditions (see figures 2(b) and 3(b)). It is obvious from this experiment that the phase transition into phase IV is irreversible. 3.4. X-ray study of the high pressure phase X-ray diffraction patterns of the KFe(MoO4 )2 sample subjected to a 4.0 GPa pressure and recovered from the diamond anvil cell are presented in figure 7. As one can note, the number of diffraction lines increased significantly but the main lines of the pristine sample remained. At a glance, this result suggests that the recovered sample could be a mixture of the high pressure and the pristine phase. However, this hypothesis can be ruled out for two reasons: first, the 2θ = 37.96◦ diffraction line of the pristine KFe(MoO4)2 is not observed in the diffractogram of the recovered sample (see figure 7). Second, our Raman experiment shows that KFe(MoO4 )2 transforms completely and irreversibly to a high pressure phase just as the pressure value
6298
M M˛aczka et al
Figure 7. Powder x-ray diffraction patterns of pristine KFe(MoO4 )2 at ambient pressure (a), the sample processed at 4 GPa pressure (b), the sample processed at 4 GPa pressure and then heated up to 653 K (c), and the sample processed simultaneously at 4 GPa and 673 K (d).
1.6 GPa is attained. We conclude, therefore, that all diffraction peaks for the recovered sample come from the high pressure phase. Our attempt to index the recorded diffractograms were not successful in hexagonal/trigonal or orthorhombic systems. The monoclinic unit cell can be found, but with so many solutions that it is not possible to choose a unique one. It is also worth noting that the diffraction lines of the high pressure phase are much broader than those observed for the pristine sample. This points to some disorder induced in the high pressure structure. Another possible reason for the peak broadening is the reduction of the crystallite size or residual strain. Only a systematic study of the angular dependence of the peak broadening could help to identify its origin. However, our present data set is not suitable for such study, and we hope to further clarify this issue in a forthcoming publication. Anyway, the presence of the halo in the x-ray diffractogram indicates a partial amorphization of the sample and, accordingly, the broadening of the other peaks may be associated with disorder rather than crystallite size effects. In order to get new information about the stability of the high pressure phase two experiments were performed. In the first experiment, the sample processed at high pressure was subjected to heat treatment at 653 K. In the second experiment, the same sample was processed simultaneously at a temperature of 673 K and a pressure of 4 GPa (see the experimental section). The observation of the sample obtained in the first experiment revealed that it is composed of two phases, brown and green–yellow. The measured x-ray diffractogram shows that the majority of lines agree well with the x-ray pattern of the original high pressure phase, but the lines become narrower (see figure 7). This result indicates that heating the sample to 653 K leads to a decrease of disorder due, most probably, to relaxation of defects. However, the appearance of the brown phase indicates also that part of the sample either decomposes or transforms into another phase. The sample obtained in the second experiment is brown and does not contain the green–yellow phase. The x-ray diffractogram shows that the most characteristic lines of the high pressure phase disappear (see figure 7). This result shows that the green–yellow high pressure phase is unstable at higher temperatures. The open question remains, however, of what kinds of changes occur in this material. The high pressure phase could transform into
Structural and vibrational properties of AF KFe(MoO4 )2
6299
another polymorph or could decompose. The attempts to identify the decomposition products, such as iron oxides, MoO3 , and several iron molybdates, have however not yet been successful. 4. Conclusions High temperature x-ray and room temperature pressure dependent Raman studies of layered KFe(MoO4 )2 were performed here. The results show that the crystal structure of this material ¯ at ambient pressure and above 312 K is P 3m1. Below 312 K the crystal structure is ¯ monoclinic. Upon increasing the pressure the monoclinic phase transforms to the P 3m1 structure at 0.25 GPa. Our studies also show that this material exhibits another reversible ¯ phase. phase transition when the pressure is close to 1.3 GPa to, most probably, the P 3c1 In addition, an irreversible phase transition occurs at 1.6 GPa to a low symmetry phase. Although the structure of this high pressure phase could not be established, the x-ray diffraction studies performed for the crystal recovered from the highest pressure phase upon releasing the pressure revealed that this phase is monoclinic or triclinic. This finding agrees with our previous studies of KSc(MoO4 )2 where a pressure induced irreversible phase transition into a low symmetry phase was found. This phase is characterized by two crystallographically non-equivalent and strongly distorted MoO2− 4 tetrahedra. This result indicates that the highest pressure phases of KFe(MoO4)2 and KSc(MoO4)2 have similar structures. In addition we show that the driving mechanism of the phase transitions here is the same as in the KSc(MoO4 )2 molybdate. These transitions are associated with rotations of the MoO2− 4 tetrahedra that lead to an increase in electrostatic repulsion between oxygen atoms and consequently to instability of the structures. However, the important difference between these crystals is that KFe(MoO4 )2 ¯ structure. exhibits the presence of an intermediate trigonal phase, most probably of P 3c1 ¯ ¯ Within the numerous works on layered trigonal molybdates and tungstates, the P 3m1 to P 3c1 phase transition was reported previously only for RbFe(MoO4 )2 (in a temperature dependent experiment). It is possible to conclude, therefore, that the distinct behaviours of the scandium and iron analogues may be due to the difference in electronic and magnetic properties of Fe3+ and Sc3+ . Acknowledgments AGSF acknowledges financial support from the Brazilian agency FUNCAP (Grant PPP985/03) and a research fellowship from CNPq (Grant 307417/2004-2). References [1] [2] [3] [4] [5] [6]
Otko A I, Nesterenko N M and Povstyanyi L V 1978 Phys. Status Solidi a 46 577 Nesterenko N M, Fomin V I and Zvyagin A I 1979 Izv. Akad. Nauk. SSSR 43 1675 Zapart W 1990 Phys. Status Solidi a 118 447 Zapart M B and Zapart W 1993 Phase. Transit. 43 173 Maczka M, Kojima S and Hanuza J 1999 J. Phys. Soc. Japan 68 1948 Saraiva G D, Maczka M, Freire P T C, Mendes Filho J, Melo F E A, Hanuza J, Morioka Y and Souza Filho A G 2003 Phys. Rev. B 67 224108 [7] Klimin S A, Popova M N, Mavrin B N, Van Loosdrecht P H M, Svistov L E, Smirnov A I, Prozorova L A, Krug van Nidda H A, Seidov Z and Loidl A 2003 Phys. Rev. B 68 174408 [8] Svistov L E, Smirnov A I, Prozorova L A, Petrenko O A, Shapiro A Ya and Demianets L A 2004 Pis. Zh. Eksp. Teor. Fiz. 80 231 (in Russian) [9] Jorge G A, Capan C, Ronning F, Jaime M, Kenzelmann M, Gasparovic G, Broholm C, Shapiro A Ya and Demianets L A 2004 Physica B 354 297
6300 [10] [11] [12] [13] [14] [15] [16] [17] [18] [19] [20]
M M˛aczka et al Klevtsova R F and Klevtsov P V 1970 Kristallografiya 15 953 (in Russian) Efremov V A, Trunov V K and Velokodnyi Yu A 1973 Sov. Phys.—Crystallogr. 17 1005 Tomaszewski P E, Pietraszko A, Maczka M and Hanuza J 2002 Acta Crystallogr. E 58 i119 Krainyuk G G, Otko A I and Nosenko A E 1983 Izv. SSSR Ser. Fiz. 47 758 (in Russian) Oxford Diffraction 2002 CrysAlis RED version 1.170.14 (Oxford, UK: Oxford Diffraction Ltd) Sheldrick G M 1997 SHELXL97, Program for Solution of the Crystal Structures University of Goettingen Sherman W F and Stadtmuller A A 1987 Experimental Techniques in High-Pressure Research (London: Wiley) Khvostantsev L G 1984 High Temp.—High Pressures 16 165 Nozaki R, Kondo J N, Hirose C, Domen K, Wada A and Morioka Y 2001 J. Phys. Chem. B 105 7950 Maczka M, Hanuza J, Kojima S and van der Maas J H 2001 J. Solid State Chem. 158 334 Lemos V and Camargo F 1990 J. Raman Spectrosc. 21 123