High-pressure / High-temperature Behavior of the Methane-AmmoniaWater System up to 3 GPa Alexander Kurnosov a, Leonid Dubrovinsky a, Alexei Kuznetsov a, b, and Vladimir Dmitriev c a b c
Bavarian Geoinstitute, University of Bayreuth, Bayreuth, Germany Consortium for Advanced Radiation Sources (CARS), The University of Chicago, Chicago, USA Swiss-Norwegian Beam Line, ESRF, Grenoble, France
Reprint requests to Dr. Alexander Kurnosov. Fax +49-(0)921-553769 E-mail:
[email protected] Z. Naturforsch. 61b, 1573 – 1576 (2006); received September 25, 2006 Melting phase relations in the methane-ammonia-water system up to 3 GPa have been obtained in a series of in situ experiments in externally heated diamond anvil cells. The melting temperature of methane clathrate hydrates increases rapidly above pressures of ∼ 1.5 GPa, and does not appear to be significantly affected by the presence of ammonia. The reaction of the hydrate formation at pressures 2 – 3 GPa is kinetically impeded. Our data show that the high-pressure methane hydrate has the maximum melting temperature among the clathrate hydrates studied so far. Key words: Clathrate Hydrates, Melting Curve, High Pressure
Introduction The behaviour of the methane-ammonia-water system is extremely important for understanding the nature and origin of the Titan’s atmosphere and Titan’s interior structure [1]. Titan is a Mars-sized moon of Saturn. It is the only moon in the solar system with a dense atmosphere [2]. The atmosphere can mimic that of the early Earth. Apart from the main constituent – nitrogen – it also contains some 5% of methane. The origin of methane in Titan’s atmosphere is now closely attributed to high-pressure (few GPa range) physicochemical processes in Titan’s interior involving the core. The main constituents responsible for these processes are considered to be water, methane, and ammonia [1]. The ammonia-water system has been studied rather well at high pressures with ammonia concentrations of less than 30% [3]. The melting temperature of ammonia hydrates at a wide pressure range is lower than the melting temperature of ice and the difference is ∼ 100 K at the eutectic (∼ 34% NH 3 ) at least at low pressures (up to 300 MPa) [4, 5]. This experimental information creates a basis for proposing the subsurface liquid layer at Titan. The melting curve of methane clathrate hydrates was studied up to 0.4 GPa [6] and up to a maximum pressure of 1.5 GPa [7] – the pressure range where two hydrate structures exist (MH-I* with the
structure-I water framework [8] and MH-II with the structure-H water framework [9]). At pressures higher than 2.6 MPa, methane hydrates are more stable than ice (i. e. they have a higher melting temperature). At pressures above ∼ 0.5 GPa, the decomposition temperature of the hydrates does not depend significantly on pressure [7]. At pressures higher than 1.5 GPa only r. t. diffraction and Raman spectroscopic data have been reported. The transition to a new high-pressure hydrate (MH-III) has been found around 2 GPa at r. t. by means of r. t. X-ray and neutron diffraction [10, 11] and Raman spectroscopic measurements [12]. The new hydrate was found to have a new type of water framework consisting of channels hosting methane in stoichiometric composition, CH 4 · 2 H2 O. In diffraction experiments at r. t., the hydrate was found to be stable up to very high pressures [11, 13]. So far, the melting curve of this particular hydrate at high pressures has not been studied, and for reasons outlined above, it is extremely important to model Titan’s interior [1], and is the topic of this contribution. Experimental Section We performed two sets of experiments on the CH4 -NH3 H2 O system with a slight excess of methane and ∼ 15 wt. % * Following Loveday et al., 2003 [9], MH is an abbreviation for methane hydrate; the numeration of the hydrates increases as the pressure increases.
0932–0776 / 06 / 1200–1573 $ 06.00 © 2006 Verlag der Zeitschrift f¨ur Naturforschung, T¨ubingen · http://znaturforsch.com
1574
A. Kurnosov et al. · Melting of Methane Hydrates in Presence of Ammonia at High Pressures
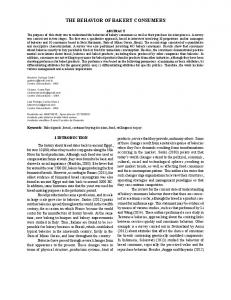
Fig. 1. Representative synchrotron X-ray diffraction pattern of the H2 O-CH4 -NH3 sample at 2.75 GPa and r. t., with profile matching by FullProf. A monochromatic beam ˚ was used as (λ = 0.7108 A) the X-ray source and diffraction images were collected by a MAR-345 imaging plate. Upper row of ticks: MH-III phase (Imma, a = 7.892, b = 4.763, ˚ c = 8.095 A); middle: ice ¯ ˚ VII (Pm3n, a = 3.346 A); ¯ a = lower: methane-I (Fm3m, ˚ 5.346 A). of ammonia in the initial water solution. Ammonia was added to examine its influence on the phase equilibria of clathrate hydrates. The sample was prepared by loading a water-ammonia mixture in approximately half the volume of the pressure chamber of a diamond anvil cell (DAC). By measuring the melting temperature of the ammonia-water solution upon cooling of the cell, the concentration was confirmed to be about 10 – 15 wt % NH3 . The solution then was frozen by liquid nitrogen and the remaining empty volume of the pressure chamber was filled with liquid methane. Then the DAC was sealed and heated to r. t. at pressures between 0.5 – 1 GPa. We used the modified Merill-Basset type DAC with an electrical heating element described previously [14]. In the first set of experiments we used diamonds with a culet size of 700 µ m and gold-covered stainless steel gaskets. In the second set, we used diamonds with a 300 µ m culet and rhenium gaskets. In both cases we did not observe any reaction of the gasket with the water-ammonia-methane solution. The melting curve was studied using in situ Raman spectroscopy and visual observations simultaneously at the same pressure and temperature conditions. For Raman and ruby luminescence measurements, we used a LABRAM Raman spectrometer with a He-Ne laser with the 632 nm red line excitation. Diffraction patterns were collected at ESRF ˚ at beamline BM01a using X-ray radiation of λ = 0.7108 A. A MAR-345 imaging plate detector placed at a distance of 340 mm was used to collect powder diffraction patterns in Deby-Scherrer geometry. The incongruent melting of methane clathrate hydrate was studied using external heating in the DAC by simultane-
ous application and measurement of temperature and pressure. The experiments were analysed using Raman spectroscopy coupled with visual observations. Measurements of ruby luminescence were made at half transparent geometry of the optical path of the Raman spectrometer. The sample was observed through a CCD camera coupled with the microscope. The laser light focused on the ruby was weak enough to allow us to clearly observe the sample, and at the same time the intensity of the laser light was sufficient to collect a spectrum of the ruby luminescence. Temperature was measured by K-type (or B-type at high temperatures) thermocouples placed at the diamond-gasket contact.
Results and Discussion We performed experiments in the pressure range 0.5 – 3 GPa. The main phases present in the system at pressures of 2 – 3 GPa, as determined by synchrotron powder X-ray diffraction, are methane hydrate MHIII, ice VII, and the phase-I of solid methane (Fig. 1). Three phases coexist in the two-phase region due to a very slow rate of hydrate formation at pressures above 2 GPa. A Raman spectrum (C–H stretching mode) 1 – 2 degrees below the melting point (497 K at 2.8 GPa) contains bands both of the enclathrated CH 4 molecule and liquid methane (Fig. 2, bottom panel). With increasing temperature, the C–H vibrations of the enclathrated methane molecules disappear as a sign of in-
A. Kurnosov et al. · Melting of Methane Hydrates in Presence of Ammonia at High Pressures
1575
Fig. 2. Photomicrograph of the sample in a pressure chamber of a DAC just prior to decomposition (p = 2.86(±0.1) GPa, T = 496(±2) K, left) and after decomposition (p = 2.73(±0.1) GPa, T = 498(±2) K, right) with corresponding Raman spectra of the C-H stretching mode for CH4 molecules in each phase. The area marked as “2” refers to the clathrate hydrate (left) and the methane + water (+ammonia) mixture (right). Area “1” is an excess of liquid methane. Upper curves are recorded for area “1”, lower curves for area “2”. The shift of the peak on the curve “2” corresponds to decomposition of MH-III to methane and water. Fig. 3. Decomposition curves of hydrates MH-I, MH-II and MH-III. Open circles: present work; asterisks: ref. [7]; thin solid line: water melting curve [15, 16]; vertical solid lines going down from corresponding triple points: boundaries of various ice modifications designated by corresponding Roman numerals; thin dotted line: methane melting curve [17]; diamonds: melting of methane (this work). Quadruple points: Q1 : l1 –h1 –h2 –l2 ; Q2 : l1 –h2 –h3 –l2 . Notations for quadruple points and three-phase coexistence lines: l1 : water-rich liquid phase; l2 : methane rich liquid phase; h1 : MH-I; h2 : MH-II; h3 : MH-III; asterisks: observed sold phase transitions MH-I → MH-II and MH-II → MH-III [9, 12, this work]; lines linking quadruple points and asterisks: schematic lines of coexistence of two corresponding hydrate phases and a water (ice) phase. The lines h1 –h2 –l2 and h2 –h3 –l2 are shown schematically according to Schreinemakers’ rules.
congruent melting. The transition also can be detected visually (Fig. 2, top panel). In the pressure range of 0.5 – 1.5 GPa, the melting temperatures (±2 K at ∼ 350 K) of methane hydrates formed in the CH 4 -H2 O-NH3 system do not differ significantly from that of clathrate hydrates in the methane-water system [7]. At pressures of 2 – 2.5 GPa the observed melting curve of excess (not reacted) methane seems to be in good agreement with previously published data (Fig. 3).
The experimentally determined melting curve of the clathrate hydrates is shown in Fig. 3, together with previous data on clathrate hydrates in the methanewater system [7], the melting curve of ice [15, 16], and the melting curve of methane [17]. The stability field of methane clathrate MH-III begins at the quadruple point l1 -h2 -h3 –l2 at 1.4 GPa and 333 K and is restricted by the three-phase three-component lines l 1 h3 -l2 and h2 -h3 -l2 or l1 -h2 -h3 depending on methane or water in excess (Fig. 3). The melting curve slope of
1576
A. Kurnosov et al. · Melting of Methane Hydrates in Presence of Ammonia at High Pressures
the hydrate is much steeper as compared to the known lower-pressure hydrates. The melting curve of methane hydrate (this study) does not intersect with the melting curve of either ice (i–l 1 –l2 ) or methane (l 1 –l2 –s). The intersection of the hydrate melting curve l 1 -h3 -l2 with both i–l1 –l2 and l1 –l2 –s would imply the appearance of the three-phase line i-h 3 –s which is a line of pressure-induced decomposition of the hydrate to ice and methane in a solid-state reaction. The irreversibility of the melting of the hydrate at around 3 GPa may imply a significant effect of kinetics at higher pressures, making the hydrate stable up to at least 42 GPa [11, 13]. The melting temperature of methane clathrate hydrate is 497 K at 2.8 GPa and tends to grow with
pressure. Among the known clathrate hydrates this temperature is the highest reported so far. The previously observed maximum temperature for melting of clathrate hydrates was 409 K at 2.9 GPa for argon hydrate (at the maximum of the melting curve) [18]. In this context methane-water is the most promising system for the study of weak intermolecular interactions at very high pressures and temperatures.
[1] G. Tobie, J. I. Lunine, C. Sotin, Nature 440, 61 (2006). [2] H. B. Niemann, S. K. Atreya, S. J. Bauer, G. R. Carignan, J. E. Demick, R. L. Frost, D. Gautier, J. A. Haberman, D. N. Harpold, D. M. Hunten, G. Israel, J. I. Lunine, W. T. Kasprzak, T. C. Owen, M. Paulkovich, F. Raulin, E. Raaen, S. H. Way, Nature 438, 779 (2005). [3] O. Grasset, J. Pragman, Planet. Space. Sci. 531, 371 (2005). [4] J. S. Kargel, Icarus 100, 556 (1992). [5] J. Leliwa-Kopystynski, M. Maruyama, T. Nakajima, Icarus 159, 518 (2002). [6] D. R. Marschall, S. H. Saito, R. Kobayashi, AlChE J. 10, 202 (1964). [7] Yu. A. Dyadin, E. Ya. Aladko, E. G. Larionov, Mendeleev Commun. 34 (1997). [8] D. W. Davidson, S. K. Garg, S. R. Gough, Y. P. Handa, C. I. Ratcliffe, J. S. Tse, J. A. Ripmeester, J. Inclusion Phenom. 2, 231 (1984). [9] J. S. Loveday, R. J. Nelmes, D. D. Klug, J. S. Tse, S. Desgreniers, Can. J. Phys. 81, 539 (2003).
[10] J. S. Loveday, R. J. Nelmes, M. Guthrie, D. D. Klug, J. S. Tse, Phys. Rev. Lett. 87, 215501 (2001). [11] H. Hirai, T. Tanaka, T. Kawamura, Y. Yamamoto, T. Yagi, Phys. Rev. B. 68, 172102 (2003). [12] H. Shimizu, T. Kumazaki, T. Kume, S. Sasaki, J. Phys. Chem. B 106, 30 (2002). [13] S. Machida, H. Hirai, T. Kawamura, Y. Yamamoto, T. Yagi, Physics of the Earth and Planetary Interiors 155, 170 (2006). [14] N. Dubrovinskaia, L. Dubrovinsky, Rev. Sci. Instr. 74, 3433 (2003). [15] D. Eisenberg, W. Kauzmann, The structure and properties of water, Oxford Univ. Press, London (1969). [16] N. Dubrovinskaia, L. Dubrovinsky, High Press. Res. 23, 307 (2003). [17] J. D. Grace, G. C. Kennedy, J. Phys. Chem. Solids 28, 977 (1967). [18] H. T. Lots, J. A. L. Schouten, J. Chem. Phys. 111, 10242 (1999).
Acknowledgements We thank ESRF for providing the synchrotron beam time and Shantanu Keshav for discussions and help with the manuscript.