VOLUME 80, NUMBER 11
PHYSICAL REVIEW LETTERS
16 MARCH 1998
High-Sensitivity Electron Paramagnetic Resonance of Mn12 -Acetate S. Hill* Department of Physics, Montana State University, Bozeman, Montana 59717
J. A. A. J. Perenboom Research Institute for Materials and High Field Magnet Laboratory, University of Nijmegen, 6525 ED, The Netherlands
N. S. Dalal and T. Hathaway Chemistry Department and National High Magnetic Field Laboratory, Florida State University, Tallahassee, Florida 32310
T. Stalcup and J. S. Brooks Department of Physics and National High Magnetic Field Laboratory, Florida State University, Tallahassee, Florida 32310 (Received 4 August 1997) The energy diagram of Mn12 -acetate is probed close to the top of the anisotropy barrier using a novel, high-sensitivity, electron paramagnetic resonance technique. Multiple resonances, and their temperature dependence, are observed from 35 to 115 GHz, for a single high-quality crystal. The data are sufficiently detailed to make extremely accurate comparisons with predictions based on a spin S 10 Hamiltonian. Although overall agreement is good, we find evidence for possible inadequacies of this model. [S0031-9007(98)05531-8] PACS numbers: 75.45. + j, 36.40.Cg, 76.30. – v
The Mn12 cluster complex [1], fMn12 O12 sCH3 COOd16 sH2 Od4 g ? 2CH3 COOH ? 4H2 O sMn12 -Acd, has attracted considerable interest due to indications that it exhibits the phenomenon of macroscopic quantum tunneling of magnetic moment (QTM) [2]. The core of the Mn12 Ac cluster consists of a tetrahedron of four Mn(IV) ions, each with S 3y2, surrounded by eight Mn(III) ions with S 2. The clusters crystallize into a tetragonal lattice in which the angular momentum is thought to be completely quenched, and a Jahn-Teller distortion gives rise to a strong axial anisotropy [1]. Superexchange leads to a high spin ground state where the spins of the Mn(IV) and Mn(III) ions are coupled parallel to S 6 and S 16, respectively; the spins of the outer shell are directed antiparallel to the spins of the inner ions. In the ground state, therefore, the cluster may be treated as an S 10 object, with the spin preferentially aligned along the c axis due to the axial anisotropy [3,4]. Magnetization studies have confirmed the S 10 character of Mn12 -Ac [4]. In addition, high-field electron paramagnetic resonance (EPR) studies on powders and polycrystalline samples have provided considerable information concerning the spin Hamiltonian of the system [3– 5]. Nevertheless, the precise nature of the relaxation of the magnetization at low temperatures remains unclear. To lowest order, the spin Hamiltonian may be written H D1 Sz2 2 gmB B ? S [6]. Thus, pairs of 6MS levels are degenerate in zero magnetic field, where MS is the projection of S along the sample’s easy (c, or z) axis. The anisotropy constant D1 is known to be negative so that the MS 610 levels lie lowest in energy, while the MS 0 level lies highest. When the system is spin polarized by applying and removing a large magnetic field 0031-9007y98y80(11)y2453(4)$15.00
sgmB B . S 3 D1 d parallel to the sample’s easy axis, a sizeable energy barrier inhibits the reversal of this moment; the magnitude of this barrier is ,102 3 D1 ø 44.5 cm21 [7]. In spite of this, considerable experimental evidence suggests that the spin system is somehow able to overcome this barrier at low temperatures [8]. Below about 3 K, steps are observed in the hysteresis loop of oriented powder samples [9,10] and single crystals [11]. The occurrence of these steps, at more-or-less regularly spaced values of magnetic field, has been cited as evidence that the magnetization reversal is due to QTM [2]. Unlike superparamagnetic particles, where QTM was first observed [2], Mn12 -Ac contains a large number of identical spin clusters, allowing much more accurate comparisons with theory to be made. Until now, no single crystal EPR studies of Mn12 -Ac have been possible. In this investigation, we utilize a somewhat novel approach— a multifrequency, highsensitivity EPR technique that enables us to make measurements on submillimeter sized single crystals. This is made possible by the use of resonant cavities with resonance frequencies varying from 35 to 115 GHz. This frequency range allows us to probe the energy levels immediately below the top of the anisotropy barrier which, as recent ac susceptibility measurements have indicated, may be crucial to the magnetization relaxation mechanism [12]. Furthermore, EPR transitions between these levels occur in the 0–5 T range (see below), precisely the region where the magnetization steps are seen. The high sensitivity of our method is a result of high cavity Q factors ranging from 5 3 103 to 2 3 104 , representing an improvement in sensitivity by at least 3 orders of magnitude relative to conventional high-field EPR © 1998 The American Physical Society
2453
VOLUME 80, NUMBER 11
PHYSICAL REVIEW LETTERS
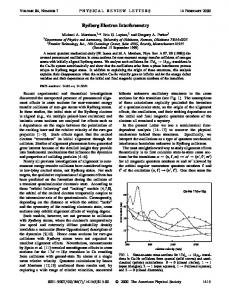
techniques [3–5]. This sensitivity enhancement is crucial to the successful measurement of single crystals, since the submillimeter sizes of the best available samples make it impossible for resonances to be detected by single-pass EPR techniques. Finally, our technique does not require narrow-band magnetic field modulation for detecting the resonances. This is a definite advantage in our case, where the resonance lines are broad (a few hundred mT). The Mn12 -Ac crystals were synthesized following the original procedure described by Lis [1], and grew in the form of rectangular parallelepipeds with the c axis as the longest dimension (direction of easy magnetization); the sample dimensions were ø1 3 0.3 3 0.3 mm3 . The sample authenticity was confirmed by dc magnetization measurements which exhibited the expected magnetization steps below 3 K [13,14]. Slightly oversized cylindrical copper cavities were used in transmission, providing several modes in the desired frequency range [15]; predominantly TE01p sp 1, 2, . . .d modes were excited. A single Mn12 -Ac crystal was placed close to the bottom of the cavity, halfway between its axis and its perimeter, thereby ensuring that the sample was optimally coupled to the radial ac magnetic fields sB1 d for a given TE01p mode. The applied dc magnetic field sB0 d was directed parallel to the cavity axis, so that B1 was perpendicular to B0 for all of the measurements. The sample was then loaded in three configurations, corresponding to the dc magnetic field sB0 d being applied parallel to each of the sample’s a, b, and c axes. The cavity and, therefore, the sample could accurately and controllably be maintained at any temperature in the range from 1.25 to 60 K. Both superconducting and resistive magnets were employed. As a source and detector, we utilized a Millimeter-Wave Vector Network Analyzer (MVNA) [15,16]. Figure 1(a) shows the temperature dependence of the transmission through the cavity for a single frequency, n 66.135 GHz s,2.2 cm21 d, with B0 k c. The sharp minima correspond to absorption in the sample due to EPR; complementary data were obtained for the dispersion. A strong feature is observed at ,2.5 T (labeled X), which broadens on cooling. From the frequency dependence of X, we have established that it has negligible zero-field offset and, therefore, cannot be reconciled with the energy diagram in Fig. 1(b) (see below). Furthermore, the temperature dependence of X is very different from the other features in Fig. 1(a). Consequently, we conclude that X is due to isolated impurities in the sample (possibly Mn21 ); no resonant features are observed in the empty cavity. The complexity of the EPR spectra in Fig. 1(a) increases as the temperature is raised, i.e., new resonances develop on the low-field side of X. This temperature dependence is consistent with the thermal population of levels close to the top of the barrier. Figure 1(b) shows the results of a recent calculation of these levels which was motivated primarily by magnetization measurements [13]. In order to maintain consistency between this calculation, and available experimental data (our own [13], as well as other published 2454
16 MARCH 1998
FIG. 1. (a) Temperature dependence of the normalized transmission (offset) for B0 k c; the frequency is 66.135 GHz. (b) A calculation of the corresponding energy levels for the S 10 spin system [13]; the arrows indicate transitions responsible for the resonances in (a). See text for details of the calculation and for an explanation of the labels.
results [9–11]), higher order terms in the spin Hamiltonian were considered, e.g., D4k 3 Sz4 1 D4' 3 sSx4 1 Sy4 d [17]. Such fourth order terms have been discussed previously in connection with QTM [5,6], and are responsible for the observed anticrossings between levels with DMS 64 [see Fig. 1(b)]. A more detailed justification for considering such higher order terms may be found in Ref. [13]. Nevertheless, we wish to emphasize that the parameters used in obtaining the level diagram in Fig. 1(b) were additionally constrained by the EPR data presented here (see below). We are now in a position to assign the transitions depicted in Fig. 1(b) to the resonances observed in Fig. 1(a). It can be seen that, for each pair of zero-field levels s6MS d, two series of resonances are observed, one corresponding to transitions between levels aligned with the field s1MS d and the other to transitions between levels which are antialigned s2MS d. Several of the resonances in Fig. 1(a) have been labeled P s1MS d or N s2MS d to distinguish between these cases. Additional resonances are observed for this, and other frequencies, which we label A. The numbering after the letters P, N, or A denotes the value of MS for the level from which the transition was excited. It is found that the A resonances are observed only over narrow intervals in magnetic field in the general vicinity of the anticrossings seen in Fig. 1(b) (0.9 T, 1.8 T, etc.). It is, therefore, tempting to attribute the A resonances to these anticrossings, thereby providing direct evidence supporting the level diagram in Fig. 1(b). However, we cannot rule out other possibilities. It is to be noted that the relative intensities of the resonances in Fig. 1(a) are qualitatively consistent with a thermal population of these high-lying (low MS ) levels,
VOLUME 80, NUMBER 11
PHYSICAL REVIEW LETTERS
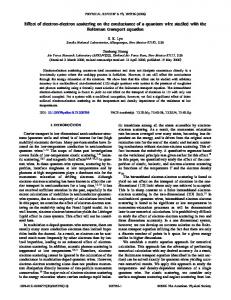
i.e., the P3 and N4 transitions are strongest because they are excited from the lowest-lying levels. The frequency dependence of the data for B0 k c is shown in Fig. 2; all of the data points fall on one of several straight lines. The solid points fall on a line through the origin and correspond to the impurity resonance sXd. The remaining points lie on straight lines with finite zerofield offsets. For each offset, two series of resonances are observed, corresponding to the P (positive slope) and N (negative slope) transitions. It should be noted that the fields where the P and N data cross (0.45 T, 0.9 T, 1.35 T, etc.) coincide with the fields where magnetization steps are observed below 3 K [9–11,13]. The zero-field offsets measured here (Fig. 2), and those obtained previously by Caneschi et al. [4] contain key information concerning the nature of the spin Hamiltonian. As discussed above, attempts to simulate the present data are vastly improved if a considerable fourth order term is taken into consideration in the Hamiltonian [13]. This is best illustrated by noting that the zero-field offsets in Fig. 2 do not occur in the simple ratio 1:3:5:7:etc., as expected in the absence of a fourth order term. The best correspondence between the data and the calculation is obtained assuming D1 20.47 cm21 and D4' 23.5 3 1024 cm21 s D4k d [17]. However, noticeable deviations are unavoidable for the one or two levels closest to the top of the barrier. This indicates possible evidence for a breakdown of the assumption that the Mn12 clusters may be treated strictly as rigid S 10 objects. The value obtained for D1 s 20.47 cm21 d is slightly larger than the generally accepted value corresponding to the barrier height of 44.5 cm21 s 102 3 D1 d [7]. However, it has been noted that magnetization relaxation probably occurs via levels below the top of the barrier [12], thus reducing its apparent height to some degree. From straight line fits to the different sets of P data in Fig. 2, g values varying between 1.97 (largest offset) and 2.08 (smallest offset) are obtained. Once again, these findings clearly identify possible inadequacies of the S 10 Hamiltonian. The g value used in our calculation of Fig. 2(b) is gk 2.05, which is rather larger than the published value of 1.9 [3,4].
FIG. 2.
Frequency dependence of the data for B0 k c.
16 MARCH 1998
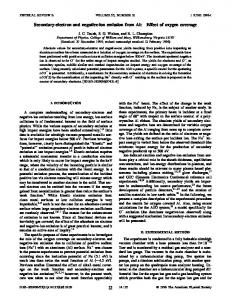
Although the frequencies used here are smaller than the largest zero-field splittings (,9 cm21 for the largest MS ), we have clearly been able to obtain a considerable amount of information concerning the levels close to the barrier. The nature of the energy level diagram for B0 ' c allows us to probe the entire structure of the system. This is visualized in Fig. 3(b), where it can be seen that the field causes a strong coupling, and eventual anticrossing, of levels separated at zero field by DMS 61. This results in a lifting of the degeneracy between the 6MS levels and, because of level mixing, the possibility of a multitude of transitions between the levels in Fig. 3(b). Figure 3(a) shows EPR spectra obtained at several temperatures for B0 ' c; the frequency is 111.119 GHz s,3.7 cm21 d. As pointed out above, a complex EPR spectrum is observed for this geometry. At high fields s.4 Td, however, two distinct series of resonances are discernible—this is seen most clearly for the 20 K data, where the intensity alternates between the resonances which are labeled a and b. In contrast to the data in Fig. 1(a), most of the resonances are observed at fields above the impurity feature (labeled X). Thus, the data in Figs. 1(a) and 3(a) confirm the high degree of axial anisotropy. It is to be noted that many of the features in Fig. 3(a), observed at fields below X, occur in the same field range as the resonances seen for B k c (see Fig. 2). Thus, it would be impossible to distinguish between these resonances from measurements on polycrystalline or powder samples. The resonances labeled a persist to the lowest frequencies used in this investigation (see Fig. 4 below), while the remaining resonances are observed only at higher frequencies. From these facts, we are able to assign the a resonances to transitions between the split doublets (6MS
FIG. 3. (a) EPR spectra obtained at several temperatures, for B0 ' c (see text for explanation of labels). (b) A calculation of the corresponding energy levels [13]; the arrows indicate the transitions responsible for the resonances in (a).
2455
VOLUME 80, NUMBER 11
PHYSICAL REVIEW LETTERS
in zero field), as indicated in Fig. 3(b); these transitions are allowed only because of the strong level mixing. On the basis of the positions of the a resonances, and their frequency dependence, we have been able to simulate the data for this orientation using the same D values as above. However, in this case, the published value of g' 1.9 (Caneschi et al. [4]) is in good agreement with our data, implying an anisotropic g value. Independent measurements with B0 k a, and B0 k b, rule out any orthorhombic distortions of the crystal symmetry down to 5 K. The origin of the resonances labeled b is not as straightforward. At intermediate fields s,1 10 Td, such that the Zeeman energy is comparable to the zero-field level spacings fgmB B , s2MS 1d 3 0.47 s0.5 9 cm21 dg, the levels are strongly mixed, as noted above. Therefore, transitions are allowed between the levels in adjacent doublets, i.e., levels having 6MS and 6sMS 6 1d in zero field. However, a threshold energy exists for such transitions, corresponding to the minimum energy separation (at the point of closest approach) of the levels in question. This accounts for the disappearance of the b resonances at lower frequencies, and the rich EPR spectra observed at higher frequencies, e.g., as seen in Fig. 3(a). Finally, Fig. 4 shows magnifications of intermediate frequency data obtained for each orientation, i.e., B0 ' c (main part of Fig. 4), and B0 k c (inset). The first point to note is the disappearance of most of the b resonances for B0 ' c at this lower frequency of 57.4 GHz [see also Fig. 3(a)]. However, more significant is the increase in intensity, with decreasing temperature, of the features labeled g. In fact, the temperature dependence of g, in the main part of Fig. 4, is qualitatively similar to the temperature dependence of a10, the fundamental resonance excited from the ground state, i.e., these are the only resonances which diminish in intensity as the temperature is raised. This suggests that, like the a10 transition, a finite population of spins exists at low temperatures from which the g transitions are excited. This is particularly significant for the B0 k c data, since only transitions
FIG. 4. Magnifications of intermediate frequency EPR data obtained for each orientation; for B0 ' c (main part of figure), the frequency is 57.4 GHz; and for B0 k c (inset), the frequency is 55.16 GHz. The temperatures are indicated in the figures. Also, see text for explanation of labeling.
2456
16 MARCH 1998
between levels close to the top of the barrier are accessible with these frequencies, thus suggesting that there may be a metastable (or dynamic equilibrium) population of spins close to the barrier, even at T 0 K. It is not clear whether the g transitions can be explained within the framework of an S 10 spin system; however, they are definitely due to the sample. In conclusion, we have used a high-sensitivity EPR technique to make an extremely detailed investigation of the energy level diagram of Mn12 -Ac close to the top of the magnetization reversal barrier. The ability to study single crystals is a distinct advantage in that it allows us to observe multiple resonances, and their temperature dependence, with the magnetic field applied at any orientation with respect to the sample; we argue that this study would not have been possible using powder or polycrystalline samples. At first sight, our data appear to agree well with the behavior expected of an S 10 spin system. Furthermore, we see possible evidence supporting recent calculations in which higher(fourth)-order terms in the spin Hamiltonian are included [13]. However, agreement is not quite as good for EPR transitions close to the top of the anisotropy barrier, suggesting possible inadequacies of the S 10 Hamiltonian. From temperature dependent studies (down to 1.2 K), we find compelling evidence suggesting that a small population of spins may exist close to the top of the anisotropy barrier, even at low temperatures. This work was supported under NSF-DMR 95-10427 and by the National High Magnetic Field Laboratory.
*Electronic address:
[email protected] [1] T. Lis, Acta Crystallogr. Sect. 36, 2042 (1980). [2] For a review, see Quantum Tunneling of Magnetization — QTM’94, edited by L. Gunther and B. Barbara, NATO ASI Ser. E, Vol. 301 (Kluwer, Dordrecht, 1995). [3] R. Sessoli et al., J. Am. Chem. Soc. 115, 1804 (1993). [4] A. Caneschi et al., J. Am. Chem. Soc. 113, 5873 (1991). [5] A. L. Barra et al., Phys. Rev. B 56, 8192 (1997). [6] P. Politi et al., Phys. Rev. Lett. 75, 537 (1995). [7] M. A. Novak et al., J. Magn. Magn. Mater. 146, 211 (1995). [8] R. Sessoli et al., Nature (London) 365, 141 (1993). [9] J. R. Friedman et al., Phys. Rev. Lett. 76, 3830 (1996). [10] J. M. Hernandez et al., Phys. Rev. B 55, 5858 (1997). [11] L. Thomas et al., Nature (London) 383, 145 (1996). [12] F. Luis et al., Phys. Rev. B 55, 11 448 (1997). [13] J. A. A. J. Perenboom et al., (to be published). [14] These steps were also observed in the microwave experiment [S. Hill (unpublished)]. [15] S. Hill et al., in Millimeter and Submillimeter Waves III, edited by Mohammed N. Afsar (The International Society for Optical Engineering, Bellingham, 1996), p. 296. [16] Manufactured by ABmm, 52 Rue Lhomond, 75005 Paris, France. [17] This unconventional notation is used to maintain consistency with Ref. [13]. The D4k and D4' parameters may be related to the more widely used B40 and B44 parameters 1 3 as follows: B44 14 D4' ; B40 20 h 7 D4' 1 47 D4k j.