Biogeosciences, 13, 1753–1765, 2016 www.biogeosciences.net/13/1753/2016/ doi:10.5194/bg-13-1753-2016 © Author(s) 2016. CC Attribution 3.0 License.
Historical reconstruction of ocean acidification in the Australian region Andrew Lenton1 , Bronte Tilbrook1,2 , Richard J. Matear1 , Tristan P. Sasse3 , and Yukihiro Nojiri4 1 CSIRO
Oceans and Atmosphere, Hobart, Australia Climate and Ecosystems Co-operative Research Centre, Hobart, Australia 3 Climate Change Research Centre, Kensington Campus, University of New South Wales, Sydney, Australia 4 National Institute for Environmental Studies, Tsukuba, Japan 2 Antarctic
Correspondence to: Andrew Lenton (
[email protected]) Received: 5 May 2015 – Published in Biogeosciences Discuss.: 3 June 2015 Revised: 22 February 2016 – Accepted: 26 February 2016 – Published: 21 March 2016
Abstract. The ocean has become more acidic over the last 200 years in response increasing atmospheric carbon dioxide (CO2 ) levels. Documenting how the ocean has changed is critical for assessing how these changes impact marine ecosystems and for the management of marine resources. Here we use present-day ocean carbon observations, from shelf and offshore waters around Australia, combined with neural network mapping of CO2 , sea surface temperature, and salinity to estimate the current seasonal and regional distributions of carbonate chemistry (pH and aragonite saturation state). The observed changes in atmospheric CO2 and sea surface temperature (SST) and climatological salinity are then used to reconstruct pH and aragonite saturation state changes over the last 140 years (1870–2013). The comparison with data collected at Integrated Marine Observing System National Reference Station sites located on the shelf around Australia shows that both the mean state and seasonality in the present day are well represented, with the exception of sites such as the Great Barrier Reef. Our reconstruction predicts that since 1870 decrease in aragonite saturation state of 0.48 and of 0.09 in pH has occurred in response to increasing oceanic uptake of atmospheric CO2 . Large seasonal variability in pH and aragonite saturation state occur in southwestern Australia driven by ocean dynamics (mixing) and in the Tasman Sea by seasonal warming (in the case of the aragonite saturation state). The seasonal and historical changes in aragonite saturation state and pH have different spatial patterns and suggest that the biological responses to ocean acidification are likely to be non-uniform depending on the relative sensitivity of organisms to shifts in pH and
saturation state. This new historical reconstruction provides an important link to biological observations that will help to elucidate the consequences of ocean acidification.
1
Introduction
The ocean plays a key role in reducing the rate of global climate change, absorbing approximately 30 % of the anthropogenic CO2 emitted over the last 200 years (Ciais et al., 2013) and more than 25 % of current CO2 emissions (Le Quéré, 2015). The CO2 taken up by the ocean reacts in seawater, leading to decreases in pH and dissolved carbonate ion concentrations (CO2− 3 ), these changes being collectively referred to as ocean acidification. Over the past 200 years, it is estimated that there has been a 0.1 unit reduction in the ocean’s surface pH or a 26 % increase in the concentration of hydrogen ion concentrations in seawater (Doney et al., 2009). Current projections suggest that the increase in hydrogen ion concentration is likely to be greater than 100 % (than the preindustrial period) by the end of the century under highemissions trajectories (see, e.g., Matear and Lenton, 2014). Furthermore, these changes will persist for many millennia (see, e.g., Frolicher and Joos, 2010). Ocean acidification is likely to impact the entire marine ecosystem – from microbial communities to top predators. Factors that can be impacted include reproductive health, organism growth and physiology, species composition and distributions, food web structure, and nutrient availability (Secretariat of the Convention on Biological Diversity, 2014; Doney et al., 2012;
Published by Copernicus Publications on behalf of the European Geosciences Union.
1754
A. Lenton et al.: Historical reconstruction of ocean acidification
Dore et al., 2009; Fabry et al., 2008; Iglesias-Rodriguez et al., 2008; Munday et al., 2009, 2010). Aragonite is a metastable form of calcium carbonate that is produced by major calcifiers in coral reef ecosystems, including reef building corals, and is the predominant biogenic carbonate mineral in warm and shallow waters of the tropics (Stanley and Hardie, 1998). The aragonite saturation state of seawater has been used as a proxy for estimating net calcification rates for corals (see, e.g., Langdon, 2005). Projections suggest that by as early as 2050 growth rates of reef building coral may slow to levels such that coral reefs may start to dissolve (Silverman et al., 2009). The impact of acidification combined with other stressors, such as ocean warming, has implications for the health, longer-term sustainability, and biodiversity of reef ecosystems (Doney et al., 2012; Dore et al., 2009). The impact of these changes on the marine environment is of fundamental importance for the management of future marine resources for nations like Australia with its extensive coastline and regions of international significance such as the Great Barrier Reef. A historical record of the changes that have occurred since the preindustrial period allows us to (i) correctly attribute observed responses over the historical period; (ii) assess how well climate models represent spatial patterns of ocean acidification for the period that overlaps observations (e.g. Fifth assessment report of the Intergovernmental Panel on Climate Change, IPCC AR5); (iii) quantify the magnitude of seasonal variability and identify the drivers of this variability; and (iv) provide important boundary conditions for high-resolution regional models. Despite the potential impacts of ocean acidification for the Australian region, the number of carbonate chemistry measurements remains sparse. The few data sets collected only characterize variability and the mean state in specific environments (see, e.g., Shaw et al., 2012; Albright et al., 2013) or attempt to synthesize these into regional or habitat-based studies (e.g. Gagliano et al., 2010). The only seasonally resolved observational data set available to characterize the mean state around Australia in the present day is Takahashi et al. (2014), but these data have coarse resolution and only focus on the open-ocean areas. Studies that have reconstructed the longer-term variability of ocean acidification from coral proxies have been of a regional scale and are temporally coarse (see, e.g., Pelejero et al., 2005, and Calvo et al., 2007). The goals of our study are (i) to reconstruct the observed variability in and mean state of pH and aragonite saturation in the present day around Australia at high spatial resolution and (ii) to reconstruct the changes that have occurred in the Australian region over the last 140 years (1870–2013). To this end, we first develop a new salinity–alkalinity relationship for Australian waters based on observations collected around Australia over the last 2 decades. We then assess our reconstructed pH and aragonite saturation state fields with data collected around Australia at the Integrated Marine Observing System National Reference Stations (IMOSBiogeosciences, 13, 1753–1765, 2016
Figure 1. Locations (circles) of the concomitant measurements of alkalinity and salinity used to develop a new salinity–alkalinity relationship for the Australian region; the cruises are listed in Table 1. Overlain on this plot (red triangles) are the locations of IMOS National Reference Stations (NRS) used in this study.
NRS; Lynch et al., 2014). Finally, we present the reconstructed aragonite saturation state and pH in the Australian region and discuss the seasonal and long-term changes in these fields. The reconstructed fields as well as the calcite saturation state, dissolved inorganic carbon dioxide (DIC), total alkalinity (TALK), sea surface temperature, and salinity are all available online at http://imos.aodn.org.au. 2
Methods
In this study we focus on the Australian region (Fig. 1) delineated nominally by the subtropical front (45◦ S) in the south and the Equator (0◦ ) in the north and between 95 and 170◦ E. This region encompasses part of the eastern Indian Ocean and Indonesian Seas and a large part of the Tasman and Coral seas. The seasonal cycle of physical, chemical, and biological properties of the surface ocean mixed layer in this region is described in Condie and Dunn (2006) and will not be described further in this paper. The characterization of the carbon system requires two of six potential carbon parameters (i.e. pH, total dissolved inorganic carbon, total alkalinity, partial pressure of carbon dioxide pCO2 , bicarbonate, carbonate), from which all the parameters of the ocean carbon system can be calculated. We first use pCO2 and total alkalinity to reconstruct the changes in ocean acidification. Oceanic values of pCO2 were taken from an updated version of Sasse et al. (2013) that used a self-organizing multiple linear output (SOMLO) approach to predict pCO2 values around Australia on a 1◦ × 1◦ grid each month for the nominal year of 2000. The SOMLO approach utilizes a global network of bottle-derived pCO2 and corresponding standard hydrographic parameters (SHP; temperature, salinity, dissolved oxygen, and phosphate; n = 17 753), collected from more than 263 cruises and the Hawaii Ocean Time-series (HOT) and Bermuda Atlantic Time-series Study (BATS) time sewww.biogeosciences.net/13/1753/2016/
A. Lenton et al.: Historical reconstruction of ocean acidification
1755
Table 1. Cruise data used to derive the salinity versus total alkalinity relationship for surface waters in Australian regional seas. FLUPAC: Flux dans l’ouest du Pacifique équatorial; OISO: Océan Indien Service d’Observation; SS: Southern Surveyor. Voyage1 Section P13 Section P10 Section P21 Section P9 FLUPAC Section I8S/I9S Section I9N Section SR3 Section I8N/I5E Section I3 Section Section I4 Section I10 Section I2 Section SR3 Section I2 Section SR3 Section I5 OISO-10 Section P6W Section I3 Section I9S Section P10 TransFuture5 Section I8S Section I9N Section I5 Section P21 Section P6W SS201004
Region/expocode
Latitude
Longitude
Period
West Pacific 31VIC92_0_1_2 West Pacific 3250TN026/1 Coral Sea 318M19940327 West Pacific 49RY9407_1 West Pacific 35A319940923 Indian Ocean 316N145_5 Indian Ocean 316N145_6 Southern Ocean AR9404_1 Indian Ocean 316N145_7 Indian Ocean 316N145_8 West Pacific 49HG19950414 Indian Ocean 3175MB95_07 Indian Ocean 316N145_13 Indian Ocean 316N145_14_15 Southern Ocean 09AR19960822 Indian Ocean 09AR20000927 Southern Ocean 09AR20011029 Indian Ocean 74AB20020301 Southern Ocean 35MF20030123 West Pacific 49NZ20030803 Indian Ocean 49NZ20031209 Southern Ocean I09S_09AR20041 West Pacific 49NZ20050525 Tasman Sea–Coral Sea Indian Ocean I08S_33RR20070 Indian Ocean I09N_33RR20070 Indian Ocean I05_33RR200903 West Pacific 49NZ20090521 West Pacific 318M20091121 Indian Ocean
0–5◦ S 0–5◦ S 17–25◦ S 0–3◦ S 0–15◦ S 32–45◦ S 0–32◦ S 44–45◦ S 31–34◦ S 20–22◦ S 1–35◦ S 31–43◦ S 9–25◦ S 8–9◦ S 44–45◦ S 28–34◦ S 44–45◦ S 31–35◦ S 45◦ S 30◦ S 20–22◦ S 35–44◦ S 0–4◦ S 10–40◦ S 28–45◦ S 0–28◦ S 31–35◦ S 18–25◦ S 30◦ S 21–23◦ S
164–165◦ E 145–146◦ E 155–170◦ E 142–143◦ E 165–167◦ E 95–115◦ E 93–106◦ E 146–147◦ E 91–115◦ E 90–114◦ E 153–163◦ E 90–110◦ E 106–112◦ E 90–106◦ E 146–147◦ E 94–115◦ E 146–147◦ E 91–115◦ E 146◦ E 154–170◦ E 90–113◦ E 115◦ E 145–146◦ E 144–172◦ E 94–95◦ E 93–95◦ E 90–115◦ E 154–170◦ E 154–170◦ E 112–115◦ E
October 1992 October 1993 June 1994 August 1994 September 1994–October 1994 December 1994–January 1995 January 1995–February 1995 January 1995–February 1995 April 1995 April 1995–May 1995 April 1995–May 1995 September 1995–October 1995 November 1995 December 1995 September 1996–October 1996 September 2000–November 2000 October 2001 April 2002 January 2003 August 2003 January 2004 December 2004 June 2005 February 2007–September 2011 March 2007 March 2007–April 2007 April 2009–May 2009 June 2009 November 2009–December 2009 May 2010
Total
Observations 13 11 49 7 66 29 100 5 57 31 25 28 76 37 5 66 7 34 5 40 33 18 18 1460 79 103 128 52 93 92 2772
1 http://cdiac.ornl.gov/ftp/oceans/
ries sites. For more information on the individual cruise data, please see Table A1 in Sasse et al. (2013). These data were first clustered into 49 neurons (or bins) based on similarities and homogeneity. Principle component regressions were then derived between pCO2 and the SHP using data within each neuron. This can be thought of as a local-scale optimization, which follows the nonlinear clustering routine. To then predict pCO2 values for any set of SHP, a similarity measure is first used to establish which neuron best represents the SHP measurements. Once established, pCO2 values are predicted using the regression parameters of that neuron. Independent testing by Sasse et al. (2013) reveals that the SOMLO approach predicts open-ocean pCO2 values with a global uncertainty of 22.5 µatm (RMSE), which decreases to 16.3 µatm (RMSE; n = 859) within the Australia region. Monthly pCO2 climatologies presented in Sasse et al. (2013) were derived using the World Ocean Atlas (WOA) 2009 product (Antonov et al., 2010; Garcia et al., 2010a, b; www.biogeosciences.net/13/1753/2016/
Locarnini et al., 2010), which we update here via the WOA 2013 product (Garcia et al., 2014a, b; Locarnini et al., 2013; Zweng et al., 2013). We note that these pCO2 values provide significantly higher spatial data coverage than the global climatology of Takahashi et al. (2009). To extend the oceanic pCO2 values into the past and the future, the value of 1pCO2 (pCO2air –pCO2sea ) was first calculated using the oceanic pCO2 values of Sasse et al. (2013) for the year 2000. This 1pCO2 value was then transformed into a time series of oceanic pCO2 between 1870 to 2013 by adding it to the observed atmospheric CO2 value over this period using the atmospheric history constructed by Le Quéré et al. (2015). As only limited measurements of total alkalinity (TALK) exist in the Australian region, we develop and use the relationship between TALK and salinity to estimate TALK in the Australian region. While many studies have quantified this relationship globally (e.g. Takahashi et al., 2009; Lee et al., Biogeosciences, 13, 1753–1765, 2016
Total alkalinity (micromol kg – 1)
1756
A. Lenton et al.: Historical reconstruction of ocean acidification Table 2. The biases and correlation coefficients calculated (R) at the NRS sites for SST (HadiSST) and reconstructed aragonite saturation state (AR ) within the Australia number of observations used in calculating the biases and correlations.
2400 2350 2300
Lat
Long
SST bias
SST R
AR bias
AR R
n
33◦ 56 S 35◦ 49 S 42◦ 36 32◦ 25 S 21◦ 52 S 19◦ 19 S 34◦ 5 S 27◦ 18 S
121◦ 51 E 136◦ 27 E 148◦ 14 E 115◦ 25 S 113◦ 57 S 147◦ 27 S 151◦ 6 S 153◦ 6 S
0.8 0.38 0.6 1.01 0.08 0.13 0.82 0.08
0.93 0.84 0.93 0.92 0.95 0.94 0.89 0.96
0.09 0.01 0.07 0.06 0.17 0.27 0.09 0.06
−0.06 0.03 0.83 0.26 0.62 0.45 0.58 0.78
16 27 40 33 11 37 46 40
2250 Esperance Kangaroo Island Maria Island Rottnest Island Ningaloo Yongala Port Hacking North Stradbroke
2200 2150 33
34
35
36
Salinity
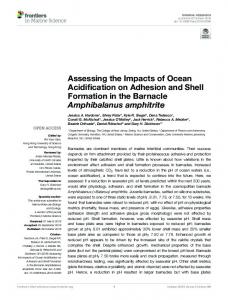
Figure 2. The new salinity–alkalinity relationship developed for the Australian region based on observations (Fig. 1) collected in the period 1992–2011. The individual cruises are listed in Table 1.
2006) and regionally (e.g. Kuchinke et al., 2014), to date no specific relationship has been developed for the entire Australian region. To develop this relationship 2772 concomitant measurements of salinity and alkalinity collected in the Australian region over the last 2 decades were used (Table 1; Fig. 1). From these data we determined our alkalinity–salinity relationship, shown in Fig. 2, to be TALK (µmol kg−1 ) = (2270.0 ± 0.1) + (64.0 ± 0.3) × (SAL − 35).
(1)
This relationship is based on a type-2 linear regression, accounting for uncertainty in both the salinity and TALK measurements of 0.05 and 3 µmol kg−1 respectively. This new relationship was applied to the climatology of salinity (0.5◦ × 0.5◦ day−1 ) taken from the Commonwealth Scientific and Industrial Research Organisation (CSIRO) Atlas of Regional Seas 2012 (CARS; Ridgway et al., 2002) as, at present, no long-term high spatial and temporal resolution observations of ocean surface salinity exist around Australia (nor globally). Nevertheless, based on sparse measurements Durack and Wijffels (2010) suggested that there has been an amplification of the global hydrological cycle that has resulted in surface salinity changes over the last 50 years. The estimated changes of Durack and Wijffels (2010) around Australia are not uniform and are typically less than ±0.1, which introduces only a 6.4 µmol kg−1 change in TALK for the 50-year period. The influence of the changes on the carbonate chemistry (pH and aragonite saturation state changes of about 0.001 and 0.02 respectively), are small compared to the changes predicted from increasing atmospheric CO2 , thereby allowing us to assume that the CARS salinity used has not changed in our calculations. Sea surface temperature (SST) measurements from 1870 to the present day were obtained from the Hadley Centre Sea Ice and Sea Surface Temperature (HadiSST) v1.1 data set (1◦ × 1◦ ; Rayner et al., 2003). Higher-resolution data sets do exist, e.g. NOAA Optimum Interpolation (OI) Biogeosciences, 13, 1753–1765, 2016
V2 (0.25◦ × 0.25◦ ; Reynolds et al., 2007), but none have estimates beyond the last 3 decades, and we chose the 1◦ × 1◦ product to extend our reconstruction back to the preindustrial period. We first calculated DIC from TALK, SST, and pCO2 in the period 1870–2013, using the method following Lenton et al. (2012), who used the dissociation constants of Mehrbach et al. (1973) refitted by Dickson and Millero (1987). Our implementation of carbonate chemistry is derived from the Ocean Carbon-Cycle Model Intercomparison Project Phase (OCMIP3) framework (Aumont et al., 2004). This approach calculates the magnitude of the seasonal cycle of DIC, rather than pCO2 . The pCO2 seasonality changes over time in response to changes in the Revelle factor and will influence the air–sea gradient in pCO2 , which drives net flux across the air–sea boundary (see, e.g., Hauck and Völker, 2015). To correct for this, we first calculated the (detrended) seasonal anomaly of DIC in the period 1995–2006. We then added this seasonal cycle of DIC to the (deseasonalized) long-term DIC record (1870–2013). This allows us to reconstruct the historical DIC fields and the changes in the magnitude of the oceanic pCO2 in response to the Revelle factor to be accounted for. We then added this seasonal cycle to the deseasonalized long-term DIC record (1870–2013) to reconstruct the DIC fields, thereby allowing pCO2 to change. The reconstructed DIC fields were then used in conjunction with our derived TALK fields to calculate changes in ocean acidification in the period 1870–2013. As the resolution of SST and pCO2 fields are nominally 1◦ × 1◦ monthly fields, all values were calculated on a 1◦ × 1◦ grid at in situ temperatures. The values of pH were calculated using the total scale, following recommendations of Riebesell et al. (2010), while aragonite and calcite saturation states were calculated following Mucci (1983). To assess the uncertainty in the reconstructed ocean acidification values, we compared these with the values calculated from individual cruises; this allowed us to estimate the uncertainty (RMSE) to be 0.02 and 0.1 in pH and aragonite saturation state respectively. www.biogeosciences.net/13/1753/2016/
A. Lenton et al.: Historical reconstruction of ocean acidification 3
3.1
1757
Results and discussion
Assessment of the mean state and seasonal variability at coastal NRS sites
The ability of our reconstruction to predict the mean state and seasonality of ocean acidification around Australia was evaluated by comparing our calculated aragonite saturation state and SST data with carbonate chemistry and SST measurements made over the last few years at seven of the eight Australian IMOS-NRS sites (Fig. 1; https://imos.aodn.org.au). The Darwin NRS site was not used in the comparison due to the small number of measurements at this site. To assess how well the observed response at the NRS sites were captured, we calculated both the correlation coefficient (R) and the bias (or bias function) shown in Table 2. The observed responses from the NRS sites compared with HadiSST are shown in Fig. 3. There is a good correlation in SST at all sites (r > 0.84, Table 2), providing confidence that HadiSST represents the character of the seasonal variability. However, while HadiSST captures the SST variability, there were some biases in the mean SST value (Table 2). These biases, e.g. at Rottnest Island, likely reflect local processes in the coastal environment at the NRS (see, e.g., Lima and Wethey, 2012) that are poorly captured by the much larger spatial scale of the HadiSST product. The reconstructed aragonite saturation state (AR ) shows good agreement with values calculated from observations (Fig. 4). The implication is that the salinity–total-alkalinity relationship and calculated pCO2 fields, which are derived mostly from offshore data, are valid for most of the IMOSNRS sites, which tend to be located on the outer shelf. Exceptions are the Ningaloo and Yongala sites, where our reconstruction overestimates the observed values of the aragonite saturation state, while SST agrees well with HadiSST (Table 2). The total-alkalinity–salinity relationship may not hold at these two sites due to the influence of net calcification on nearby coral reef systems and possibly sediment–water exchange that could alter the total alkalinity (see, e.g., Shaw et al., 2012). Apart from the offsets at the Yongala and Ningaloo sites, the reconstructed aragonite saturation state does reproduce the range determined at most locations (e.g. Maria Island, Port Hacking, Rottnest, and North Stradbroke Island). Limited sampling at Kangaroo Island, Esperance, and Ningaloo sites prevented direct comparisons of the seasonal variability, although the reconstructed variability appears plausible based on available measurements. Overall, the ability of our reconstruction to capture the mean state and variability of ocean acidification at the IMOSNRS sites gives us confidence in the reconstruction of ocean acidification in the shelf and offshore waters around Australia and to extend our reconstruction back in time. www.biogeosciences.net/13/1753/2016/
Figure 3. Comparison of sea surface temperature from the observations at the IMOS National Research Stations with HadiSST (Rayner et al., 2003).
3.2
Annual mean state
The mean state of aragonite saturation around Australia for the period 2000–2009 is shown in Fig. 5. The mean state shows a strong latitudinal gradient in aragonite saturation increasing from values of 1.8 in the southern part of the domain to values greater than 3.9 across northern Australia and into the Coral Sea. The Coral Sea and western Pacific form part of the Coral Triangle, a globally significant region in terms of coral and marine diversity (Bell et al., 2011). We see that our reconstructed values in the Coral Sea and into the western Pacific are also consistent with the observational values of 3.9 calculated by Kuchinke et al. (2014) in this region. This value is well above 3.5, considered to be a key threshold at which corals move from healthy to marginal conditions (Guinotte et al., 2003). Ricke et al. (2013), using results from an ensemble of Coupled Model Intercomparison Project Phase 5 (CMIP5) simulations and Global Ocean Data Analysis Project (GLODAP) data reported that in the Coral Sea, the present-day Biogeosciences, 13, 1753–1765, 2016
1758
A. Lenton et al.: Historical reconstruction of ocean acidification
Figure 5. Upper: the reconstructed annual mean aragonite saturation state and pH for the period 2000–2009. Lower: the seasonal variability given by 2 times the standard deviation (2σ ) of the seasonal variability in aragonite saturation state and pH from the period 2000–2009.
gradient, and TALK. Consequently, the spatial differences between the aragonite saturation state and pH are driven by temperature (see, e.g., Zeebe and Wolf-Galdrow, 2001). 3.3
Figure 4. Comparison of aragonite saturation state (AR ) from the observations at the IMOS National Research Stations with the reconstructed values.
values of the aragonite saturation state are much less than the 3.5 threshold (Guinotte et al., 2003). These differences are explained by their correction of the CMIP5 simulations to GLODAP DIC and TALK values (Key et al., 2004), for which there are very few measurements in this region. The annual mean state of pH for the period 2000–2009 is shown in Fig. 5. In contrast with the aragonite saturation state there is an increasing latitudinal gradient from ∼ 8.1 in northern Australia to ∼ 8.14 in southern Australia. The reconstructed values show good agreement with observations collected on the southern Papua New Guinea coast by Fabricius et al. (2011). However, south of Australia, the pH decreases again to values comparable with those seen in northern Australia. The spatial gradients of pH and the aragonite saturation state as a function of latitude are consistent with the largescale gradients calculated from observations of carbonate chemistry from GLODAP (Key et al., 2004). The distribution of the aragonite saturation state is set by both the largescale distribution of SST, which shows a strong latitudinal Biogeosciences, 13, 1753–1765, 2016
The seasonal cycle
The seasonal standard deviation (2σ ) of the aragonite saturation state and pH reveals large spatial differences in the magnitude of the seasonal variability (Fig. 5, lower panels). Large seasonality in aragonite saturation state is evident at > 0.4 units. This spatial pattern of seasonality is quite heterogeneous, with the largest variability occurring along the east coast of Australia, in the Tasman Sea, and off southern Australia. The low seasonal variability predicted in the Coral Sea means that the aragonite saturation state is above 3.5 even in the winter months. Strong and heterogeneous seasonality in pH is also present at > 0.06 units around Australia, with the largest range in southern Australia. The locations of large seasonality in aragonite saturation state and pH off southern Australia are associated with regions of deep winter mixing > 200 m (Condie and Dunn, 2006). Here, the seasonal deepening of the mixed layer in winter supplies carbon, alkalinity, and nutrients to the surface ocean, which in turn alter the chemistry of the surface waters inducing large seasonal variability in ocean acidification values in the surface ocean. That the large seasonal variability in aragonite saturation state is not associated with large seasonal variability in pH along the east coast of Australia and in the Tasman Sea suggests that here the dominant driver of seasonality variability is SST rather than ocean dynamics. An important consequence of the decoupling of the spatial patterns of pH and the aragonite saturation state is that the biological responses to ocean acidification on the seasonal www.biogeosciences.net/13/1753/2016/
A. Lenton et al.: Historical reconstruction of ocean acidification
1759
Figure 6. Upper: the annual mean aragonite saturation state and pH for 2005 from Takahashi et al. (2014). Lower: standard deviation (2σ ) of the seasonal variability in aragonite saturation state and pH for 2005 from Takahashi et al. (2014).
scale may also be decoupled as the susceptibility to pH and aragonite saturation varies between organisms. This has implications for understanding ecosystem responses to ocean acidification. Areas of large seasonal variability are also present along parts off northern Australia and off Papua New Guinea. These are primarily driven by large seasonal changes in sea surface salinity, in turn driving changes in TALK and DIC, which influence the pH and the aragonite saturation state. 3.4
Comparison with Takahashi et al. (2014)
In this section the reconstructed annual mean and seasonality of pH and the aragonite saturation state are compared with those that were calculated nominally for 2005 (Takahashi et al., 2014), hereafter denoted T14 (Fig. 6). The data of T14 are based on oceanic pCO2 measurements and regional potential alkalinity versus salinity relationships, at a resolution of 4◦ × 5◦ . Since T14 excludes the equatorial Pacific (north of 8◦ S) data and coastal data, we can only compare our results to T14 away from these regions. The T14 spatial pattern of the annual mean aragonite saturation state appears to be in reasonable agreement with our www.biogeosciences.net/13/1753/2016/
reconstruction for most waters around Australia. An exception is off northwestern Australia where the mean aragonite saturation state of T14 appears to be an underestimate. Large differences in the seasonal changes also occur off the east coast of Australia and to the south of Australia. The magnitude of the seasonal variability (in T14) is lower than our reconstruction. The pH values of T14 and our reconstruction both show the highest values in the subtropical waters, although T14 mean values are higher off eastern Australia and lower to the south of Australia. Overall, there is quite poor agreement in both the magnitude and spatial pattern of pH variability for most regions. That the spatial pattern of the seasonal cycle of the aragonite saturation state is not reproduced along the east coast of Australia and in the Tasman Sea and that the variability in southern Australia is not seen in either pH or aragonite saturation state suggests that while the seasonal response of SST is captured in T14, the seasonal ocean dynamics are not well represented. Furthermore, the magnitude of the seasonal cycle appeared to be underestimated in T14; this likely reflects the coarser resolution of the T14 product than our recon-
Biogeosciences, 13, 1753–1765, 2016
1760
A. Lenton et al.: Historical reconstruction of ocean acidification
Figure 7. Annual mean 120-year differences (between 1990–2009 and 1870–1889) in aragonite saturation state and pH.
Figure 8. Annual mean 120-year differences (between 1990–2009 and 1870–1889) in SST.
struction (4◦ × 5◦ vs. 1◦ × 1◦ ) and the spatial interpolation required to generate T14. As a result of this analysis we believe that in the Australian region our reconstruction offers an improved and higherresolution representation of the mean state and seasonality than T14. This comparison also underscores the need for such ongoing regional analyses and the limitations of using large-scale global products such as T14 to understand regional variability and change. 3.5
Historical changes
The historical change in ocean acidification since 1870 is represented in Fig. 7 by the changes in the mean annual values of pH and the aragonite saturation state between the period 1870–1889 and 1990–2009. The corresponding changes in sea surface temperature (HadiSST; Rayner et al., 2003) are shown over the same period in Fig. 8 and indicate a small net warming of the waters around Australia. This warming has been relatively uniform with the exception of the northBiogeosciences, 13, 1753–1765, 2016
ern edge of the Southern Ocean and southeastern Australia, which has been identified as a marine hotspot (Hobday and Pecl, 2013). Consequently, the SST changes alone cannot explain the large ocean acidification changes, suggesting that these are due to changes in ocean carbon uptake rather than changes in SST. The changes with time in pH and saturation state at the IMOS-NRS sites are plotted in Fig. 9. We estimate that over the last 120 years there has been a (spatial) mean decrease in aragonite saturation state of 0.49. However, as illustrated in Fig. 9, these decreases are not constant with time and the change in aragonite saturation state is accelerating. There is also a strong latitudinal gradient in the magnitude of the decrease, with larger changes occurring in northern Australian waters (Ningaloo and North Stradbroke Island) and smaller changes to the south (Maria Island). This pattern of change around Australia is consistent with the large-scale chemical buffering capacity of the ocean (Revelle factor), which increases from ∼ 9 at the Equator to > 11 at the bottom of the study region (see, e.g., Sabine et al., 2004). Consistent with the aragonite saturation state over the last 120 years, there has been a net decease in pH of 0.09 units, very close to the estimated global decrease of 0.1 pH by Caldeira and Wickett (2003) over a similar period. Consistent with aragonite saturation, a strong latitudinal gradient in pH is evident, but it is the inverse of aragonite saturation state. The largest changes in pH have occurred in southern Australia, e.g. Maria Island (Fig. 9), with the smallest changes in northern Australian waters (e.g. Yongala; Fig. 9 shows about 75 % of the change experienced in the south). This spatial response of pH is primarily set by the gradient of ocean mean temperature that acts to increase pH in colder waters (Fig. 8). 3.6
Robustness of the reconstruction
The reconstructed time series of the aragonite saturation state and pH are driven wholly by SST and atmospheric CO2 , thereby neglecting any changes in salinity and/or biological www.biogeosciences.net/13/1753/2016/
A. Lenton et al.: Historical reconstruction of ocean acidification
1761
Figure 9. Reconstructed time series of the annual mean aragonite saturation state (upper) and pH (lower) at the IMOS-NRSs. Overlain on the upper plot is the threshold for the transition to marginal conditions for coral reefs (3.5) from Guinotte et al. (2003).
production. Observationally, studies have suggested that in some regions around Australia changes in salinity over the last 50 years have occurred (see, e.g., Durack and Wijffels, 2010), while other regions have remained constant over the last 200 years (see, e.g., Calvo et al., 2007). If we assume, consistent with Durack et al. (2012), that the changes are related to evaporation–precipitation (E − P ) rather than local riverine input, which can have large local inputs of DIC, TALK, and potentially nutrients (Hieronymus and Walin, 2013), then any increase in salinity can be treated as freshwater input only. Consequently, given the small trends, relative to the mean, and the very low sensitivity of oceanic pCO2 to freshwater input (< 1 %), it is highly unlikely that such changes would make such a significant difference to pH or aragonite over the last 50 years. This is perhaps not surprising given that changes in freshwater water input act as a dilution flux, i.e. acting equally on DIC and total alkalinity (Lenton et al., 2012). The role of nutrients driving variability and change in ocean acidification is also not considered in this study, as we
www.biogeosciences.net/13/1753/2016/
assume that nutrients are zero around Australia. While this is not strictly true, most waters around Australia are oligotrophic in nature (Condie and Dunn, 2006). If the climatological values of silicate and nitrate from CARS (Ridgway et al., 2002) are used to calculate carbonate chemistry, we find only a small bias (0.0007 in aragonite saturation state and 0.005 in pH) in our reconstruction (well within the uncertainty). While we would like to have used a time-evolving field, analogous to salinity, at present no long-term time series are available to use in this reconstruction. In this study we assumed that the seasonal air–sea disequilibrium (1pCO2 ) is seasonally time invariant, i.e. there is no interannual variability. While some studies have argued that this variability maybe important on shorter-term timescales (see, e.g., Sitch et al., 2015), it is less clear how important these are on longer timescales (see, e.g., McKinley et al., 2011). This is further complicated as the existing products of oceanic pCO2 fields, e.g. Landschützer et al. (2014), only extend back in time several decades, reflecting the limit of historical observations. Nevertheless, to assess how impor-
Biogeosciences, 13, 1753–1765, 2016
1762
A. Lenton et al.: Historical reconstruction of ocean acidification
tant this term could be, we assumed an upper bound from the published study of McNeil and Matear (2008), who, in the more dynamically and biologically active Southern Ocean, calculated the error introduced by assuming a fixed (air–sea) disequilibrium term. From this study we can see that for an equivalent increase in (future) atmospheric CO2 levels, the error introduced into our calculation of pH and the aragonite saturation state falls well within the reported uncertainty of our reconstruction.
4
Conclusions
To explore how Australia’s marine environment has changed, we have synthesized newly acquired in situ observations of carbon chemistry around Australia to (i) provide a new estimate of the mean state and seasonality of pH and the aragonite saturation state and (ii) reconstruct the changes in ocean acidification around Australia since 1870. In this work we developed a new total alkalinity–salinity relationship for the Australian region. This relationship was used in conjunction with observed salinity and oceanic and atmospheric CO2 and SST data to reconstruct the present and past changes in pH and aragonite saturation state. Our reconstructed fields were compared to the Takahashi et al. (2014) climatology and high-resolution data collected at the IMOSNRS sites. We found good agreement between our reconstructed fields for the observed annual mean and seasonal cycles at the shelf IMOS-NRS sites except for regions such as the Great Barrier Reef where near-shore processes and coral reef metabolism could alter the pH and saturation state. Our regional reconstruction provides much higher spatial and temporal resolution than previous global estimates. This highlights the importance of regional analyses and reconstructions in estimating and understanding region changes. An important result of this study is that at present the Coral Sea is not experiencing marginal conditions (values of the aragonite saturation state < 3.5) with respect to ocean acidification as has been suggested. Large changes in aragonite saturation state and pH have occurred over the last 140 years in response to increasing oceanic uptake of atmospheric CO2 . A net (spatial) mean decrease in pH of 0.09 is seen in the period from 1870–1899 to 1990–2009, together with a net decrease in aragonite saturation state of 0.49, both of which are consistent with previous estimates of the historical changes. Importantly, due to ocean chemistry, the spatial pattern of the change in aragonite saturation state and pH are different. In this study we found the largest changes in aragonite saturation state occurred at midand low latitudes, and the largest changes in pH occurred at higher latitudes. The large seasonal variability around Australia is heterogeneous, with distinctly different spatial patterns in aragonite saturation state and pH, with the exception of south of Australia where variability is driven by deep winter mixing. For Biogeosciences, 13, 1753–1765, 2016
the aragonite saturation state, large seasonal variability occurs off the east coast of Australia and in the Tasman Sea, driven by seasonal variability in ocean temperatures That the variability in aragonite saturation state and pH are spatially different over temporal and regional scales implies that biological responses and impacts likely vary. Further, this suggests that both pH and the aragonite (or calcite) saturation state need to be considered independently in assessing ecosystem responses and changes. This historical reconstruction also provides useful information to link with biological observations to help understand observed changes and aid in the design of future work, thereby elucidating the consequences of ocean acidification. To facilitate this, all of the reconstructed data are available at http://imos.aodn.org.au. Acknowledgements. Andrew Lenton, Bronte Tilbrook, and Richard J. Matear acknowledge support from the Australian Climate Change Science Program. Tristan P. Sasse would like to acknowledge funding support for the CSIRO carbon cluster. Yukihiro Nojiri was supported by JSPS KAKENHI Grant no. 26220102. The authors would like to thank the Integrated Marine Observing System (IMOS) for providing data from the Australian National Research Sites (NRSs) and Kate Berry and Kristina Patterson for their analysis of the observed carbon data. Edited by: C. Klaas
References Albright, R., Langdon, C., and Anthony, K. R. N.: Dynamics of seawater carbonate chemistry, production, and calcification of a coral reef flat, central Great Barrier Reef, Biogeosciences, 10, 6747–6758, doi:10.5194/bg-10-6747-2013, 2013. Antonov, J. I., Seidov, D., Boyer, T. P., Locarnini, R. A., Mishonov, A. V., Garcia, H. E., Baranova, O. K., Zweng, M. M., and Johnson, D. R.: World Ocean Atlas 2009, Volume 2: Salinity, edited by: Levitus, S., NOAA Atlas NESDIS 69, US Government Printing Office, Washington, D.C., 184 pp., 2010. Aumont, O., Le Quéré, C., and Orr, J. C.: NOCES Project Interannual HOWTO, 2004, available at: http://ocmip5.ipsl.jussieu.fr/ OCMIP/phase2/simulations/ (last access: July 2009), 2004. Bell, J. D., Johnson, J. E., Ganachaud, A. S., Gehrke, P. C., Hobday, A. J., Hoegh-Guldberg, O., Le Borgne, R., Lehodey, P., Lough, J. M., Pickering, T., Pratchett, M. S., and Waycott, M.: Vulnerability of Tropical Pacific Fisheries and Aquaculture to Climate Change, Secretariat of the Pacific Community, Noumea, New Caledonia, 2011. Caldeira, K. and Wickett, M. E.: Anthropogenic carbon and ocean pH, Nature, 425, 365–365, doi:10.1038/425365a, 2003. Calvo, E., Marshall, J. F., Pelejero, C., McCulloch, M. T., Gagan, M. K., and Lough, J. M.: Interdecadal climate variability in the Coral Sea since 1708 AD, Palaeogeogr. Palaeocl., 248, 190–201, doi:10.1016/J.Palaeo.2006.12.003, 2007. Ciais, P., Sabine, C., Bala, G., Bopp, L., Brovkin, V., Canadell, J., Chhabra, A., Defriers, R., Galloway, J. N., Heinman, M., Jones,
www.biogeosciences.net/13/1753/2016/
A. Lenton et al.: Historical reconstruction of ocean acidification C. D., Le Quéré, C., Myneni, R. B., Piao, S., and Thornton, P.: Carbon and Other Biogeochemical Cycles, in: Climate Change 2013: The Physical Science Basis, Contribution of Working Group I to the Fifth Assessment Report of the Intergovernmental Panel on Climate Change, edited by: Stocker, T. F., Qin, D., Plattner, G.-K., Tignor, M., Allen, S. K., Boschung, A., A, N., Xia, Y., V., B., and Midgley, P. M., Cambridge University Press, Cambridge, United Kingdom and New York, 2013. Condie, S. A. and Dunn, J. R.: Seasonal characteristics of the surface mixed layer in the Australasian region: implications for primary production regimes and biogeography, Mar. Freshwater Res., 57, 569–590, 2006. Dickson, A. G. and Millero, F. J. : A comparison of the equilibrium constants for the dissociation of carbonic acid in seawater media, Deep-Sea Res. Pt. I, 34, 1733–1743, doi:10.1016/01980149(87)90021-5, 1987. Doney, S. C., Balch, W. M., Fabry, V. J., and Feely, R. A.: Ocean Acidification: A Critical Emerging Problem for the Ocean Sciences, Oceanography, 22, 16–25, doi:10.5670/Oceanog.2009.93, 2009. Doney, S. C., Ruckelshaus, M., Duffy, J. E., Barry, J. P., Chan, F., English, C. A., Galindo, H. M., Grebmeier, J. M., Hollowed, A. B., Knowlton, N., Polovina, J., Rabalais, N. N., Sydeman, W. J., and Talley, L. D.: Climate Change Impacts on Marine Ecosystems, Annu. Rev. Mar. Sci., 4, 11–37, doi:10.1146/AnnurevMarine-041911-111611, 2012. Dore, J. E., Lukas, R., Sadler, D. W., Church, M. J., and Karl, D. M.: Physical and biogeochemical modulation of ocean acidification in the central North Pacific, P. Natl. Acad. Sci. USA, 106, 12235– 12240, doi:10.1073/Pnas.0906044106, 2009. Durack, P. J. and Wijffels, S. E.: Fifty-Year Trends in Global Ocean Salinities and Their Relationship to Broad-Scale Warming, J. Climate, 23, 4342–4362, doi:10.1175/2010jcli3377.1, 2010. Durack, P. J., Wijffels, S. E., and Matear, R. J.: Ocean Salinities Reveal Strong Global Water Cycle Intensification During 1950 to 2000, Science, 336, 455–458, doi:10.1126/Science.1212222, 2012. Fabricius, K. E., Langdon, C., Uthicke, S., Humphrey, C., Noonan, S., De’ath, G., Okazaki, R., Muehllehner, N., Glas, M. S., and Lough, J. M.: Losers and winners in coral reefs acclimatized to elevated carbon dioxide concentrations, Nature Climate Change, 1, 165–169, doi:10.1038/Nclimate1122, 2011. Fabry, V. J., Seibel, B. A., Feely, R. A., and Orr, J. C.: Impacts of ocean acidification on marine fauna and ecosystem processes, ICES J. Mar. Sci., 65, 414–432, doi:10.1093/Icesjms/Fsn048, 2008. Frolicher, T. L. and Joos, F.: Reversible and irreversible impacts of greenhouse gas emissions in multi-century projections with the NCAR global coupled carbon cycle-climate model, Clim. Dynam., 35, 1439–1459, doi:10.1007/S00382-009-0727-0, 2010. Gagliano, M., McCormick, M. I., Moore, J. A., and Depczynski, M.: The basics of acidification: baseline variability of pH on Australian coral reefs, Mar. Biol., 157, 1849–1856, doi:10.1007/S00227-010-1456-Y, 2010. Garcia, H. E., Locarnini, R. A., Boyer, T. P., Antonov, J. I., Baranova, O. K., Zweng, M. M., and Johnson, D. R.: World Ocean Atlas 2009, Volume 3: Dissolved Oxygen Apparent Oxygen Utilization, and Oxygen Saturation, edited by: Levitus, S., NOAA
www.biogeosciences.net/13/1753/2016/
1763
Atlas NESDIS 70, US Government Printing Office, Washington, D.C., 344 pp., 2010a. Garcia, H. E., Locarnini, R. A., Boyer, T. P., Antonov, J. I., Zweng, M. M., Baranova, O. K., and Johnson, D. R.: World Ocean Atlas 2009, Volume 4: Nutrients (phosphate, nitrate, silicate), edited by: Levitus, S., NOAA Atlas NESDIS 71, US Government Printing Office, Washington, D.C., 398 pp., 2010b. Garcia, H. E., Locarnini, R. A., Boyer, T. P., Antonov, J. I., Baranova, O. K., Zweng, M. M., Reagan, J. R., and Johnson, D. R.: World Ocean Atlas 2013, Volume 3: Dissolved Oxygen, Apparent Oxygen Utilization, and Oxygen Saturation, edited by: Levitus, S. and Mishonov, A., NOAA Atlas NESDIS 75, 27 pp., 2014a. Garcia, H. E., Locarnini, R. A., Boyer, T. P., Antonov, J. I., Baranova, O. K., Zweng, M. M., Reagan, J. R., and Johnson, D. R.: World Ocean Atlas 2013, Volume 4: Dissolved Inorganic Nutrients (phosphate, nitrate, silicate), edited by: Levitus, S. and Mishonov, A., NOAA Atlas NESDIS 76, 25 pp., 2014b. Guinotte, J. M., Buddemeier, R. W., and Kleypas, J. A.: Future coral reef habitat marginality: temporal and spatial effects of climate change in the Pacific basin, Coral Reefs, 22, 551–558, doi:10.1007/S00338-003-0331-4, 2003. Hauck, J. and Völker, C.: Rising atmospheric CO2 leads to large impact of biology on Southern Ocean CO2 uptake via changes of the Revelle factor, Geophys. Res. Lett., 42, 1459–1464, doi:10.1002/2015GL063070, 2015. Hieronymus, J. and Walin, G.: Unravelling the land source: an investigation of the processes contributing to the oceanic input of DIC and alkalinity, Tellus B, 65, 19683, doi:10.3402/Tellusb.V65i0.19683, 2013. Hobday, A. J. and Pecl, G. T.: Identification of global marine hotspots: sentinels for change and vanguards for adaptation action, Rev. Fish. Biol. Fisher., 24, 415–425, doi:10.1007/s11160013-9326-6, 2013. Iglesias-Rodriguez, M. D., Halloran, P. R., Rickaby, R. E. M., Hall, I. R., Colmenero-Hidalgo, E., Gittins, J. R., Green, D. R. H., Tyrrell, T., Gibbs, S. J., von Dassow, P., Rehm, E., Armbrust, E. V., and Boessenkool, K. P.: Phytoplankton calcification in a high-CO2 world, Science, 320, 336–340, doi:10.1126/Science.1154122, 2008. Key, R. M., Kozyr, A., Sabine, C. L., Lee, K., Wanninkhof, R., Bullister, J. L., Feely, R. A., Millero, F. J., Mordy, C., and Peng, T. H.: A global ocean carbon climatology: Results from Global Data Analysis Project (GLODAP), Global Biogeochem. Cy., 18, Gb4031, doi:10.1029/2004gb002247, 2004. Kuchinke, M., Tilbrook, B., and Lenton, A.: Seasonal variability of aragonite saturation state in the Western Pacific, Mar. Chem., 161, 1–13, doi:10.1016/J.Marchem.2014.01.001, 2014. Langdon, C.: Effect of elevated pCO2 on photosynthesis and calcification of corals and interactions with seasonal change in temperature/irradiance and nutrient enrichment, J. Geophys. Res., 110, C09S07, doi:10.1029/2004jc002576, 2005. Le Quéré, C., Moriarty, R., Andrew, R. M., Peters, G. P., Ciais, P., Friedlingstein, P., Jones, S. D., Sitch, S., Tans, P., Arneth, A., Boden, T. A., Bopp, L., Bozec, Y., Canadell, J. G., Chini, L. P., Chevallier, F., Cosca, C. E., Harris, I., Hoppema, M., Houghton, R. A., House, J. I., Jain, A. K., Johannessen, T., Kato, E., Keeling, R. F., Kitidis, V., Klein Goldewijk, K., Koven, C., Landa, C. S., Landschützer, P., Lenton, A., Lima, I. D., Marland, G.,
Biogeosciences, 13, 1753–1765, 2016
1764
A. Lenton et al.: Historical reconstruction of ocean acidification
Mathis, J. T., Metzl, N., Nojiri, Y., Olsen, A., Ono, T., Peng, S., Peters, W., Pfeil, B., Poulter, B., Raupach, M. R., Regnier, P., Rödenbeck, C., Saito, S., Salisbury, J. E., Schuster, U., Schwinger, J., Séférian, R., Segschneider, J., Steinhoff, T., Stocker, B. D., Sutton, A. J., Takahashi, T., Tilbrook, B., van der Werf, G. R., Viovy, N., Wang, Y.-P., Wanninkhof, R., Wiltshire, A., and Zeng, N.: Global carbon budget 2014, Earth Syst. Sci. Data, 7, 47–85, doi:10.5194/essd-7-47-2015, 2015. Lee, K., Tong, L. T., Millero, F. J., Sabine, C. L., Dickson, A. G., Goyet, C., Park, G. H., Wanninkhof, R., Feely, R. A., and Key, R. M.: Global relationships of total alkalinity with salinity and temperature in surface waters of the world’s oceans, Geophys. Res. Lett., 33, L19605, doi:10.1029/2006gl027207, 2006. Lenton, A., Metzl, N., Takahashi, T., Kuchinke, M., Matear, R. J., Roy, T., Sutherland, S. C., Sweeney, C., and Tilbrook, B.: The observed evolution of oceanic pCO( 2) and its drivers over the last two decades, Global Biogeochem. Cy., 26, Gb2021, doi:10.1029/2011gb004095, 2012. Lima, F. P. and Wethey, D. S.: Three decades of high-resolution coastal sea surface temperatures reveal more than warming, Nat. Commun., 3, 704, doi:10.1038/Ncomms1713, 2012. Locarnini, R. A., Mishonov, A. V., Antonov, J. I., Boyer, T. P., Garcia, H. E., Baranova, O. K., Zweng, M. M., and Johnson, D. R.: World Ocean Atlas 2009, Volume 1: Temperature, edited by: Levitus, S., NOAA Atlas NESDIS 68, US Government Printing Office, Washington, D.C., 184 pp., 2010. Locarnini, R. A., Mishonov, A. V., Antonov, J. I., Boyer, T. P., Garcia, H. E., Baranova, O. K., Zweng, M. M., Paver, C. R., Reagan, J. R., Johnson, D. R., Hamilton, M., and Seidov, D.: World Ocean Atlas 2013, Volume 1: Temperature, edited by: Levitus, S. and Mishonov, A., NOAA Atlas NESDIS 73, 40 pp., 2013. Lynch, T. P., Morello, E. B., Evans, K., Richardson, A., Rochester, J. W. C., Steinberg, C. R., Roughan, M., Thompson, P., Middleton, J. F., Feng, M., Sherrington, R., Brando, V., Tilbrook, B., Ridgway, K., Allen, S., Doherty, P., Hill, K., and Moltmann, T. C.: IMOS National Reference Stations: a continental wide physical, chemical and biological coastal observing system, PLOS One, 9, e113652, doi:10.1371/journal.pone.0113652, 2014. Matear, R. J. and Lenton, A.: Quantifying the impact of ocean acidification on our future climate, Biogeosciences, 11, 3965–3983, doi:10.5194/bg-11-3965-2014, 2014. McNeil, B. I. and Matear, R. J.: Southern Ocean acidification: A tipping point at 450 ppm atmospheric CO2 , P. Natl. Acad. Sci. USA, 105, 18860–18864, doi:10.1073/pnas.0806318105, 2008. McKinley, G. A., Fay, A. R., Takahashi, T, and Metzl, N.: Convergence of atmospheric and North Atlantic carbon dioxide trends on multidecadal timescales, Nat. Geosci., 4, 606–610, doi:10.1038/ngeo1193, 2011. Mehrbach, C., Culberson, C. H., Hawley, J. E., and Pytkowicz, R. M.: Measurement of the apparent dissociation constants of carbonic acid in seawater at atmospheric pressure, Limnol. Oceanogr., 18, 897–907, doi:10.4319/lo.1973.18.6.0897, 1973. Mucci, A.: The Solubility of Calcite and Aragonite in Seawater at Various Salinities, Temperatures, and One Atmosphere Total Pressure, Am. J. Sci., 283, 780–799, 1983. Munday, P. L., Donelson, J. M., Dixson, D. L., and Endo, G. G. K.: Effects of ocean acidification on the early life history of a tropical marine fish, P. Roy. Soc. B-Biol. Sci., 276, 3275–3283, doi:10.1098/Rspb.2009.0784, 2009.
Biogeosciences, 13, 1753–1765, 2016
Munday, P. L., Dixson, D. L., McCormick, M. I., Meekan, M., Ferrari, M. C. O., and Chivers, D. P.: Replenishment of fish populations is threatened by ocean acidification, P. Natl. Acad. Sci. USA, 107, 12930–12934, doi:10.1073/Pnas.1004519107, 2010. Pelejero, C., Calvo, E., McCulloch, M. T., Marshall, J. F., Gagan, M. K., Lough, J. M., and Opdyke, B. N.: Preindustrial to modern interdecadal variability in coral reef pH, Science, 309, 2204–2207, doi:10.1126/Science.1113692, 2005. Rayner, N. A., Parker, D. E., Horton, E. B., Folland, C. K., Alexander, L. V., Rowell, D. P., Kent, E. C., and Kaplan, A.: Global analyses of sea surface temperature, sea ice, and night marine air temperature since the late nineteenth century, J. Geophys. Res.Atmos., 108, 4407, doi:10.1029/2002jd002670, 2003. Reynolds, R. W., Smith, T. M., Liu, C., Chelton, D. B., Casey, K. S., and Schlax, M. G.: Daily high-resolution-blended analyses for sea surface temperature, J. Climate, 20, 5473–5496, doi:10.1175/2007jcli1824.1, 2007. Ricke, K. L., Orr, J. C., Schneider, K., and Caldeira, K.: Risks to coral reefs from ocean carbonate chemistry changes in recent earth system model projections, Environ. Res. Lett., 8, 034003, doi:10.1088/1748-9326/8/3/034003, 2013. Ridgway, K. R., Dunn, J. R., and Wilkin, J. L.: Ocean interpolation by four-dimensional weighted least squares – application to the waters around Australasia, J. Atmos. Ocean. Technol., 19, 1357– 1375, 2002. Riebesell, U., Fabry, V. J., Hansson, L., and Gattuso, J.-P.: Guide to best practices for ocean acidification research and data reporting, Publications Office of the European Union, Luxembourg, 260 pp., 2010. Sabine, C. L., Feely, R. A., Gruber, N., Key, R. M., Lee, K., Bullister, J. L., Wanninkhof, R., Wong, C. S., Wallace, D. W. R., Tilbrook, B., Millero, F. J., Peng, T. H., Kozyr, A., Ono, T., and Rios, A. F.: The oceanic sink for anthropogenic CO2 , Science, 305, 367–371, doi:10.1126/Science.1097403, 2004. Sasse, T. P., McNeil, B. I., and Abramowitz, G.: A new constraint on global air-sea CO2 fluxes using bottle carbon data, Geophys. Res. Lett., 40, 1594–1599, doi:10.1002/Grl.50342, 2013. Shaw, E. C., McNeil, B. I., and Tilbrook, B.: Impacts of ocean acidification in naturally variable coral reef flat ecosystems, J. Geophys. Res.-Oceans, 117, C03038, doi:10.1029/2011jc007655, 2012. Silverman, J., Lazar, B., Cao, L., Caldeira, K., and Erez, J.: Coral reefs may start dissolving when atmospheric CO2 doubles, Geophys. Res. Lett., 36, L05606, doi:10.1029/2008gl036282, 2009. Sitch, S., Friedlingstein, P., Gruber, N., Jones, S. D., MurrayTortarolo, G., Ahlström, A., Doney, S. C., Graven, H., Heinze, C., Huntingford, C., Levis, S., Levy, P. E., Lomas, M., Poulter, B., Viovy, N., Zaehle, S., Zeng, N., Arneth, A., Bonan, G., Bopp, L., Canadell, J. G., Chevallier, F., Ciais, P., Ellis, R., Gloor, M., Peylin, P., Piao, S. L., Le Quéré, C., Smith, B., Zhu, Z., and Myneni, R.: Recent trends and drivers of regional sources and sinks of carbon dioxide, Biogeosciences, 12, 653– 679, doi:10.5194/bg-12-653-2015, 2015. Stanley, S. M. and Hardie, L. A.: Secular oscillations in the carbonate mineralogy of reef-building and sediment-producing organisms driven by tectonically forced shifts in seawater chemistry, Palaeogeogr. Palaeocl., 144, 3–19, doi:10.1016/S00310182(98)00109-6, 1998.
www.biogeosciences.net/13/1753/2016/
A. Lenton et al.: Historical reconstruction of ocean acidification Takahashi, T., Sutherland, S. C., Wanninkhof, R., Sweeney, C., Feely, R. A., Chipman, D. W., Hales, B., Friederich, G., Chavez, F., Sabine, C., Watson, A., Bakker, D. C. E., Schuster, U., Metzl, N., Yoshikawa-Inoue, H., Ishii, M., Midorikawa, T., Nojiri, Y., Kortzinger, A., Steinhoff, T., Hoppema, M., Olafsson, J., Arnarson, T. S., Tilbrook, B., Johannessen, T., Olsen, A., Bellerby, R., Wong, C. S., Delille, B., Bates, N. R., and de Baar, H. J. W.: Climatological mean and decadal change in surface ocean pCO(2) , and net sea-air CO2 flux over the global oceans, Deep-Sea Res. Pt. II, 56, 554–577, doi:10.1016/J.Dsr2.2008.12.009, 2009. Takahashi, T., Sutherland, S. C., Chipman, D. W., Goddard, J. G., Ho, C., Newberger, T., Sweeney, C., and Munro, D. R.: Climatological distributions of pH, pCO2 , total CO2 , alkalinity, and CaCO3 saturation in the global surface ocean, and temporal changes at selected locations, Mar. Chem., 164, 95–125, doi:10.1016/j.marchem.2014.06.004, 2014.
www.biogeosciences.net/13/1753/2016/
1765
Zeebe, R. E. and Wolf-Gladrow, D.: CO2 in Seawater: Equilibrium, Kinetics, Isotopes, Elsevier Oceanography Series, 65, 346 pp., Amsterdam, 2001. Zweng, M. M., Reagan, J. R., Antonov, J. I., Locarnini, R. A., Mishonov, A. V., Boyer, T. P., Garcia, H. E., Baranova, O. K., Johnson, D. R., Seidov, D., and Biddle, M. M.: World Ocean Atlas 2013, Volume 2: Salinity, edited by: Levitus, S. and Mishonov, A., NOAA Atlas NESDIS 74, 39 pp., 2013.
Biogeosciences, 13, 1753–1765, 2016