0013-7227/03/$15.00/0 Printed in U.S.A.
The Journal of Clinical Endocrinology & Metabolism 88(2):673– 679 Copyright © 2003 by The Endocrine Society doi: 10.1210/jc.2002-021142
Homocysteine Levels and C677T Polymorphism of Methylenetetrahydrofolate Reductase in Women with Polycystic Ovary Syndrome FRANCESCO ORIO, JR., STEFANO PALOMBA, SEBASTIANO DI BIASE, ANNAMARIA COLAO, LIBUSE TAUCHMANOVA, SILVIA SAVASTANO, DONATO LABELLA, TIZIANA RUSSO, FULVIO ZULLO, AND GAETANO LOMBARDI Department of Molecular & Clinical Endocrinology and Oncology (F.O., A.C., L.T., S.S., G.L.), University of Naples “Federico II,” 80131 Naples, Italy; Chair of Obstetrics and Gynecology (S.P., T.R., F.Z.), University of Catanzaro, 88100 Catanzaro, Italy; and MeriGen Molecular Biology Laboratory (S.D.B., D.L.), 80131 Naples, Italy PCOS women in comparison to the control group. Considering the different MTHFR polymorphism, no significant difference was found in serum Hcy levels between subjects with PCOS and controls showing CC (10.4 ⴞ 3.1 vs. 9.7 ⴞ 2.9 mol/liter ⴞ SD) and CT genotypes (10.9 ⴞ 3.8 vs. 11.0 ⴞ 3.2 mol/liter ⴞ SD). In subjects with a TT homozygous state, a significant (P < 0.05) difference was observed between PCOS and control women (11.5 ⴞ 3.9 vs. 22.0 ⴞ 7.8 mol/liter ⴞ SD). In conclusion, our data show that in PCOS women, the serum Hcy levels are normal, and the C677T polymorphism of MTHFR does not influence the Hcy levels like in controls. (J Clin Endocrinol Metab 88: 673– 679, 2003)
The aim of this study was to investigate the homocysteine (Hcy) levels and the C677T polymorphism of 5,10-methylenetetrahydrofolate reductase (MTHFR), a crucial factor of the Hcy metabolism in young women with polycystic ovary syndrome (PCOS). Seventy young women with PCOS and another 70 healthy women with low folate intake were enrolled. Cases and controls were matched for age, body mass index, and allele frequency. Hcy, vitamin B12, and folate levels were measured, and a genetic analysis of 5,10-MTHFR at nucleotide 677 was performed in all subjects. No difference in mean Hcy levels was observed between
P
OLYCYSTIC OVARY SYNDROME (PCOS) is one of the most common endocrine diseases of women of fertile age, affecting up to 10% of women in reproductive age, and is characterized by hyperandrogenism, chronic anovulatory cycles, and oligomenorrhea or amenorrhea (1). At present, PCOS is considered not only a disease that influences fertility but also a plurimetabolic syndrome (2). Recent data have shown an increased prevalence of cardiovascular disease (CVD) in PCOS women (3– 6), and several studies have evaluated whether there is a higher cardiovascular morbidity and mortality in these patients (7, 8). Elevated plasma homocysteine (Hcy) levels are considered to be an independent risk factor for CVD (9 –11). A strong association between plasma Hcy concentrations and CVD has been observed (12–16). The mechanism of the Hcy action on the cardiovascular system, furthermore, is still unknown. Circulating Hcy levels could be influenced by many determinants (12). Genetic factors play an important role in the metabolic pathway of Hcy synthesis. Enzymatic defects caused by genetic mutations induce a significant increase in Hcy concentrations (17). In the general population, the most common cause of abnormal serum Hcy levels seems to be a reduced efficiency of methylenetetrahydrofolate reductase
(MTHFR), an enzyme involved in the folate-dependent remethylation of Hcy to methionine (18). The C677T mutation, i.e. alanine to valine substitution at nucleotide 677, in MTHFR gene causes an impairment of its enzymatic activity (19 –26). When C677T mutation is present in a homozygous state, this polymorphism results in a variant of MTHFR enzyme, referred to as the thermolabile MTHFR (18), and in elevated circulating total Hcy levels (15–16, 27). At present, no data are available in literature regarding the relationship between serum Hcy levels and MTHFR polymorphism in women with PCOS. In this view, the aim of this study was to investigate the serum Hcy levels and the C677T polymorphism of MTHFR in young women with PCOS. Patients and Methods The procedures used were in accordance with the guidelines of the Helsinki Declaration on human experimentation. The study was approved by the Institutional Review Board of the University of Naples. The purpose of the protocol was explained to both the patients and control women, and written consent was obtained from them before beginning the study.
Patients Seventy young women [age, 22.5 ⫾ 4.3 (sd) yr; range, 18 –27 yr] with PCOS were enrolled for the study. PCOS was defined according to clinical (Ferriman-Gallwey score ⬎ 8; and/or oligomenorrhea or amenorrhea), biological (LH/FSH ratio ⬎ 2; hyperandrogenism), and ultrasonographic findings (28, 29). Another 70 healthy young volunteer females, matched for age, body mass index (BMI), and allele frequency, were enrolled and considered
Abbreviations: A, Androstenedione; AUC, area under curve; BMI, body mass index; CBS, cystathione--synthase; CI, confidence interval; CV, coefficient(s) of variation; CVD, cardiovascular disease; DHEAS, dehydroepiandrosterone sulfate; E2, 17-estradiol; Hcy, homocysteine; MTHFR, methylenetetrahydrofolate reductase; OGTT, oral glucose tolerance test; 17-OHP, 17-hydroxyprogesterone; P, progesterone; PCOS, polycystic ovary syndrome; PRL, prolactin; T, testosterone.
673
674
J Clin Endocrinol Metab, February 2003, 88(2):673– 679
as the control group. Their healthy state was determined by medical history, physical and pelvic examination, and complete blood chemistry. Their normal ovulatory state was confirmed by transvaginal ultrasonography and plasma progesterone (P) assay detected during the luteal phase of the cycle. To avoid dietary interference, only women with a low folate intake were enrolled. In the present study, we considered women at low folate intake when the serum folate levels were below 12.5 nmol/liter (30, 31). Exclusion criteria for all subjects included pregnancy, hypothyroidism, current use of vitamins, current or previous (within the last 6 months) use of oral contraceptives, glucocorticoids, antiandrogens, ovulation induction agents, antidiabetic and antiobesity drugs, or other hormonal drugs. None of the patients were affected by any neoplastic, metabolic, and cardiovascular disorder or other concurrent medical illness (i.e. diabetes, renal disease, and malabsorptive disorders). All subjects were nonsmokers and had a normal physical activity, and none drank alcoholic beverages. The cases and the controls were genetically unrelated.
Study protocol At study entry, all subjects underwent venous blood drawing for complete hormonal assays, lipid profile, glucose, insulin, and Hcy levels, and MTHFR genetic study. Glucose and insulin values were detected also after oral glucose tolerance test (OGTT). All blood samples were obtained in the morning between 0800 h and 0900 h after a 3-d, 300-g carbohydrate diet, an overnight fasting, and resting in bed during early follicular phase (d 2–5) of the spontaneous or P-induced menstrual cycle. During the same visit, all subjects underwent transvaginal ultrasonography, anthropometric measurements, including BMI and waist to hip ratio, systolic and diastolic blood pressure, echocardiographic assessment, and echocolor-Doppler with evaluation of intima media thickness. In the present study, only the data regarding the serum Hcy levels and the genetic evaluation of MTHFR will be shown and discussed.
Biochemical assay A butterfly needle was inserted into an antecubital vein, and an iv saline infusion was given at a rate of approximately 50 ml/h. The subjects were kept supine throughout the infusion period and were not allowed to smoke, sleep, or drink alcoholic or caffeinated beverages. Thirty minutes after the needle insertion, basal blood samples were obtained to evaluate complete hormonal assays. On these samples the following hormonal serum levels were measured: LH, FSH, 17-estradiol (E2), P, total testosterone (T), androstenedione (A), dehydroepiandrosterone sulfate (DHEAS), prolactin (PRL), TSH, and SHBG. All blood samples for each woman were assayed in duplicate determinations and immediately centrifuged, and the serum was stored at ⫺80 C until analysis. The mean of two hormonal results was calculated. Plasma PRL, LH, TSH, FSH, E2, P, T, A, and DHEAS were measured by specific RIA, as previously described (32). Serum 17-hydroxyprogesterone (17-OHP) levels were determined using a RIA (DSL 5000, Diagnostic Systems Laboratories, Inc., Webster, TX) with a sensitivity of 0.5 nmol/liter and intra-assay and interassay coefficients of variation (CV) of 8.9 and 9.0%, respectively. SHBG levels were measured using an immunoradiometric assay (Radim S.p.A, Pomezia, Rome, Italy) with a sensitivity of 2.5 nmol/liter and intra-assay and interassay CV of 5.1% and 5.2%, respectively. Glucose and insulin concentrations were measured also 30 min after insertion of the iv catheter to detect the fasting levels (time 0) before OGTT. Successively, each subject received 75-g glucose load orally. Further blood samples (10 ml each) were obtained at 30-min intervals for the following 3 h during the infusion period (times 30, 60, 90, 120, 150, and 180 min), and glucose and insulin concentrations were determined. Plasma glucose levels were determined by the glucose oxidase method on a Beckman Glucose Analyzer (Beckman Coulter, Inc., Fullerton, CA), with a sensitivity of 0.3 mmol/liter and intra-assay and interassay CV of 1.0% and 1.2%, respectively. Serum insulin was measured by a solid-phase chemiluminescent enzyme immunoassay using commercially available kits (Immunolite, Diagnostic Products, Los An-
Orio et al. • Homocysteine, MTHFR Polymorphism, and PCOS
geles, CA) with a sensitivity of 2.0 U/ml and intra-assay and interassay CV of 5.5% and 5.8%, respectively. Glucose tolerance was assessed by World Health Organization criteria (33). In the PCOS and control groups, the glucose and insulin response to OGTT was analyzed by calculating the area under curve (AUC). The AUCs for glucose (AUCglucose) and insulin (AUCinsulin) were determined according to the mathematical method described by Tai (34) for the metabolic curves. The AUCglucose/AUCinsulin ratio was also calculated in each subject (35).
Homocysteine and vitamins assays Serum Hcy levels were measured by HPLC using a C-18 reverse phase 25 ⫻ 0.46-cm column and fluorescence detection (Beckman Gold System, Beckman Coulter, Inc.), and an isocratic buffer consisting of 0.1 m acetate buffer (pH 4.0; containing 20 ml methanol/liter buffer). Detection was accomplished on a Shimadzu RF535 fluorometric detector (Shimadzu Corp., Kyoto, Japan; emission , 385 nm; excitation , 515 nm). Ammonium-7-fluorobenzo-2-oxa-1,3-diazole-4-sulfonate was used as a derivative agent of the Hcy thiol residue. Hcy sensitivity of the assay was greater than 0.25 mol/liter of serum. Quantitation accuracy was granted by the use of an internal standard (acetyl-cysteine), and the inter- and intra-assay CV were 2% and 1%, respectively. Vitamin B12 and folate were analyzed by capillary electrophoresis (P/ACE 5000 system, Beckman Coulter, Inc., Palo Alto, CA). Separations were accomplished by the use of a 75-m (internal diameter) silica-fused capillary with a length to detector of 50 cm. The capillary was filled with a 10 mm Tris-sodium phosphate buffer (pH 7.56). The applied voltage was 20 kV, and detection was 200 nm. The inter- and intra-assay CV for vitamin B12 assay were 7.4% and 6.7%, respectively, and for folate assay, 4.1% and 4.2%, respectively.
DNA analysis The DNA analysis was performed in the MeriGen Molecular Biology Laboratory (Naples, Italy). Blood samples were collected in tubes containing disodium-EDTA as anticoagulant and stored at 4 C until DNA extraction. DNA was extracted by the salt phenol chloroform method from the buff coat cells (36). The extracted DNA was stored at ⫺20 C until analysis. Briefly the primers used (5⬘TGAAGGAGAAGGTGTCTGCGGGA 3⬘ exonic and 5⬘AGGACGGTGCGGTGAGAGTG 3⬘ intronic) for the analysis of the A 3 V change generated, by PCR, a 198-bp DNA fragment. The substitution created a HinfI recognition sequence that digested the 198-bp fragment into 175 and 23-bp fragments. MTHFR genotype was determined by HinfI digestion of the PCR products, separated by 2% agarose gel electrophoresis, and visualized under UV light after ethidium staining, as described by Frosst et al. (18). Genotypes were expressed as CC for homozygous normal, CT for heterozygous, and TT for homozygous mutant.
Statistical analysis Statistical analysis was performed using the SPSS 9.0 (SPSS, Inc., Chicago, IL) package. Continuous data were expressed as mean ⫾ sd. A P value less than 0.05 was considered statistically significant. The characteristics of the patients and the mean plasma hormone concentrations between the two clinical groups were compared by Student’s t test for unpaired data and between and within the different groups of MTHFR genotypes with the ANOVA. Student’s t test for unpaired data was also used to evaluate the differences in mean Hcy, vitamin B12, folate, glucose, and insulin levels in PCOS and control groups. A linear regression analysis was performed to study the relationship between serum Hcy levels and vitamin B12 and folate concentrations. Allelic and genotypic frequencies were determined from observed genotype counts, and the expectations of the Hardy-Weinberg equilibrium were evaluated by 2 analysis. Differences in the genotype distribution between different groups were assessed by Pearson’s 2 test of heterogeneity. ANOVA was used to compare the difference in mean Hcy, vitamin
Orio et al. • Homocysteine, MTHFR Polymorphism, and PCOS
B12, folate, AUCglucose, AUCinsulin, and AUCglucose/AUCinsulin ratio after OGTT between and within the different groups of MTHFR genotypes. The correlation between AUCglucose, AUCinsulin, and AUCglucose/ AUCinsulin ratio and Hcy levels in PCOS and healthy women, according to different MTHFR genotype, was studied using a linear regression analysis.
Results
The demographic and hormonal data of the PCOS and control groups are reported in Table 1. In the PCOS group, LH, 17-OHP, T, A, E2, DHEAS, and SHBG were significantly (P ⬍ 0.05) different in comparison with healthy women. The fasting insulin levels were significantly (P ⬍ 0.05) higher in PCOS than in control women, whereas no difference in fasting glucose concentrations was observed between groups. No significant differences were detected in serum vitamin B12 and folate or in Hcy levels between PCOS and healthy women. A significant (P ⬍ 0.05) inverse correlation was observed between serum Hcy levels and vitamin B12 (r ⫽ ⫺0.42 and r ⫽ ⫺0.45 for PCOS and control groups, respectively) and folate concentrations (r ⫽ ⫺0.39 and r ⫽ ⫺0.41 for PCOS and control groups, respectively). The mutation rate of C677T in MTHFR is shown in Table 2. The allelic distribution of MTHFR genotypes was in HardyWeinberg equilibrium for both groups of women. There was a similar genotype distribution between the PCOS and control groups (Table 2). No difference in demographic data was detected between or within the different groups of MTHFR genotypes (data not shown). In comparison to the control group, the PCOS women (also according to the MTHFR genotypes) mainTABLE 1. Clinical and biochemical data of women with PCOS and controls
Age (yr) BMI (kg/m2) Waist/hip ratio Ferriman-Gallwey score FSH (IU/liter) LH (IU/liter) PRL (ng/ml) E2 (pmol/liter) P (nmol/liter) 17-OHP (nmol/liter) T (nmol/liter) A (nmol/liter) DHEAS (mol/liter) SHBG (nmol/liter) IGF-I (nmol/liter) Vitamin B12 (ng/ml) Folate (nmol/liter) Hcy (mol/liter) Fasting glucose (mmol/ liter) Fasting insulin (U/ml) OGTT AUCglucose AUCinsulin AUCglucose/AUCinsulin ratio
PCOS (n ⫽ 70)
Controls (n ⫽ 70)
22.5 ⫾ 4.3 24.1 ⫾ 3.1 0.88 ⫾ 0.1 12.1 ⫾ 1.1a 9.5 ⫾ 1.2 30.6 ⫾ 3.7a 10.8 ⫾ 0.7 167.9 ⫾ 18.1a 1.1 ⫾ 0.5a 43.9 ⫾ 0.2a 2.8 ⫾ 0.3a 7.14 ⫾ 0.7a 4416 ⫾ 401a 29.1 ⫾ 5.2a 47.6 ⫾ 2.1a 377.4 ⫾ 101.5 8.6 ⫾ 2.4 11.3 ⫾ 3.7 6.9 ⫾ 3.1
21.9 ⫾ 3.2 23.8 ⫾ 3.7 0.85 ⫾ 0.3 5.2 ⫾ 0.3 9.8 ⫾ 1.3 14.6 ⫾ 1.5 11 ⫾ 0.8 149.8 ⫾ 17.3 1.7 ⫾ 0.7 42.7 ⫾ 0.3 1.7 ⫾ 0.2 4.44 ⫾ 0.9 3618 ⫾ 343 50.3 ⫾ 8.4 33.5 ⫾ 8.5 384.5 ⫾ 128.7 8.5 ⫾ 2.3 12.2 ⫾ 4.5 5.6 ⫾ 2.9
21.1 ⫾ 6.7a
7.8 ⫾ 2.1
1254 ⫾ 562 6063 ⫾ 1474a 0.19 ⫾ 0.33a
Data are expressed as mean ⫾ a P ⬍ 0.05 vs. control group.
SD.
1216 ⫾ 458 2587 ⫾ 397 0.49 ⫾ 0.40
J Clin Endocrinol Metab, February 2003, 88(2):673– 679 675
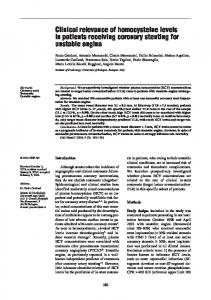
tained the same differences in hormonal data observed in Table 1 (data not shown). In particular, no differences in serum vitamin B12 and folate levels were observed in PCOS and control women according to the genotype groups (Table 3). In Fig. 1, the serum Hcy levels are shown in PCOS and control women according to the different groups of MTHFR polymorphism. In the control group, the mean serum Hcy levels were significantly (P ⬍ 0.05) higher in women with the TT genotype compared with CC and/or CT genotypes (22.0 ⫾ 7.8 vs. 9.7 ⫾ 2.9 and 11.0 ⫾ 3.2 mol/liter, respectively; Fig. 1). On the contrary, no significant difference was detected between the three groups of different polymorphisms in PCOS patients (10.4 ⫾ 3.1, 10.9 ⫾ 3.8, and 11.5 ⫾ 3.9 mol/liter, for CC, CT, and TT genotypes, respectively; Fig. 1). No significant difference was found in serum Hcy levels between subjects with PCOS and controls for CC genotype [10.4 ⫾ 3.1 (sd) vs. 9.7 ⫾ 2.9 mol/liter] and for CT heterozygosity (10.9 ⫾ 3.8 vs. 11.0 ⫾ 3.2 mol/liter; Fig. 1). A significant (P ⬍ 0.05) difference was observed between subjects with PCOS and controls with TT homozygosity (11.5 ⫾ 3.9 vs. 22.0 ⫾ 7.8 mol/liter; Fig. 1). After OGTT, four (5.7%) women with PCOS were diagnosed to have glucose intolerance, whereas only one (1.4%) woman in the control group had glucose intolerance. AUCinsulin and AUCglucose/AUCinsulin ratio were significantly (P ⬍ 0.05) higher in PCOS than in control women, whereas no statistical difference was observed in AUCglucose (Table 1). No difference was observed between and within MTHFR genotypes in fasting glucose levels and in AUCglucose after OGTT (Table 4). The fasting insulin levels were significantly (P ⬍ 0.05) higher in PCOS women in comparison with controls without a difference within and between MTHFR genotypes (Table 4). The AUCinsulin and AUCglucose/AUCinsulin ratio were also significantly (P ⬍ 0.05) higher in PCOS women than in control women in all MTHFR genotypes without difference between MTHFR genotypes (Table 4). A significant (P ⬍ 0.05) relation was detected between Hcy levels and fasting insulin, AUCinsulin, and AUCglucose/ TABLE 2. Frequency of different genotypes in PCOS and control women Genotype
PCOS (n ⫽ 70) Controls (n ⫽ 70)
CC
CT
TT
16 (22.9) 17 (24.3)
41 (58.5) 38 (54.3)
13 (18.6) 15 (21.4)
Data are expressed as number (%). TABLE 3. Serum vitamin B12 and folate levels in PCOS and control women according to MTHFR genotype PCOS Genotype
CC CT TT
Control
Vitamin B12 (ng/ml)
Folate (nmol/liter)
Vitamin B12 (ng/ml)
Folate (nmol/liter)
350.1 ⫾ 98.2 396.3 ⫾ 102.3 378.9 ⫾ 99.6
8.9 ⫾ 2.3 8.4 ⫾ 2.2 8.7 ⫾ 2.4
377.2 ⫾ 128.3 369.7 ⫾ 114.2 400.6 ⫾ 97.2
8.6 ⫾ 2.3 8.3 ⫾ 2.1 8.9 ⫾ 2.2
Data are expressed as mean ⫾
SD.
676
J Clin Endocrinol Metab, February 2003, 88(2):673– 679
FIG. 1. Serum Hcy levels according to the genotype distribution in PCOS and controls. Values are expressed as mean ⫾ SD. *, P ⬍ 0.05 vs. all genotypes in PCOS women and vs. CC and CT genotypes in control women.
AUCinsulin ratio in PCOS women (r ⫽ 0.41, r ⫽ 0.52, and r ⫽ 0.58 for fasting insulin, AUCinsulin, and AUCglucose/ AUCinsulin ratio, respectively) and healthy women (r ⫽ 0.42, r ⫽ 0.49, and r ⫽ 0.56, for fasting insulin, AUCinsulin, and AUCglucose/AUCinsulin ratio, respectively). In PCOS and control women, these significant relations were maintained in CC and CT, but not in TT genotypes (Table 5). Discussion
Only within the past 5 yr has Hcy taken its place among other major risk factors such as cholesterol, smoking, and obesity; it is now widely accepted as a major independent risk factor for cardiovascular, cerebrovascular, and peripheral vascular disease (21). Several in vitro (37– 45) and in vivo (46 –50) studies have shown that Hcy acts on the cardiovascular system with a direct toxicity on the endothelium. In particular, Hcy increases DNA synthesis in vascular smooth muscle cells inducing its proliferation (48, 40 – 45), whereas it blocks the regeneration of endothelial cells (47) and causes oxidation of low lipoprotein (49 –51). One of the most frequent causes of increased plasma levels of Hcy is a decreased activity of 5,10-MTHFR (18, 23, 26). In the original reports by Kang et al. (23, 52), it had been suggested that there is a variant of the MTHFR enzyme characterized by a thermolability and a specific enzyme activity of approximately 50% of the normal activity. This variant varies significantly in populations from different geographic areas (23, 53, 54) and has been observed in about 17% of subjects with CVD (55) and 28% of patients with hyperhomocysteinemia and premature vascular disease (56). In our study, we observed a high prevalence of homozygosity for the C677T mutation as detected by other studies in the Italian population (57–59). Furthermore, it is still not clear whether homozygosity for MTHFR C677T mutation is a real risk factor for CVD. This contention has been supported by some studies (23, 52, 55–57, 60 – 64), but rejected by others (24, 65–72). Currently, it is unknown whether Hcy may play a role in the increased cardiovascular risk demonstrated in PCOS women. Moreover, no study has focalized the attention on
Orio et al. • Homocysteine, MTHFR Polymorphism, and PCOS
the relationship between MTHFR polymorphism and Hcy levels in women with PCOS. Our data show that the Hcy levels in PCOS women are in the normal range and similar to those obtained in our control group. These findings are in contrast to the current literature (73, 74). In fact, in these last studies (73, 74), elevated serum Hcy concentrations were found in PCOS women, suggesting that an alteration in Hcy metabolism may play a role in the increased cardiovascular risk associated with PCOS. Furthermore, there are many methodological differences. First of all, in our study the assessment of Hcy concentrations was performed using a more sensitive and specific assay, that is HPLC. In addition, our sample of women was larger and younger in comparison to the subjects studied by other authors (73, 74). Finally, our study population was based on a sample of subjects in Hardy-Weinberg equilibrium for the allelic distribution of MTHFR genotypes, whereas nongenetic evaluation was performed by Yarali et al. (73) and Loverro et al. (74). Our findings are similar to those obtained by Sills et al. (27). In this last study (27), serum androgens and fasting insulin levels, but not Hcy concentrations, were significantly higher in women with polycystic ovaries. Furthermore, also in this last study (27), no DNA analysis was performed. Our study confirms that the homozygosity of C677T MTHFR mutation is associated with high levels of Hcy in healthy women (23, 75). Furthermore, a lack of significant association between the MTHFR mutation and high levels of Hcy in PCOS women was observed, not precluding the possibility that the C677T mutation could be a marker for vascular disease in PCOS women because this was not the aim of our study. No association was found between genotype and fasting Hcy in subjects with plasma folate levels at or above the median (15 nmol/liter; Ref. 76). Plasma Hcy concentrations are not different between genotypes when folate concentrations are above the median, whereas elevated Hcy concentrations have been observed in subjects with TT genotype when folate levels are below the median or the lowest quartile (68). Many studies have shown that plasma Hcy concentration is inversely related to blood levels of vitamin B12 and folate (77). The highest Hcy concentrations observed in TT women are due to a low dietary intake of vitamins and to a major susceptibility to this inadequate alimentary support (31, 78). On the contrary, when folate consumption is high, the TT genotype has little effect on Hcy levels (18). On the basis of these considerations, to obtain a homogeneous group of subjects and to eliminate the confounding factors due to dietary factors, we enrolled only PCOS and healthy women with a low intake of folate (24). Because of the limitations and complexity of various approaches to evaluate food intake and the nutrients (79), we did not use any semiquantitative questionnaire or diet-quality scores, but only a measurement of serum folate. The cut-off established in the present study was very close, and it was lower in comparison to the one used by Somekawa et al. (⬍13.6 nmol/ liter; Ref. 80). Thus, the differences in Hcy value were due probably only to genetic (i.e. C677T MTHFR mutation) or metabolic (i.e. PCOS) factors.
Orio et al. • Homocysteine, MTHFR Polymorphism, and PCOS
J Clin Endocrinol Metab, February 2003, 88(2):673– 679 677
TABLE 4. Glucose and insulin levels at baseline and after OGTT in PCOS and control women according to MTHFR genotypes PCOS CC
Fasting Glucose (mmol/liter) Insulin (U/ml) OGTT AUCglucose AUCinsulin AUCglucose/AUCinsulin ratio Data are expressed as mean ⫾ a P ⬍ 0.05 vs. control group.
Controls
CT
TT
a
TT
6.9 ⫾ 3.0 21.3 ⫾ 6.7a
6.8 ⫾ 2.9 20.4 ⫾ 6.8a
5.6 ⫾ 3.1 7.8 ⫾ 2.1
5.6 ⫾ 3.0 7.9 ⫾ 2.2
5.5 ⫾ 2.8 7.7 ⫾ 2.0
1266 ⫾ 516 7785 ⫾ 1476a 0.20 ⫾ 0.35a
1242 ⫾ 569 7696 ⫾ 1443a 0.18 ⫾ 0.33a
1281 ⫾ 572 7419 ⫾ 1452a 0.19 ⫾ 0.33a
1239 ⫾ 479 2566 ⫾ 388 0.52 ⫾ 0.41
1218 ⫾ 466 2608 ⫾ 414 0.48 ⫾ 0.39
1187 ⫾ 450 2557 ⫾ 371 0.47 ⫾ 0.38
SD.
PCOS (r) CC
CT
6.9 ⫾ 3.2 21.5 ⫾ 6.9a
TABLE 5. Linear relation between Hcy levels and fasting glucose and insulin levels, AUCglucose, AUCinsulin, and AUCglucose/AUCinsulin ratio after OGTT in PCOS and control women according to MTHFR genotypes
Fasting Glucose (mmol/liter) Insulin (U/ml) OGTT AUCglucose AUCinsulin AUCglucose/AUCinsulin ratio
CC
CT
Controls (r) TT
CC
CT
TT
0.28 0.25 0.26 0.24 0.20 0.23 0.42a 0.45a 0.10 0.41a 0.44a 0.18 0.32 0.27 0.27 0.28 0.25 0.26 0.61a 0.58a 0.19 0.46a 0.53a 0.23 0.64a 0.61a 0.21 0.60a 0.62a 0.25
P ⬍ 0.05.
The exact significance of the absence of an association between MTHFR C677T mutation and serum Hcy levels in women with PCOS is unknown. It is possible to hypothesize that in PCOS women, the hormonal pattern (i.e. relative hyperestrogenism) may amplify the responsiveness of thermolabile MTHFR to plasma folate levels, inducing an absence of relationship between TT genotype and high Hcy levels in subjects with low folate intake. To explain the relationship between MTHFR C677T mutation and Hcy level in PCOS women, our research group is performing an evaluation of the effect of folate repletion or of a methionine load on Hcy concentrations in this subset of women. In fact, the use of methionine challenge reveals an additional 27% of patients with hyperhomocysteinemia and would have led to classification of more than 40% fewer subjects as being hyperhomocysteinemic (77, 81). Indeed, fasting and post-load elevations in Hcy had independent effects on the cardiovascular risk and had a multiplicative effect when present together. The relative risk for a subject with an elevated fasting Hcy was only 1.6 [95% confidence interval (CI), 1.0 –2.2] and that for an elevated post-load was only 1.5 (95% CI, 1.0 –2.2), whereas for subjects with both elevated fasting and post-load levels, the relative risk was 2.5 (95% CI, 1.7–3.5; Ref. 77). Plasma levels of insulin seem to influence Hcy metabolism through effects on glomerular filtration or by influencing activity of pivotal enzymes in Hcy metabolism, as MTHFR and cystathione--synthase (CBS). In animal model, Fonseca et al. (82, 83) have shown that fasting plasma insulin correlated significantly and positively with plasma Hcy and MTHFR activity and negatively with CBS activity, supporting the hypothesis that insulin may regulate Hcy metabolism through regulation of the two hepatic key enzymes. The activity of the CBS and MTHFR was also affected when
insulin and glucose were added to hepatocytes in vitro (84). More recently, it has been demonstrated that insulin has a direct role in the expression of CBS in the liver (85). In normal weight, overweight, and obese premenopausal women, the Hcy levels are independently associated with insulin resistance (86), and this association seems to be stronger in hyperinsulinemic obese subjects (87). In a large observational study, Meigs et al. (88) confirmed that the fasting plasma Hcy levels are directly associated with insulin resistance. Furthermore, the data regarding the relationship between insulin, insulin resistance, and Hcy levels are still contrasting (89 –92). Metformin administration in women with PCOS can lead to the increase in Hcy levels (93). Gursu et al. (94) have shown that Hcy concentrations are decreased in experimentally induced insulin-dependent diabetes mellitus, and insulin administration normalizes Hcy levels in a dose-dependent manner. In the present study, to evaluate the insulin resistance as a possible mechanism to explain the different Hcy concentrations in TT subjects with and without PCOS, AUCglucose, AUCinsulin, and AUCglucose/AUCinsulin ratio were measured in each genotype group. Our data on the total study population with and without PCOS confirm that Hcy levels are directly related to insulin level after OGTT. AUCglucose, AUCinsulin, and AUCglucose/AUCinsulin ratio were significantly higher in the PCOS group than in the control group without differences within and between MTHFR genotypes. Moreover, the linear relation analysis between Hcy levels and AUCglucose, AUCinsulin, and AUCglucose/AUCinsulin ratio showed a statistical significance only in CC and CT genotypes. In fact, in PCOS and control women, this significance was lost considering the TT genotype. In this view, our data suggest that the higher insulin resistance observed in PCOS women did not influence negatively the MTHFR activity. In addition, the relation between insulin resistance and Hcy levels in the different MTHFR genotypes could explain the difference in the results obtained in the different studies on this issue (86 –94). Unfortunately, this remains unclear because in our study, subjects with TT genotype have Hcy levels unrelated to insulin resistance. In conclusion, in the present study, we have demonstrated that the mean serum Hcy levels are not increased in women with PCOS and that the thermolabile MTHFR enzyme influences the serum Hcy concentrations only in healthy women, whereas it is not related to Hcy levels in PCOS. The
678
J Clin Endocrinol Metab, February 2003, 88(2):673– 679
insulin resistance seems to play a role in Hcy metabolism only in women without thermolabile MTHFR enzyme. Acknowledgments We thank Dr. Benito Chinea (Ibis Informatica & Idee, Milan, Italy) for assistance in statistical support. Received July 22, 2002. Accepted October 17, 2002. Address all correspondence and requests for reprints to: Dr. Francesco Orio, Via Giovanni Santoro no.14, 84123 Salerno, Italy. E-mail:
[email protected].
References 1. Franks S 1995 Polycystic ovary syndrome. N Engl J Med 333:853– 861 2. Scarpitta AM, Sinagra D 2000 Polycystic ovary syndrome: an endocrine and metabolic disease. Gynecol Endocrinol 14:392–395 3. Tiras MB, Yalcin R, Noyan V, Maral I, Yildirim M, Dortlemez O, Daya S 1999 Alterations in cardiac flow parameters in patients with polycystic ovarian syndrome. Hum Reprod 14:1949 –1952 4. Talbott E, Guzick D, Clerici A, Berga S, Detre K, Weimer K, Kuller L 1995 Coronary heart disease risk factors in women with polycystic ovary syndrome. Arterioscler Thromb Vasc Biol 15:821– 826 5. Conway GS, Agrawal R, Betteridge DJ, Jacobs HS 1992 Risk factors for coronary heart disease in lean and obese women with the polycystic ovary syndrome. Clin Endocrinol (Oxf) 37:119 –125 6. Talbott EO, Guzick DS, Sutton-Tyrrell K, McHugh-Pemu KP, Zborowski JV, Remsberg KE, Kuller LH 2000 Evidence for association between polycystic ovary syndrome and premature carotid atherosclerosis in middle-aged women. Arterioscler Thromb Vasc Biol 20:2414 –2421 7. Wild S, Pierpoint T, McKeigue P, Jacobs H 2000 Cardiovascular disease in women with polycystic ovary syndrome at long-term follow-up: a retrospective cohort study. Clin Endocrinol (Oxf) 52:595– 600 8. Pierpoint T, McKeigue PM, Isaacs AJ, Wild SH, Jacobs HS 1998 Mortality of women with polycystic ovary syndrome at long term follow-up. J Clin Epidemiol 51:581–586 9. Clarke R, Daly L, Robinson K, Naughten E, Cahalane S, Fowler B, Graham I 1991 Hyperhomocysteinemia: an independent risk factor for vascular disease. N Engl J Med 324:1149 –1155 10. Malinow MR 1996 Plasma homocyst(e)ine: a risk factor for arterial occlusive disease. J Nutr 126:1238 –1243 11. Welch GN, Loscalzo J 1998 Homocysteine and atherothrombosis. N Engl J Med 338:1042–1050 12. Refsum H, Ueland PM, Nygard O, Vollset SE 1998 Homocysteine and cardiovascular disease. Annu Rev Med 49:31– 62 13. Alfthan G, Aro A, Gey KF 1997 Plasma homocysteine and cardiovascular disease mortality. Lancet 349:397 14. Kang SS, Wong PWK, Cook HY, Norusis M, Messer JV 1986 Protein bound homocysteine. A possible risk factor for coronary artery disease. J Clin Invest 77:1482–1486 15. Tawakol A, Omland T, Gerhard M, Wu JT, Creager MA 1997 Hyperhomocysteinemia is associated with impaired endothelium-dependent vasodilatation in humans. Circulation 9:1119 –1121 16. Herrmann W 2001 The importance of hyperhomocysteinemia as a risk factor for diseases: an overview. Clin Chem Lab Med 39:666 – 674 17. Jacobsen DW 1998 Homocysteine and vitamins in cardiovascular disease. Clin Chem 44:1833–1843 18. Frosst P, Blom HJ, Milos R Goyette P, Sheppard CA, Matthews RG, Boers GJH, den Heijer M, Kluijtmans LAJ, van den Heuvel LP, Rozen R 1995 A candidate genetic risk factor for vascular disease: a common mutation in methylenetetrahydrofolate reductase. Nat Genet 10:111–113 19. McQuillan BM, Beilby JP, Nidorf M, Thompson PL, Hung J 1999 Hyperhomocysteinemia but not the C677T mutation of methylenetetrahydrofolate reductase is an independent risk determinant of carotid wall thickening. The Perth Carotid Ultrasound Disease Assessment Study (CUDAS). Circulation 99:2383–2388 20. Yamada K, Chen Z, Rozen R, Matthews RG 2001 Effects of common polymorphisms on the properties of recombinant human methylenetetrahydrofolate reductase. Proc Natl Acad Sci USA 98:14853–14858 21. Cortese C, Motti C 2001 MTHFR gene polymorphism, homocysteine and cardiovascular disease. Public Health Nutr 4:493– 497 22. Gudnason V, Stansbie D, Scott J, Bowron A, Nicaud V, Humphries S 1998 C677T (thermolabile alanine/valine) polymorphism in methylenetetrahydrofolate reductase (MTHFR): its frequency and impact on plasma homocysteine concentration in different European populations. EARS Group. Atherosclerosis 136:347–354 23. Kang SS, Zhou J, Wong PWK, Kowalisyn J, Strokosch G 1988 Intermediate homocysteinemia: a thermolabile variant of methylenetetrahydrofolate reductase. Am J Hum Genet 43:414 – 421
Orio et al. • Homocysteine, MTHFR Polymorphism, and PCOS
24. Verhoef P, Kok FJ, Kluijtmans LAJ, Blom HJ, Refsum H, Ueland PM, Kruyssen DACM 1997 The 677C3 T mutation in the methylenetetrahydrofolate reductase gene: associations with plasma total homocysteine levels and risk of coronary atherosclerotic disease. Atherosclerosis 132:105–113 25. Abbate R, Sardi I, Pepe G, Marcucci R, Brunelli T, Prisco D, Fatini C, Capanni M, Simonetti I, Gensini GF 1998 The high prevalence of thermolabile 5–10 methylenetetrahydrofolate reductase (MTHFR) in Italians is not associated to an increased risk for coronary artery disease (CAD). Thromb Haemost 79: 727–730 26. Rozen R 1997 Genetic predisposition to hyperhomocysteinemia: deficiency of methylenetetrahydrofolate reductase (MTHFR). Thromb Haemost 78:523–526 27. Sills ES, Genton MG, Perloe M, Schattman GL, Bralley JA, Tucker MJ 2001 Plasma homocysteine, fasting insulin, and androgen patterns among women with polycystic ovaries and infertility. J Obstet Gynaecol Res 27:163–168 28. Ferriman D, Gallwey JD 1961 Clinical assessment of body hair growth in women. J Clin Endocrinol Metab 21:1440 –1447 29. Fulghesu AM, Ciampelli M, Belosi C, Apa R, Pavone V, Lanzone A 2001 A new ultrasound criterion for the diagnosis of polycystic ovary syndrome: the ovarian stroma/total area ratio. Fertil Steril 76:326 –331 30. Food Nutrition Board, National Research Council 1977 Folic acid: biochemistry and physiology in relation to human nutrition requirement. Washington, DC: National Academy of Sciences 31. Jacques PF, Kalmbach R, Bagley PJ, Russo GT, Rogers G, Wilson PW, Rosenberg IH, Selhub J 2002 The relationship between riboflavin and plasma total homocysteine in the Framingham Offspring cohort is influenced by folate status and the C677T transition in the methylenetetrahydrofolate reductase gene. J Nutr 132:283–288 32. Orio Jr F, Palomba S, Colao A, Tenuta M, Dentico C, Peretta M, Lombardi G, Nappi C, Orio F 2001 Growth hormone secretion after baclofen administration in different phases of the menstrual cycle in healthy women. Horm Res 55:131–136 33. Modan M, Harris MI, Halkin H 1989 Evaluation of WHO and NDDG criteria for impaired glucose tolerance. Results from two national samples. Diabetes 38:1630 –1635 34. Tai MM 1994 A mathematic model for the determination of total area under glucose tolerance and other metabolic curves. Diabetes Care 17:152–154 35. Legro RS, Fineggod D, Dunaif A 1998 A fasting glucose to insulin ratio is a useful measure of insulin sensitivity in women with polycystic ovary syndrome. J Clin Endocrinol Metab 83:2694 –2698 36. Miller SA, Dykes DD, Polesky HF 1988 A simple salting-out procedure for extracting DNA from human nucleated cells. Nucleic Acids Res 16:1215 37. Dudman NPB, Hicks C, Wang J, Wilcken DEL 1991 Human arterial endothelial cell detachment in vitro. Atherosclerosis 91:77– 83 38. Wall RT, Harlan JM, Harker LA, Striker GE 1980 Homocysteine-induced endothelial cell injury in vitro. Thromb Res 18:113–121 39. Blann AD 1994 Endothelial cell damage and homocysteine. Atherosclerosis 94:89 –91 40. Refsum H, Ueland P 1998 Recent data are not in conflict with homocysteine as a cardiovascular risk factor. Curr Opin Lipidol 9:533–539 41. Mancini FP, Di Minno G 1996 Hyperhomocysteinemia and thrombosis: the search for a link. Nutr Metab Cardiovasc Dis 6:168 –177 42. Lentz SR, Sobey CG, Piegors DJ, Bhopatkar MY, Faraci FM, Malinow MR, Heistad DD 1996 Vascular dysfunction in monkeys with diet-induced hyperhomocysteinemia. J Clin Invest 98:24 –29 43. Dennis VW, Nurko S, Robinson K 1997 Hyperhomocysteinemia: detection, risk assessment and treatment. Curr Opin Nephrol Hypertens 6:483– 488 44. Feener EP, King GL 1997 Vascular dysfunction in diabetes mellitus. Lancet 350(Suppl):9 –13 45. Lentz SR 1998 Mechanism of thrombosis in hyperhomocysteinemia. Curr Opin Hematol 5:343–349 46. Harker LA, Slichter SJ, Scott CR, Ross R 1974 Homocystinemia. N Engl J Med 291:537–543 47. Harker LA, Ross R, Slichter SJ, Scott CR 1976 Homocystine-induced arteriosclerosis. J Clin Invest 58:731–741 48. Tsai JC, Perrella MA, Yoshizumi M, Hsieh CM, Haber E, Schlegel R, Lee ME 1994 Promotion of vascular smooth muscle cell growth by homocysteine: a link to atherosclerosis. Proc Natl Acad Sci USA 91:6369 – 6373 49. Heinecke JW, Rosen H, Chait A 1984 Iron and copper promote modification of low density lipoprotein by human arterial smooth muscle cells in culture. J Clin Invest 74:1890 –1894 50. Heinecke JW, Rosen H, Suzuki LA, Chait A 1987 The role of sulfur-containing amino acids in superoxide production and modification of low density lipoproteins by arterial smooth muscle cells. J Biol Chem 262:98 –103 51. Parthasarathy S 1987 Oxidation of low-density lipoprotein by thiol compounds leads to its recognition by the acetyl LDL receptor. Biochim Biophys Acta 917:337–340 52. Kang SS, Wong PWK, Zhou J, Sora J, Lessick M, Ruggie N, Grcevich G 1988 Thermolabile methylenetetrahydrofolate reductase in patients with coronary artery disease. Metabolism 37:611– 613 53. Kauwell GPA, Wilsky CE, Cerda JJ, Herrlinger-Garcia K, Hutson AD, Theriaque DW, Boddie A, Rampersaud GC, Bailey LB 2000 Methylenetetrahydrofolate reductase mutation (677C3 T) negatively influences plasma homo-
Orio et al. • Homocysteine, MTHFR Polymorphism, and PCOS
54. 55. 56. 57.
58.
59. 60. 61.
62.
63. 64.
65. 66. 67. 68. 69.
70.
71.
72. 73.
74.
cysteine response to marginal folate intake in elderly women. Metabolism 49:1440 –1443 Motulsky A 1996 Nutritional ecogenetics: homocysteine-related arteriosclerotic vascular disease, neural tube defects, and folic acid. Am J Hum Genet 58:17–20 Kang SS, Wong PWK, Susmano A, Sora J, Norusis M, Ruggie N 1991 Thermolabile methylenetetrahydrofolate reductase: an inherited risk factor for coronary artery disease. Am J Hum Genet 48:536 –545 Engbersen AMT, Franken DG, Boers GHJ, Stevens EMB, Trijbels FJM, Blom HJ 1995 Thermolabile 5,10-methylenetetrahydrofolate reductase as a cause of mild hyperhomocysteinemia. Am J Hum Genet 56:142–150 De Franchis R, Mancini FP, D’Angelo A, Sebastio G, Fermo I, de Stefano V, Margaglione M, Mazzola G, di Minno G, Andria G 1996 Elevated total plasma homocysteine and 677C3 T mutation of the 5,10-methylenetetrahydrofolate reductase gene in thrombotic vascular disease. Am J Hum Genet 59:262–264 Motti C, Gnasso A, Bernardini S, Massoud R, Pastore A, Rampa P, Federici G, Cortese C 1998 Common mutation in methylenetetrahydrofolate reductase. Correlation with homocysteine and other risk factors for vascular disease. Atherosclerosis 139:377–383 Passaro A, Vanini A, Calzoni F, Alberti L, Zamboni PF, Fellin R, Solini A 2001 Plasma homocysteine, methylenetetrahydrofolate reductase mutation and carotid damage in elderly healthy women. Atherosclerosis 157:175–180 Kang SS, Passen EL, Ruggie N, Wong PW, Sora H 1993 Thermolabile defect of methylenetetrahydrofolate reductase in coronary artery disease. Circulation 88:1463–1469 Kluijtmans LAJ, van den Heuvel LP, Boers GH, Frosst P, Stevens EM, Van Oost BA, den Heijer M, Trijbels FJ, Rozen R, Blom HJ 1996 Molecular genetic analysis in mild hyperhomocysteinemia: a common mutation in the methylenetetrahydrofolate reductase gene is a genetic risk factor for cardiovascular disease. Am J Hum Genet 58:35– 41 Gallagher PM, Meleady R, Shields TC, Tan KS, McMaster D, Rozen R, Evans A, Graham IM, Whitehead AS 1996 Homocysteine and risk of premature coronary heart disease. Evidence for a common gene mutation. Circulation 94:2154 –2158 Izumi M, Iwai N, Ohmichi N, Nakamura Y, Shimoike H, Kinoshita M 1996 Molecular variant of 5, 10-methylenetetrahydrofolate reductase is a risk factor of ischemic disease in the Japanese population. Atherosclerosis 121:293–294 Kluijtmans LAJ, Kastelein J, Lindenmans J, Boers GH, Heil SG, Bruschke AV, Jukema JV, van den Heuvel LP, Trijbels FJ, Boerma GJ, Verheugt FW, Willems F, Blom HJ 1997 Thermolabile methylene tetrahydrofolate reductase in coronary artery disease. Circulation 96:2573–2577 Brugada R, Marion AJ 1997 A common mutation in methylenetetrahydrofolate reductase gene is not a major risk of coronary artery disease or myocardial infarction Atherosclerosis 125:107–112 Wilcken DEL, Wang XL, Sim AS, McCredie RM 1996 Distribution in healthy and coronary populations of the methylenetetrahydrofolate reductase (MTHFR) C677T mutation. Arterioscler Thromb Vasc Biol 16:878 – 882 Adams M, Smith PD, Martin D, Thompson JR, Lodwick D, Samani NJ 1996 Genetic analysis of thermolabile methylenetetrahydrofolate reductase as a risk factor for myocardial infarction. QJM 89:437– 444 Brattstrom L, Wilcken DEL, Ohrvik J 1998 Common methylenetetrahydrofolate reductase gene mutation leads to hyperhomocysteinemia but not to vascular disease: the result of a meta-analysis. Circulation 98:2520 –2526 Verhoef P, Stampfer MJ, Buring JE, Gaziano JM, Allen RH, Stabler SP, Reynolds RD, Kork FJ, Hennekens CH, Willett WC 1996 Homocysteine metabolism and risk of myocardial infarction: relation with vitamins B-6, B-12, and folate. Am J Epidemiol 143:845– 859 Ma J, Stampfer MJ, Giovannucci E, Artigas C, Hunter DJ, Fuchs C, Willett WC, Selhub J, Hennekens CH, Rozen R 1997 Methylenetetrahydrofolate reductase polymorphism, dietary interactions, and risk of colorectal cancer. Cancer Res 57:1098 –1102 Schwartz SM, Siscovick DS, Malinow MR, Rosendaal FR, Beverly RK, Hess DL, Psaty BM, Longstreth Jr WT, Koepsell TD, Raghunathan TE, Reitsma PH 1997 Myocardial infarction in young women in relation to plasma total homocysteine, folate, and a common variant in the methylenetetrahydrofolate reductase gene. Circulation 96:412– 417 van Bockxmeer FM, Mamotte C, Vasikaran SD, Taylor RR 1997 Methylenetetrahydrofolate reductase gene and coronary artery disease. Circulation 95:21–23 Yarali H, Yildirir A, Aybar F, Kabakci G, Bukulmez O, Akgul E, Oto A 2001 Diastolic dysfunction and increased serum homocysteine concentrations may contribute to increased cardiovascular risk in patients with polycystic ovary syndrome. Fertil Steril 76:511–516 Loverro G, Lorusso F, Mei L, Depalo R, Cormio G, Selvaggi L 2002 The
J Clin Endocrinol Metab, February 2003, 88(2):673– 679 679
75.
76.
77.
78.
79. 80.
81.
82. 83.
84. 85. 86.
87. 88.
89. 90. 91.
92. 93. 94.
plasma homocysteine levels are increased in polycystic ovary syndrome. Gynecol Obstet Invest 53:157–162 van der Put NM, Steegers-Theunissen RPM, Frosst P, Trijbels FJM, Eskes TKAB, van den Heuvel LP, Mariman ECM, den Heyer M, Rozen R, Blom HJ 1995 Mutated methylenetetrahydrofolate reductase as a risk factor for spina bifida. Lancet 346:1070 –1071 Jacques PF, Bostom AG, Williams RR, Ellison RC, Eckfeldt JH, Rosenberg IH, Selhub J, Rozen R 1996 Relation between folate status, a common mutation in methylenetetrahydrofolate reductase, and plasma homocysteine concentrations. Circulation 93:7–9 Graham IM, Daly LE, Refsum HM, Robinson K, Brattstrom LE, Ueland PM, Palma-Reis RJ, Boers GHJ, Sheahan RG, Israelsson B, Uiterwaal CS, Meleady R, McMaster D, Verhoef P, Witteman J, Rubba P, Bellet H, Wautrecht JC, de Valk HW, Sales Luis AC, Parrot-Roulaud FM, Tan KS, Higgins I, Garcon D, Medrano MJ, Candito M, Evans AE, Andria G 1997 Plasma homocysteine as a risk factor for vascular disease. JAMA 227:1775–1781 Ashfield-Watt PA, Pullin CH, Whiting JM, Clark ZE, Moat SJ, Newcombe RG, Burr ML, Lewis MJ, Powers HJ, McDowell IF 2002 Methylenetetrahydrofolate reductase 677C3 T genotype modulated homocysteine responses to a folate-rich diet or a low-dose folic acid supplement: a randomized controlled trial. Am J Clin Nutr 76:180 –186 Jacques PF, Tucker KL 2001 Are dietary patterns useful for understanding the role of diet in chronic disease? Am J Clin Nutr 73:1–2 Somekawa Y, Kobayashi K, Tomura S, Aso T, Hamaguchi H 2002 Effects of hormone replacement therapy and methylenetetrahydrofolate reductase polymorphism on plasma folate and homocysteine levels in postmenopausal Japanese women. Fertil Steril 77:481– 486 Bostom AG, Jacques PF, Nadeau MR, Williams RR, Ellison RC, Selhub J 1995 Post-methionine load hyperhomocysteinemia in persons with normal fasting total plasma homocysteine: initial results from the NHLBI family heart study. Atherosclerosis 116:147–151 Fonseca V, Dicker-Brown A, Ranganathan S, Song W, Barnard RJ, Fink L, Kern PA 2000 Effects of a high-fat-sucrose diet on enzymes in homocysteine metabolism in the rat. Metabolism 49:736 –741 Fonseca V, Keebler M, Dicker-Brown A, Desouza C, Poirier LA, Murthy SN, McNamara DB 2002 The effect of troglitazone on plasma homocysteine, hepatic and red blood cell S-adenosyl methionine, and S-adenosyl homocysteine and enzymes in homocysteine metabolism in Zucker rats. Metabolism 51: 783–786 Dicker-Brown A, Fonseca VA, Fink LM, Kern PA 2001 The effect of glucose and insulin on the activity of methylene tetrahydrofolate reductase and cystathionine--synthase: studies in hepatocytes. Atherosclerosis 158:297–301 Ratnam S, Maclean KN, Jacobs RL, Brosnan ME, Kraus JP, Brosnan JT 2002 Hormonal regulation of cystathionine -synthase expression in liver. J Biol Chem 26:278 –282 De Pergola G, Pannacciulli N, Zamboni M, Minenna A, Brocco G, Sciaraffia M, Bosello, Giorgino R 2001 Homocysteine plasma levels are independently associated with insulin resistance in normal weight, overweight and obese pre-menopausal women. Diabetes Nutr Metab 14:253–258 Sanchez-Margalet V, Valle M, Ruz FJ, Gascon F, Mateo J, Goberna R 2002 Elevated plasma total homocysteine levels in hyperinsulinemic obese subjects. J Nutr Biochem 13:75–79 Meigs JB, Jacques PF, Selhub J, Singer DE, Nathan DM, Rifai N, D’Agostino Sr RB, Wilson PW; Framingham Offspring Study 2001 Fasting plasma homocysteine levels in the insulin resistance syndrome: the Framingham offspring study. Diabetes Care 24:1403–1410 Abbasi F, Facchini F, Humphreys MH, Reaven GM 1999 Plasma homocysteine concentrations in healthy volunteers are not related to differences in insulin-mediated glucose disposal. Atherosclerosis 146:175–178 Bar-On H, Kidron M, Friedlander Y, Ben-Yehuda A, Selhub J, Rosenberg IH, Friedman G 2000 Plasma total homocysteine levels in subjects with hyperinsulinemia. J Intern Med 247:287–294 Godsland IF, Rosankiewicz JR, Proudler AJ, Johnston DG 2001 Plasma total homocysteine concentrations are unrelated to insulin sensitivity and components of the metabolic syndrome in healthy men. J Clin Endocrinol Metab 86:719 –723 Rosolova H, Simon J, Mayer Jr O, Racek J, Dierze T, Jacobsen DW 2002 Unexpected inverse relationship between insulin resistance and serum homocysteine in healthy subjects. Physiol Res 51:93–98 Vrbikova J, Bicikova M, Tallova J, Hill M, Starka L 2002 Homocysteine and steroid levels in metformin-treated women with polycystic ovary syndrome. Exp Clin Endocrinol Diabetes 110:74 –76 Gursu MF, Baydas G, Cikim G, Canatan H 2002 Insulin increases homocysteine levels in a dose-dependent manner in diabetic rats. Arch Med Res 33: 305–307