efficiency programmes to get customers to help deliver water savings, it can contribute to ... were unsure if they could give an accurate breakdown of costs. It is ...
How much do water companies spend on customer engagement in the UK and internationally?
Hazel Lewis, Elaine Gallagher, Aaron Burton, Nicci Russell External Report December 2018
Executive Summary Several UK water companies, along with the economic regulator (Ofwat) have identified the necessity to move towards proactive customer engagement, with a particular focus on achieving large scale water use reduction. As a result of climate change and the expanding population, improved water efficiency is an increasingly important global issue. However, to date there is a lack of suitable research in this area. Waterwise aimed to address a portion of this gap in knowledge through an exploratory survey, predominantly focusing on spending by water utilities in the UK, Europe, USA and Australia on their customer communications and marketing on water efficiency. This research also aimed to compare and contrast company spend on engagement relative to their levels of water efficiency. Key findings are: ●
Communication strategies are relatively similar from company to company, both in terms of the media used, and the message content.
●
The majority of water companies engage with customers on a variety of water efficiency topics, with the most common methods of engagement relating to water saving behaviours and water saving products.
●
Digital media, websites, leaflets and social media were the most common forms of communication employed by the participating companies.
●
Facebook and twitter were found to be the most common form of social media communication
●
Proportionate spend varied greatly across regions with Australia dedicating a much greater portion of their annual spend to this. Increased spend in drought years was also varied across companies.
●
Greater investment in water efficiency and resources communications would have a range of benefits as part of the 2019 price review.
●
Australia spends a larger portion of total company spend on water efficiency and resources communications than Europe, UK and USA. The percentage of total company spend used on water resources and efficiency communications: Australia = 6% USA = 1%. EU = 1%. UK = >0.2%
●
For drought years, some companies spent a much greater portion of their annual spend than on average years ·
1
Acknowledgements This report was produced by Waterwise with funding from Thames Water. We would also like to thank all the water companies in the UK, USA, Australia and Europe who participated in the study.
2
Introduction Background Water efficiency is a key contributor to resilience, and water companies are currently carrying out large-scale retrofitting and customer engagement programmes. Water efficiency, scaled up even further, is also an invaluable tool in driving customer participation – as well as using water efficiency programmes to get customers to help deliver water savings, it can contribute to multi-layered relationships to help inform, track and improve customer service and outcomes across companies. Water companies in the UK have traditionally had less of a relationship with customers and this has been more reactive linked to billing and metering or other services issues. The National Infrastructure Commission have also expressed the importance of evidence for this. Additionally, the new Leadership Group on Water Efficiency and Customer Participation would benefit from this evidence. There is a research gap in this area around the question: what are the ranges/ proportion of total spend that goes on customer engagement and communications on water efficiency and water resources? Objectives Ofwat and water companies such as Thames Water are recognising the need to move towards proactive customer engagement, particularly around delivering large scale reduction in water use. However, there is a lack of research in this area and this project aimed to: ● ● ● ●
Identify the range and proportion of total spend in the UK on customer engagement and communications by water companies Identify the range and proportion of total spend on customer engagement and communications in the USA and Australia Compare and contrast engagement spend and relate this to relative levels of water efficiency Provide a summary that can inform the Leadership Group on Water Efficiency and Customer Participation, National Infrastructure Commission, Thames Water, Ofwat and other water companies to support greater customer engagement in PR19
3
Methodology Waterwise worked with Thames Water to agree upon a set of survey questions, which can be found in appendix 1. These survey questions were designed to gather information that addressed the above objectives. The majority of questions asked respondents to reveal how much the water company spent on various aspects on customer engagement and communications. It was also asked how much was spent during a drought year, as well as per capita consumption (PCC or equivalent). Some questions were also added to get a more complete idea of the way in which the water company undertakes water efficiency and water resources communications and engagement. Respondents answered questions about spend on different aspects in their own currency and ranges of spend were given for ease of comparison. Waterwise compiled a contact list consisting of water efficiency managers, chief customer officers and communications managers (or their equivalent) within water companies in the UK, US, Australia and Europe. The survey was also distributed via social media and the International Water Association IWA Connect platform. The survey was sent to 38 water companies, plus several partner organisations, who asked for responses from their networks. Where no response or an incomplete survey was received, follow up calls were made. These follow up calls indicated that many people were reluctant to take part in the survey because they were unsure if they could give an accurate breakdown of costs. It is assumed that the lack of response from European organisations is, at least in part, due to the language barrier. In the end survey responses were received from 20 water companies: 8 UK water companies (plus 4 incomplete), 3 US water companies (plus 1 incomplete), 2 Australian Water companies, 1 European Water company and one Asian water company (survey incomplete). In this report all companies have been kept anonymous and labelled with the region in which they operate followed by a random number (UK = United Kingdom, USA = United States of America, Aus = Australia and EU = Europe).
4
Results Which of the following do you engage with customers about? The majority of companies responded that water saving behaviours followed by water saving products and water resources planning (general) were the key areas in which they were engaging customers. Leakage and the current water resources situation (such as reservoir levels) were less commonly used as a point of engagement with customers.
5
How often does your company use the following for communication about water efficiency and/or water resources in an average year? When asked about communication frequency with respect to water efficiency and/or water resources, there was a clear trend showing the prevalence of education, digital media and social media, with websites and leaflets also reported as being quite popular. It would appear from visual interpretation of the responses that overall, the frequency of communication is similar across all companies with just a few companies falling under or coming in over this approximate mean. It is also apparent that for many companies home audits form a sizeable portion of their communication, while other companies do not report using this method at all. The findings also suggest that the vast majority of companies appear to utilise each of the ten communication methods listed with just a few exceptions.
6
Which of the following social media platforms do you use for communication and engagement about water efficiency and/or water resources? It is apparent from the responses that the vast majority of participating water companies tend to favour the use of Facebook and Twitter for social media communication and engagement. The use of Youtube is also quite popular. Other popular media such as Snapchat, Instagram and Storify are less used across the water sector and may present an opportunity for further exploration.
7
Staffing and Delivery The answers to these questions varied widely across water companies, and many found it difficult to answer, as those responsible for communications, especially water efficiency and resources, were usually also responsible for other things. The ratio of all communications to dedicated water efficiency/resources communications staff ranged from 7% to 100%. Some staff sat under communications and some under water efficiency, whilst other companies had teams for conservation and public affairs, which did similar jobs. The graph below shows, for those that answered, the frequency with which they separated out the spending and/or delivery on water resources and water efficiency (0 = never, 4 = always). The European water company surveyed said that they did not have any communications about water resources, and that the company does not manage the resources (bulk water is purchased from a public company).
8
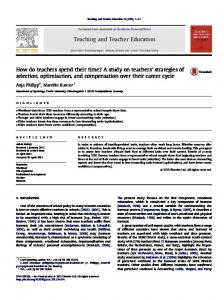
Per capita consumption Per capita consumption reported by water companies varied greatly between the USA, Australia, UK and Europe.
Average of litres per person per day
Australia
Europe
UK
USA
274
110
145
293.75
Communications - total spend by region. Using the higher end of the ranges given, and with the removal of outliers, the chart below shows the average percentage of overall annual spend spent on customer communications and engagement about water efficiency and resources. This was much higher in Australia than other regions. Australian companies spent 6 or more times as much than other companies yet have a relatively low frequency of using all methods of communication with customers (graph on page 7). This may be because they spend more on individual campaigns, but run fewer campaigns.
9
Drought spend total comparison The percentage of annual spend on communications and engagement on the issues of water efficiency and water resources was far higher in a drought year for several UK water companies. The difference was less marked one of the two Australian companies, the EU company and the US companies.
10
Percentage of Spend per Customer The percentage of total spend spent on communications and engagement around water efficiency and water resources was lowest in the UK, compared to other regions. The below table shows the reported average spend and the number of customers as indicated by company websites.
Company USA 4 Aus 2 UK 6 EU 1 UK 9 UK 4 UK 3 USA 3 UK 12 UK 1 USA 2 Aus 1
Percentage of spend Percentage of spend (average year) (drought year) Number of customers 2.03 2.03 31500 1.09 1.09 65000 0.20 1.00 282000 0.82 0.82 287641 0.25 0.13 713000 0.17 0.83 1200000 0.09 0.18 1600000 0.01 0.01 2700000 0.06 0.17 4300000 0.02 0.17 15000000 0.16 0.21 19000000 10.67 21.35 31500
11
For the purpose of clarity, Aus 1 was removed from the above chart as the percentage spend is 10-100 times more than other companies. Aside from Aus 1, there appears to be a weak correlation between percentage of spend per customer and number of customers. In other words, smaller water companies spend more per person on communication and engagement around these issues than larger companies. It is possible that this is due to a scaling affect, where communications with a larger customer base costs less, proportionally, than it does with a smaller audience. Whilst total spend and spend on communications was self-reported by the company, the number of customers was taken from the companies’ websites.
12
Types of communications spend Relative spend on different communication and engagement channels varied from company to company. Home audits made up a significant amount of engagement budget for water efficiency in most UK companies. Education (via schools) was also method on which a high proportion of spend was commonly spent. One UK water company explained that whilst there are various other topics and projects that also need communicating simultaneously, water efficiency certainly has the lion's share of airtime and as a topic, has one of the biggest communications spends and investment. A UK water company, in a water scarce region, said that in the dry year or drought year this would ramp up exponentially. And that they have a significantly elevated communications plan ready to deploy should we need it. In contrast, the European water company surveyed explained that as Water scarcity in their zone is permanent; they do not link their conservation campaigns to drought periods. Furthermore, drought periods do not strongly affect the main drinking water resources (desalination and deep groundwater wells).
13
PCC comparisons The graph below shows that in the UK there is no correlation between the amount spent on communications and engagement around water efficiency and water resources and the average household consumption (litres per person per day). It is possible this is because large spending does not necessarily equate to effective communication or engagement with customers, leading to behaviour change. Household consumption is also dependent on factors such as socio-economic status and climate. However, this is still a relatively small sample size compared to the total number of water companies, so it is difficult to determine whether there truly is no correlation . Average consumption was self reported by water companies in the survey.
14
Implications for water companies in England and Wales in the 2019 Price Review (PR19) The economic regulator, Ofwat, works with private water companies and other stakeholders to set the prices they can charge and the types of investment and services to customers that are 1
expected every five years. From Waterwise’s reading of the methodology for PR19 , we think effective hooks for increasing customer participation through water efficiency include the below.
1. Water efficiency and customer participation can contribute to all four PR19 priorities customer service, resilience, affordability and innovation
2. Water efficiency and customer participation can provide multiple benefits not only in terms of outcomes for customers, society and the economy, but also within companies, in terms of the regulatory drivers for business plans
3. Water efficiency and customer participation approaches will contribute to high ambition in the common performance commitments on per capita consumption and risk-based resilience (water)
4. Water efficiency and customer participation approaches contribute to the three dimensions of resilience set out by Ofwat - corporate (for which read ‘legitimacy’), financial and operational - and its seven resilience principles
5. Water efficiency and customer participation approaches meet the criteria of an exceptional plan: ‘high quality with significant ambition and innovation for customers’. ‘Exceptional’ plans receive financial rewards: 0.2% pa of regulated equity
6. As CMEX replaces SIM, comparisons with other sectors will be included, providing greater incentives for innovative customer participation through water efficiency
7. DMEX - innovative water efficiency programmes with developers and customers will contribute to a better DMEX score
8. Avoiding ‘average’ performance - which will incur penalties through ODIs - through innovation and ambition in water efficiency and customer participation
1
https://www.ofwat.gov.uk/wp-content/uploads/2017/12/Final-methodology-1.pdf
15
9. Avoiding special cost factor claims - strongly discouraged - through innovative and ambitious customer participation and water efficiency programmes for supply demand gaps
10. Increasing ambition and innovation in water efficiency and customer participation during the PR14 period will help in meeting frontier levels of efficiency and performance from day 1 of the PR19 period
11. Innovative and ambitious water efficiency and customer participation programmes and approaches can help underpin and meet stretching bespoke performance commitments, which are one of the key elements of flexibility in a more tightly-controlled price review framework than at PR14. From those companies surveyed, the UK had the lowest average percentage of overall spend on customer communications and engagement about water efficiency and water resources management. The evidence in this report supports the need for greater investment by UK water companies in this area. There is a potential risk that investment in ‘customer participation’ as supported by Ofwat won’t lead to improvements in water use efficiency or customer resilience. Therefore, dedicated investment in water efficiency programmes should be a part of the overall approach by water companies to enable resilience and improve customer satisfaction.
16
Conclusion In summary, in terms of customer engagement, it is apparent that the majority of companies engage with customers on a variety of water efficiency topics, with the most common methods of engagement relating to water saving behaviours and water saving products. With regard to water efficiency communication, it was apparent that digital media, websites, leaflets and social media were the most common forms of communication employed by the participating companies. Facebook and twitter were found to be the most common form of social media communication, with instagram and snapchat utilised much less. With regard to communications around efficiency and resources, there was an apparent lack of transparency relative to spending dedicated to this issue as a result of staffing structure, and this varied across companies. It was also found that with respect to the percentage spend on water efficiency and resources, Australia spent a significantly larger portion than Europe or the USA. The UKs percentage spend was significantly less than the figure for Europe (although it must be noted that there was only one respondent from Europe). Interestingly, it was shown that for drought years, some companies spent a much greater portion of their annual spend than on average years, while other companies spend similar amounts, irrespective of whether it was a drought year. Data showed that the UK currently sits behind the European average with regard to per capita consumption, at 145 litres per person compared to the European average of 110 litres. However, customers in the UK are using significantly less than Australia and the USA, at 274 and 294 litres, respectively. With regards to the implications for 2019 price review, greater investment in water efficiency communications will have a range of benefits as set out in this report.
17
Appendix 1 Survey Improved water efficiency is increasingly important globally due to increasing population pressure and climate change. Several UK water companies and the economic regulator (Ofwat) recognise the need to move towards pro-active customer engagement, particularly around delivering larger scale reductions in water use. However, there is a lack of research in this area. Therefore, this project aims to: •Identify the range and proportion of total spend by water utilities in the UK, Europe, USA and Australia on customer communications and marketing by water companies on water efficiency and water resources • Compare and contrast engagement spend and relate this to relative levels of water efficiency In this survey we will ask you about your water company's spend on communication and engagement about the issues of water efficiency and water resources, and the methods you use to do this. The results will be analysed and published to support the Water Efficiency Leadership group in the UK, the National Infrastructure Commission and water companies in developing their 2019 business plans. This survey will take approximately 10 minutes to complete, or longer if you need to look things up 1. Which water utility do you work for? ____________ 2. Do you give permission for your organisation to be named in the final report? YES NO In this section, you will be asked to how much you spend on different areas of customer engagement - if you are unsure of any answers, please fill this out as best you can, and then forward this to colleagues who may know. As with all subsequent questions, please answer in your own currency. 3. In which region does your water utility operate?
18
UK
Europe (euro zone)
Australia
USA
Other (please specify country and currency)
4. Which of the following do you engage with customers about? Water resources planning (generally)
Leakage
Metering
Water saving behaviours
Water saving products
Water resources planning (specific programmes of demand/supply) Current water situation (e.g. reservoir levels)
Other (please specify)
5. How often does your company use the following for communication about water efficiency and/or water resources in an average year? (Response options: Never, Rarely, Sometimes, Often, Always) Radio Digital media
Social media
Print advertising
Website
Outdoor media (e.g. billboards)
Home Audits
Education (via schools)
Direct Mail i.e. information on bill Leaflets or similar
Other (please specify) 6. Which of the following social media platforms do you use for communication and engagement about water efficiency and/or water resources? Facebook
Twitter
Youtube
Storify
Snapchat
Instagram
Other (please specify)
7. How many staff members do you have on your communications team? 8. How many people do you have working on water efficiency/resource communication and engagement across the company? If possible, please give details 9. What is your household/residential PCC (per capita consumption in Litres/person/day or nearest equivalent - please specify units and a very brief calculation method)? Engagement Spend (Euro)
19
In this section, you will be asked to how much you spend on different areas of customer engagement - if you are unsure of any answers, please fill this out as best you can, and then forward this to colleagues who may know. Please answer in Euros (please note, the categories are converted from pounds, so some may not seem like the most intuitive categorisations). This is the final page of questions. 10. Who delivers water efficiency communications and engagement for your water company? Please try to give approximate percentages of how much each delivers. e.g. x% delivered in house, y% delivered by marketing agency 11. The following questions ask about communication and engagement spend on water efficiency and resources combined. Do you separate your spending/delivery on these issues? Always
Often
Sometimes
Rarely
Never
Other (please specify)
12. On average, how much does your water utility spend on customer communications and customer engagement about water efficiency and water resources annually? 0 – nothing at all
Under 57,000
57,000-114,000
114,000-570, 000
570k - 1,140,000
1,140,00-1,709,00
1,709,00 -2,277,700
Over 2,277,700
13. How much does your company spend on the following types of communication and engagement about water efficiency and/or water resources in an average year (in your own currency)? Radio
Digital media
Outdoor media (e.g. billboards)
Social media
Print advertising
Website
Home Audits Education (via schools)
Direct Mail i.e. information on bill leaflets or similar
Other (please state)
14. Typically, how much does your water utility spend (in total) on customer communications and customer engagement about water resources and efficiency in a year with a drought period? 0 – nothing at all
Under 57,000
57,000-114,000
114k-570, 000
570k – 1,140,000
1,140,00-1,709,00
1,709,00 – 2,277,700
Over 2,277,700
15. How much does your company spend on the following types of communication and engagement about water efficiency and/or water resources in year with a drought (in your own currency)?
20
Radio
Digital media
Social media
Outdoor media (e.g. billboards)
Print advertising
Website
Home Audits Education (via schools)
Direct Mail i.e. information on bill leaflets or similar
Other (please state)
16. What is your company's overall annual spend? This means the total spend for all assets, operations, wholesale and retail activities, i.e. what is included in your annual financial reporting (in your own currency). 17. Is there any other information you would like to provide? Engagement Spend (USD) In this section, you will be asked to how much you spend on different areas of customer engagement - if you are unsure of any answers, please fill this out as best you can, and then forward this to colleagues who may know. Please answer in $ (USD) (please note, the categories are converted from pounds, so some may not seem like the most intuitive categorisations). This is the final page of questions. 18. Who delivers water efficiency communications and engagement for your water company? Please try to give approximate percentages of how much each delivers. e.g. x% delivered in house, y% delivered by marketing agency 19. The following questions ask about communication and engagement spend on water efficiency and resources combined. Do you separate your spending/delivery on these issues? Always
Often
Sometimes
Rarely
Never
Other (please specify)
20. On average, how much does your water utility spend on customer communications and customer engagement about water efficiency and water resources annually? 0 – nothing at all 653,000-1,303,152
Under 65,300 1,303,152-1,954,825
65,300 - 113,025
130,25-653,000
1,954,825– 2,606,305
Over 2,606,305
21. How much does your company spend on the following types of communication and engagement about water efficiency and/or water resources in an average year (in your own currency)? Radio
Digital media
Outdoor media (e.g. billboards)
Social media
Print advertising
Website
Home Audits Education (via schools)
Direct Mail i.e. information on bill leaflets or similar
Other (please state)
21
22. Typically, how much does your water utility spend on customer communications and customer engagement about water resources and efficiency in a year with a drought period? 0 – nothing at all 653,000-1,303,152
Under 65,300 1,303,152-1,954,825
65,300 - 113,025
130,25-653,000
1,954,825– 2,606,305
Over 2,606,305
23. How much does your company spend on the following types of communication and engagement about water efficiency and/or water resources in year with a drought (in your own currency)? Radio
Digital media
Social media
Outdoor media (e.g. billboards)
Print advertising
Website
Home Audits Education (via schools)
Direct Mail i.e. information on bill leaflets or similar
Other (please state)
24. What is your company's overall annual spend? This means the total spend for all assets, operations, wholesale and retail activities, e.i. what is included in your annual financial reporting (in your own currency). 25. Is there any other information you would like to provide? Engagement Spend (UK) In this section, you will be asked to how much you spend on different areas of customer engagement - if you are unsure of any answers, please fill this out as best you can, and then forward this to colleagues who may know. Please answer in GBP (Stirling). This is the final page of questions. 26. Who delivers water efficiency communications and engagement for your water company? Please try to give approximate percentages of how much each delivers. e.g. x% delivered in house, y% delivered by marketing agency 27. The following questions ask about communication and engagement spend on water efficiency and resources combined. Do you separate your spending/delivery on these issues? Always
Often
Sometimes
Rarely
Never
Other (please specify)
28. On average, how much does your water utility spend on customer communications and customer engagement about water efficiency and water resources annually? 0 – nothing at all 500k-1 million
0-50k 1 million - 2 million
50k-100k
100k-500k
over 2 million 22
29. How much does your company spend on the following types of communication and engagement about water efficiency and/or water resources in an average year (in your own currency)? Radio
Digital media
Outdoor media (e.g. billboards)
Social media
Print advertising
Website
Home Audits Education (via schools)
Direct Mail i.e. information on bill leaflets or similar
Other (please state)
30. Typically, how much does your water utility spend on customer communications and customer engagement about water resources and efficiency in a year with a drought period? 0 – nothing at all 500k-1 million
0-50k
50k-100k
1 million - 2 million
100k-500k
over 2 million
31. How much does your company spend on the following for communication about water efficiency and/or water resources in an year with a drought (in your own currency)? Radio
Digital media
Outdoor media (e.g. billboards)
Social media
Print advertising
Website
Home Audits Education (via schools)
Direct Mail i.e. information on bill leaflets or similar
Other (please state)
32. What is your company's overall annual spend? This means the total spend for all assets, operations, wholesale and retail activities, e.i. what is included in your annual financial reporting (in your own currency). 33. Is there any other information you would like to provide? Engagement Spend (Aus) In this section, you will be asked to how much you spend on different areas of customer engagement - if you are unsure of any answers, please fill this out as best you can, and then forward this to colleagues who may know. Please answer in $ (Australian Dollars). This is the final page of questions. 34. Who delivers water efficiency communications and engagement for your water company? Please try to give approximate percentages of how much each delivers. e.g. x% delivered in house, y% delivered by marketing agency 35. The following questions ask about communication and engagement spend on water efficiency and resources combined. Do you separate your spending/delivery on these issues?
23
Always
Often
Sometimes
Rarely
Never
Other (please specify)
36. On average, how much does your water utility spend on customer communications and customer engagement about water efficiency and water resources annually? 0 – nothing at all 817,570 – 1,635,140
Under 81,760 1,635,140 – 2,452,710
81,760-163,515
163,515 – 817,570
2,452,710– 3,270,280
Over 3,270,280
37. How much does your company spend on the following types of communication and engagement about water efficiency and/or water resources in an average year (in your own currency)? Radio
Digital media
Outdoor media (e.g. billboards)
Social media
Print advertising
Website
Home Audits Education (via schools)
Direct Mail i.e. information on bill leaflets or similar
Other (please state)
38. Typically, how much does your water utility spend on customer communications and customer engagement about water resources and efficiency in a year with a drought period? 0 – nothing at all 817,570 – 1,635,140
Under 81,760 1,635,140 – 2,452,710
81,760-163,515 2,452,710– 3,270,280
163,515 – 817,570 Over 3,270,280
39. How much does your company spend on the following types of communication and engagement about water efficiency and/or water resources in year with a drought (in your own currency)? 40. What is your company's overall annual spend? This means the total spend for all assets, operations, wholesale and retail activities (in your own currency). 41. Is there any other information you would like to provide? Engagement Spend (misc currency) In this section, you will be asked to how much you spend on different areas of customer engagement - if you are unsure of any answers, please fill this out as best you can, and then forward this to colleagues who may know. Please answer in your own currency 42. Who delivers water efficiency communications and engagement for your water company? Please try to give approximate percentages of how much each delivers. e.g. x% delivered in house, y% delivered by marketing agency
24
43. The following questions ask about communication and engagement spend on water efficiency and resources combined. Do you separate your spending/delivery on these issues? Always
Often
Sometimes
Rarely
Never
Other (please specify)
44. On average, how much does your water utility spend on customer communications and customer engagement about water efficiency and water resources annually?
25