JOURNAL OF VIROLOGY, Apr. 2001, p. 3259–3267 0022-538X/01/$04.00⫹0 DOI: 10.1128/JVI.75.7.3259–3267.2001 Copyright © 2001, American Society for Microbiology. All Rights Reserved.
Vol. 75, No. 7
Human Immunodeficiency Virus Seroconversion and Evolution of the Hepatitis C Virus Quasispecies QING MAO,1,2 STUART C. RAY,1 OLIVER LAEYENDECKER,1 JOHN R. TICEHURST,3,4 STEFFANIE A. STRATHDEE,5 DAVID VLAHOV,5 AND DAVID L. THOMAS1,5* Departments of Medicine,1 Pathology,3 and Epidemiology,5 Johns Hopkins Medical Institutions, Baltimore, and Center for Devices and Radiological Health, Food and Drug Administration, Rockville,4 Maryland, and Southwest Hospital, Third Military Medical University, Chongqing, Peoples’ Republic of China2 Received 14 September 2000/Accepted 4 January 2001
When chronic hepatitis C virus (HCV) infections are complicated by acquisition of human immunodeficiency virus (HIV), liver disease appears to accelerate and serum levels of HCV RNA may rise. We hypothesized that HIV might affect the HCV quasispecies by decreasing both complexity (if HIV-induced immunosuppression lessens pressure for selecting HCV substitutions) and the ratio of nonsynonymous (dN) to synonymous (dS) substitutions, because dN may be lower (if there is less selective pressure). To test this hypothesis, we studied the evolution of HCV sequences in 10 persons with chronic HCV infection who seroconverted to HIV and, over the next 3 years, had slow or rapid progression of HIV-associated disease. From each subject, four serum specimens were selected with reference to HIV seroconversion: (i) more than 2 years prior, (ii) less than 2 years prior, (iii) less than 2 years after, and (iv) more than 2 years after. The HCV quasispecies in these specimens was characterized by generating clones containing 1 kb of cDNA that spanned the E1 gene and the E2 hypervariable region 1 (HVR1), followed by analysis of clonal frequencies (via electrophoretic migration) and nucleotide sequences. We examined 1,320 cDNA clones (33 per time point) and 287 sequences (median of 7 per time point). We observed a trend toward lower dN/dS after HIV seroconversion in 7 of 10 subjects and lower dN/dS in those with rapid HIV disease progression. However, the magnitude of these differences was small. These results are consistent with the hypothesis that HIV infection alters the HCV quasispecies, but the number of subjects and observation time may be too low to characterize the full effect. of HCV RNA increases after HIV seroconversion (10, 29, 34). If this were due to increased replication, it would be expected to increase dS to a greater extent than dN, whereas if it were due to decreased clearance, the effect on the quasispecies would be difficult to predict. More importantly, HIV infection is broadly immunosuppressive. Therefore, we hypothesized that dN/dS would decrease after HIV seroconversion, and to a greater extent in those who have rapid progression of HIVrelated immunosuppression. To test this hypothesis, we examined the evolution of envelope HCV sequences in persons with chronic hepatitis C before and after HIV seroconversion, including subjects with rapid progression to AIDS.
An estimated 170 million persons are infected with hepatitis C virus (HCV) worldwide (38). Due to shared transmission routes, the prevalence of hepatitis C is especially high among persons infected with human immunodeficiency virus (HIV). In the United States, 15 to 30% of HIV-infected persons also have hepatitis C (30). HIV infection appears to accelerate the progression of HCV-related liver disease (2, 6, 9), an issue whose importance has increased with the prolonged survival of HIV-infected persons receiving highly active antiretroviral therapy. In some cohorts of HIV-infected persons with hemophilia, liver failure has become the leading cause of mortality, and HCV infection is now considered an HIV opportunistic disease (4). Like HIV, HCV exists as a quasispecies (7). Nucleotide substitutions that do not affect the protein structure (synonymous substitutions, or dS) accumulate in a quasispecies over time, reflecting the rate of viral replication among other factors. In contrast, changes in the amino acid composition of the HCV quasispecies (nonsynonymous substitutions, or dN) typically reflect immunologic pressure and are not predicted by replication alone (8, 26). HCV infection is 10-fold more transmissible by needlestick exposure than HIV infection and is thus typically acquired years before HIV (14, 17, 35). However, there is little available information on the initial effect of HIV infection on the course of hepatitis C. We and others have shown that the serum level
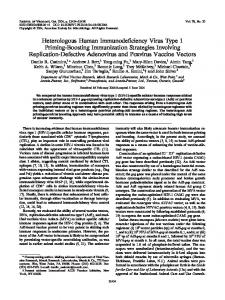
MATERIALS AND METHODS Subjects. We studied HCV-infected subjects who acquired HIV infection while participating in a prospective study. A total of 2,238 HIV type 1 (HIV-1)seronegative persons who were ⱖ17 years of age and acknowledged injection drug use in the preceding 10 years were recruited in 1988 to 1989 and completed at least one semiannual follow-up visit (36). By January 1996, 252 persons acquired HIV-1 infection (22), and 240 were candidates for this investigation because they had HCV antibody before HIV seroconversion. Ten subjects were chosen because they were followed for ⱖ2 years before and after HIV-1 seroconversion and either had a rapid progression of HIV-1 infection (defined as CD4⫹ lymphocyte count of ⱕ200/mm3 within 3 years of HIV-1 seroconversion and designated rapid progressors) or stable HIV-1 infection (defined as CD4⫹ lymphocyte count of ⱖ500/mm3 and no opportunistic illnesses 3 years after HIV-1 seroconversion and designated slow progressors). The HCV quasispecies was examined twice prior to HIV-1 seroconversion (designated preseroconversion, or pre-SC1 and pre-SC2) and twice after (designated postseroconversion, or post-SC1 and post-SC2) in sera stored at ⫺80°C (Fig. 1). HIV-1 seroconversion was estimated to occur midway between the dates that HIV-1 antibody negative and positive sera were collected, which was less than 11 months for all 10 subjects.
* Corresponding author. Mailing address: 1147 Ross Bldg., 720 Rutland Ave., Baltimore, MD 21205. Phone: (410) 955-0349. Fax: (410) 614-7564. E-mail:
[email protected]. 3259
3260
MAO ET AL.
J. VIROL.
FIG. 1. Hypothetical course of HIV-1 seroconverter to show study conventions. For example, pre-SC1 refers to the first serum specimen in which the HCV quasispecies was studied. Pre-HIV refers to sequence evolution before HIV-1 seroconversion, as measured at pre-SC1 and preSC2. HIV seroconversion was estimated as the midpoint between the last HIV antibody (Ab)-negative and first HIV antibody-positive specimens.
Clinical laboratory testing. Other reports have described the overall cohort (36), HIV seroconverters (22), the natural history of HCV infection (33), and the methods used to assess HIV RNA, HIV antibody, HCV antibody, HCV RNA, and CD4⫹ T lymphocytes. Briefly, HIV-1 antibody testing was performed by commercial enzyme-linked immunosorbent assay (ELISA; Genetic Systems, Seattle, Wash.), with confirmation of repeatedly reactive ELISAs by Western blotting (DuPont, Wilmington, Del.). HIV-1 RNA levels were determined by a second-version branched DNA signal amplification assay (Chiron Corp., Emeryville, Calif.). Subjects were tested for HCV antibodies using a commercial assay (HCV EIA 2.0; Ortho Diagnostics, Raritan, N.J.). HCV RNA levels were determined by COBAS MONITOR 2.0 detection (Roche Diagnostic Systems, Indianapolis, Ind.). Specimens above the linear range for the assay are diluted until a result in the linear range is obtained. Diluted results are extrapolated to a predicted concentration. For measurement of T-cell subsets, heparinized whole blood was stained with fluorescent monoclonal antibodies using a modified whole blood method, and percentages of CD3⫹, CD4⫹, and CD8⫹ T cells were determined by flow cytometry (16). HCV envelope region amplification. HCV RNA characterization was based on examination of 33 cloned cDNAs spanning the 1,026-nucleotide (nt) region thought to encode envelope protein E1 and a segment of E2, including HVR1 (27). RNA was extracted from 100 l of plasma or serum using a QIAmp viral RNA mini kit according to the protocol of the manufacturer (Qiagen, Valencia, Calif.). One-fifth of the extract was used to generate cDNA in a 20-l reaction at 42°C for 1 h with 200 U of Superscript II RNAse H⫺ reverse transcriptase (Life Technologies, Gaithersburg, Md.) and first-round PCR reverse primer. The 2-l cDNA synthesis reaction was used for first-round PCR in a 25-l reaction containing 0.625 U of Expand HF polymerase mixture (Boehringer Mannheim, Indianapolis, Ind.), 1.5 mM MgCl2, 0.2 mM deoxynucleoside triphosphates, and 0.4 M primers. Degenerate bases are indicated with standard International Union of Pure and Applied Chemistry codes. One microliter of the first reaction product was used as template for the inner nested PCR. The primers (and positions relative to the initiation codon of the HCV-1 polyprotein [5]) were as follows: outer forward (493 to 518), 5⬘-GCAACAGGGAACCTTCCTGGTTG CTC-3⬘; outer reverse (1862 to 1840), 5⬘-GTGCAGGGGTAGTGCCAGAGCC T-3⬘; inner forward (502 to 527), 5⬘-AACCTTCCTGGTTGCTCTTTCTCTAT3⬘; and inner reverse (1527 to 1507), 5⬘-GAAGCAATAYACYGGRCCACA-3⬘. Thermal cycling conditions for both the inner and outer reactions were as follows: denaturation for 120 s at 94°C, followed by 35 cycles of 15 s at 94°C, 30 s at 65°C, and 60 s at 72°C (during the last 25 cycles, the elongation time was progressively increased by 20 s per cycle). Cloning of cDNA and complexity analysis of 33 cloned cDNAs by electrophoretic migration. The 1-kb HCV cDNA product was ligated into vector pCR 2.1 and used to transform INV␣F⬘ cells (TA cloning kit; Invitrogen, Carlsbad, Calif.). Transformants were detected according to the manufacturer’s protocol, and cloning efficiency was ⬎90%. For each subject time point (four per subject), the gel shift patterns of 33 cloned cDNAs were examined by amplifying a 452-bp region spanning HVR1 as previously described (37). This nonradioactive method detects distinct variants within a sample by using a combination of heteroduplex analysis and singlestranded conformational polymorphism on a single gel (HDA⫹SSCP). A clonotype is defined as one or more cloned cDNAs that have indistinguishable pat-
terns of electrophoretic migration by HDA⫹SSCP. In our earlier study, the mean (⫾ standard deviation) genetic diversity of cloned cDNAs belonging to the same clonotype (intraclonotype diversity) was 0.6% (⫾0.9%), with 98.7% differing by less than 2% (37). The complexity of the quasispecies was characterized by the clonotype ratio, calculated as the number of clonotypes divided by 33, the number of cloned cDNAs examined. The clonotype ratio therefore varies from 0.03 (homogenous) to 1 (highly complex). Sequencing of representative cloned cDNAs. To examine each specimen’s quasispecies for trends in sequence variation, a subset of cloned cDNAs was identified for sequencing. For each subject, cloned cDNAs representing at least 70% (23 of 33) of the screened clones were selected for sequencing based on gel shift patterns. Plasmid DNA was isolated from a 3.5-ml broth culture (High Pure plasmid isolation kit; Boehringer Mannheim) according to the manufacturer’s protocol. Sequences were determined from this DNA using universal reverse primers with a PRISM version 2.1.1 automated sequencer (ABI, Foster City, Calif.). Sequences were assembled and edited in Sequencher (Gene Codes, Ann Arbor, Mich.) by a technician who was blinded to our hypotheses. Primer sequences were removed prior to analysis. Sequence validation. Sequence validation was carried out by recommended methods (19). To limit the effect of nucleotide misincorporations that occur during PCR and sequencing (31), we developed a computer program that corrects sporadic substitutions. For this algorithm, sporadic substitutions were defined as nucleotides that were observed only once among all sequences from that study subject. We observed 726 such substitutions among 281,547 sites after 70 cycles of PCR, or 3.7 ⫻ 105 sporadic substitutions/nucleotide sequenced/cycle of PCR, at the low end of the range of error rates measured for thermostable polymerases (1, 20) and therefore consistent with artifactual misincorporations. Because we obtained many sequences from each subject, from four visits, we felt that such sporadic substitutions were highly likely to be artifactual. When a single sporadic substitution was identified at a site, it was replaced with the base observed at that position in all other sequences from that subject. These revised sequences were used in the analysis, but the original sequences were submitted to GenBank. Phylogenetic analysis. Sequence alignments were randomly permuted 100 times using the SEQBOOT program from the PHYLIP package version 3.572c (11, 12). DNA distance matrices were calculated using the DNADIST program, maximum likelihood model, with a transition-to-transversion ratio of 4.25 (31). Permuted trees were generated using the NEIGHBOR program with random addition, and bootstrap values were obtained using CONSENSE. Subtype reference sequences used for phylogenetic analysis had the following accession numbers: 1a, AF009606 and M62321; 1b, D90208; 1c, D14853; 2a, D00944; 2b, D10988; 3a, D17763; 4a, Y11604; 5a, Y13184; 6a, Y12083; “7a,” D84263; “8a,” D84264; “9a,” D84265; “10a,” D63821; and “11a,” D63822. Nonsynonymous and synonymous substitution frequencies were calculated using the method of Nei and Gojobori (21). Since observation time was the same, dN/dS was calculated by dividing dN by dS. VarPlot (a software program generated by S. C. Ray) was used to calculate dN, dS, and dN/dS in a sliding 30-nucleotide window that was centered on HVR1, as previously described (27). Nucleotide sequence accession numbers. The sequences were submitted to GenBank and were assigned accession numbers (AF344887 through AF345193).
VOL. 75, 2001
HIV SEROCONVERSION AND EVOLUTION OF HCV QUASISPECIES
3261
TABLE 1. Clinical characteristics of study subjectsa Interval (mo)c
Injection drug used
Heavy alcohol used,e
Subject
Age (yr)
Race
Gender
HCV duration (yr)b
Pre-SC1
Pre-SC2
Post-SC1
Post-SC2
Pre-HIV
Post-HIV
Pre-HIV
Post-HIV
SA SB SC SD SE RA RB RC RD RE
31 37 39 39 32 32 33 39 42 48
B W B B B B B B B B
M F F M M F M M M M
14.1 13.1 22.4 19.5 12.4 12.3 12.9 26.9 23.0 8.6
⫺33.0 ⫺41.5 ⫺36.4 ⫺37.0 ⫺24.4 ⫺44.8 ⫺30.8 ⫺63.7 ⫺42.2 ⫺47.4
⫺11.8 ⫺3.2 ⫺3.0 ⫺3.1 ⫺3 ⫺3.4 ⫺9.4 ⫺20.0 ⫺2.9 ⫺5.4
4.4 15.8 4.1 10.2 22.1 16.0 4.2 6.4 10.6 17.2
47.6 44.9 39.1 45.6 64.3 39.5 32.8 33.5 34.1 28.8
4 4 4 4 4 3 4 4 4 1
3 1 4 4 4 2 4 3 4 0
4 0 1 4 0 0 2 0 4 1
1 0 0 3 1 0 4 0 3 0
a Subjects are classified according to whether they are slow (SA to SE) or rapid (RA to RE) progressors (see Materials and Methods). B, black; W, white; M, male; F, female. Measurements refer to HIV seroconversion unless otherwise specified. b Estimated using time from first injection drug use (13). c Defined in Materials and Methods and the legend to Fig. 1. d Refers to the proportion of semiannual visits at which the behavior was acknowledged: 0, never; 1, 1 to 49%; 2, 50 to 74%; 3, 75 to 99%; 4, all visits. e Defined as ⬎260 g/week (33).
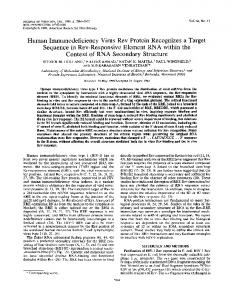
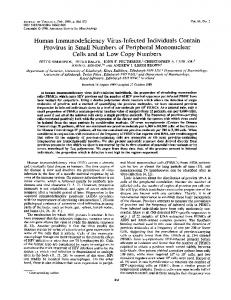
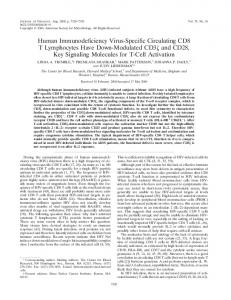
RESULTS The clinical characteristics of the 10 study subjects are shown in Table 1 and Fig. 2. As designed, the CD4⫹ lymphocyte counts of slow progressors were stable, while those of rapid progressors were less than 200/mm3 within 3 years of HIV seroconversion. The post-SC2 CD4⫹ lymphocyte counts (per millimeter cubed) of rapid progressor subjects RA to RE were 19, 116, 148, 14, and 31, respectively. No substantial differences were detected between rapid and slow HIV progressors in age, estimated duration of HCV infection (time from first injection drug use), race, and gender. Likewise, the pre- and postseroconversion intervals and patterns of alcohol and injection drug use were similar between slow and rapid progressors. Complexity of cDNA clones (clonotype ratio). We examined a total of 1,320 cDNA clones, 33 at each of four visits for 10 subjects. The pre-SC1 clonotype ratio ranged from 0.22 to 0.52 for slow progressors and from 0.42 to 0.66 for rapid progressors. Between pre-SC1 and pre-SC2, the clonotype ratio increased in two of five slow progressors and four of five rapid progressors (Fig. 3). Although immunosuppression was predicted to be associated with a decrease in complexity, between post-SC1 and post-SC2, the clonotype ratio actually increased in four of five slow progressors and two of five rapid progressors. Clonotype ratios were not strongly associated with HCV viral load (data not shown). Nucleotide sequence. Approximately 1 kb (975 to 981 nt) of sequence was determined from each of 287 cDNA clones, a median of 7 (range, 1 to 18) per person. Sequences were obtained from enough clonotypes to represent at least 70% (range, 70 to 88%) of each subject’s quasispecies. Overall (between pre-SC1 and post-SC2), both synonymous and nonsynonymous substitutions accumulated throughout the 1 kb of envelope sequence evaluated. For all 10 subjects, nonsynonymous substitutions accumulated most in HVR1, and dN/dS was highest in HVR1 (Fig. 4). The HVR1 dN/dS of rapid progressors overlapped that of slow progressors. As with complexity (clonotype ratio), little correlation was detected between dN or dS and the serum level of HCV RNA (data not shown). We hypothesized that HIV infection, especially rapidly progressing HIV infection, would be associated with a decrease in
dN/dS. In support of this hypothesis, dN/dS was lower post-HIV than pre-HIV for 7 of 10 subjects (median change, ⫺0.15; range, ⫺2.18 to 0.30), and the median dN/dS was lower in rapid progressors than in slow progressors at each interval (Fig. 5A). Although we predicted that dN/dS would be lower following HIV infection, particularly in rapid progressors, we were surprised to find that this trend was also present prior to HIV infection. To further explore this unexpected finding, we selected nine additional subjects from the same cohort using similar criteria (five rapid HIV progressors and four slow HIV progressors), and subject SD was reexamined. From pre-SC1 and pre-SC2 samples, the same reverse transcription-PCR method was used to generate cDNA that was directly sequenced, rather than cloned, and compared to generate preHIV dN/dS. As with the first 10, there was overlap in the distribution of dN/dS. However, dN/dS was highest in two slow progressors and lowest in two rapid progressors (Fig. 5B). To assess the accuracy of the clonotype analysis, we compared direct sequencing of a separate aliquot of subject SD’s pre-SC2 serum specimen to the sequences obtained from cloned cDNA. The direct sequence differed from the sequence of the majority clonotype cDNA at 18 of 947 positions. However, at 14 of these 18 positions, the direct sequence was consistent with the weighted average of the clonotype cDNA sequences for the pre-SC2 visit, at 2 positions the direct sequence matched one or more minority cDNAs, and at only 2 positions were they clearly different, a frequency consistent with misincorporations during direct sequencing (31). DISCUSSION In this study, detailed analysis of HCV sequence evolution before and after HIV seroconversion revealed evidence of reduced immune pressure (lower dN/dS) after HIV seroconversion, though in these 10 subjects the trend did not reach statistical significance. Immune pressure also appeared to be lower in subjects with rapid progression of HIV disease, and we were surprised to find that this trend was present even before HIV infection. As the first prospective evaluation of this medically important interaction, this research contributes to our understanding of HCV pathogenesis. In particular, these
3262
MAO ET AL.
J. VIROL.
FIG. 2. HCV RNA levels (ovals) and CD4 lymphocyte counts (squares) with respect to HIV seroconversion. Subjects are identified at the left as designated in Table 1. The four visits at which the HCV quasispecies was assessed correspond to HCV RNA determinations.
data suggest that while early HIV infection may be immunosuppressive, there are factors other than HIV infection that more substantially affect HCV sequence evolution. There is no experimental model for HIV-HCV coinfection, requiring that evaluations of the pathogenesis of dual infection be performed by observation of humans. However, heteroge-
neity in the progression of HIV and HCV infections is poorly understood and probably multifactorial, underscoring the importance of strictly controlled, observational studies. This investigation was designed to assess precisely the role of HIV infection on HCV sequence evolution. A major strength of the study is that host variability, which may hinder investigation of
VOL. 75, 2001
HIV SEROCONVERSION AND EVOLUTION OF HCV QUASISPECIES
3263
FIG. 2—Continued.
a multifactorial process, was eliminated through comparison of sequence evolution in the same person before and after early HIV seroconversion. In addition, we examined other conditions that might influence sequence progression, including duration of HCV infection, sampling interval, age, race, alcohol and drug use, and HCV viral load.
Since observed trends in the effect of HIV infection on early evolution of the HCV quasispecies did not reach statistical significance (using two-tailed testing) and no relationship was detected between HIV infection and complexity, the sensitivity and accuracy of the ascertainment method warrant consideration. Precision was achieved in quasispecies evaluations by
3264
MAO ET AL.
J. VIROL.
FIG. 3. Clonotype ratios in 10 HIV seroconverters. Each point represents a unique subject visit. Slow and rapid progressors are identified by designations used in Table 1.
examination of more than 1,000 cDNA clones; at least 70% of the observed sequences of each subject time point were considered. Absent a “gold standard,” accuracy cannot truly be evaluated. However, intra- and intersubject dN/dS differences were noted, indicating that variation could be detected. When a separate serum aliquot from one subject was tested by an independent method (direct sequencing), only 2 (0.2%) of 947 nt differed significantly. Since this frequency is consistent with misincorporations during direct sequencing (31), we believe that sequences obtained using our methods represent the quasispecies accurately. We are aware of only one other study that addressed the hypothesis that HIV infection would decrease dN/dS by decreasing dN and/or increasing dS. Sherman and coworkers found greater nonsynonymous diversity in HVR1 clones from 10 HIV-HCV-coinfected persons compared with 7 HIV-
negative HCV-infected persons (28). Rates of substitution could not be calculated because only one serum specimen was examined. It is not apparent why greater dN was associated with HIV infection in that study and not in ours (data not shown). It is possible that their HIV-negative group differed from the HIV-positive subjects in factors that affected dN, a consideration that cannot be excluded due to the cross-sectional design. In addition, that study examined only 31 amino acids (93 nt), representing 1/10 of the amplicon examined in the present study. However, it is also possible that with sufficient duration of HIV infection we would have observed this effect, since our observations were restricted to the first few years after HIV seroconversion. Other investigators have shown that HCV sequences change substantially when negative or positive pressures are altered. Compromised production of antibodies, as occurs with agam-
VOL. 75, 2001
HIV SEROCONVERSION AND EVOLUTION OF HCV QUASISPECIES
3265
FIG. 4. Overall dN/dS of envelope sequences at the amino acid positions in the HCV-1 polyprotein according to HIV progression status (5). Results were calculated comparing pre-SC1 with post-SC2 sequences using VarPlot configured with a 30-amino-acid sliding window centered on HVR1, as previously described (27). Similar plots were generated using a 10-amino-acid window and analysis of dN alone (not shown).
maglobulinemic patients, is associated with decreased accumulation of envelope mutations (3, 18). Likewise, liver transplantation is associated with higher HCV RNA levels and changes in envelope and other HCV sequences (15, 32). Interferon treatment is also associated with changes in HCV envelope and, to a lesser extent, NS5 sequences (23–25). Existing data do not conclusively explain what other than HIV infection may modify evolution of the HCV quasispecies. We and others have shown that HCV replication alone is not sufficient to produce nonsynonymous substitutions in chimpanzees sampled prior to a measurable adaptive immune response (26). That dN represents immune pressure was recently shown by Evans and coworkers in a study of simian immunodeficiency virus-infected macaques (8). Nonsynonymous substitutions were noted in regions of immune pressure but not in animals without the appropriate class 1 major histocompatibility context. Nonetheless, it is possible that the nature of the poorly understood immune deficiency caused by early HIV infection would not affect HCV nonsynonymous substitution rate in epitopes reflected by the ⬃1-kb envelope amplicon studied in this investigation. Unlike in the nonhuman simian immunodeficiency virus animal experiment conducted by Evans and coworkers, it was
impossible to control the onset of immunosuppression from HIV in this investigation of humans. Thus, it was important to normalize dN for replicative cycles by analyzing dN/dS, since dS is similarly affected by replication but not directly by immune pressure. In addition, confounding by artifactual (in vitro) substitutions was diminished by eliminating sporadic substitutions prior to analysis and by applying identical methods to sequences before and after HIV infection. One important limitation of our study is the relatively small number of subjects. If many factors affect HCV sequence evolution, it is possible that we would fail to detect an effect of HIV infection in a study of 10 subjects. It is also possible that greater differences might be observed if HIV seroconversion occurred closer to the onset of HCV infection, rather than in persons with established hepatitis C. In addition, as mentioned above, since this study was designed to assess the effect of early HIV infection, longer follow-up may reveal a greater effect. It was interesting that prior to HIV seroconversion, HCV envelope dN/dS was generally higher in slow progressors than in rapid progressors. Although confined to very few subjects, this trend was observed again in a validation group assembled strictly to test this observation. If confirmed, this unexpected finding would suggest that subjects with a stronger immune
3266
MAO ET AL.
J. VIROL.
FIG. 5. Pre- and post-HIV dN/dS in rapid and slow progressors. (A) Sequences determined from cDNA clones representing at least 70% of 33 clones examined from each serum specimen, based on HDA⫹SSCP. (B) Sequences determined by direct sequencing of reverse transcription-PCR products. Relationship of pre-HIV and post-HIV to HIV seroconversion is as defined in the legend to Fig. 1.
response to HCV may also have a more effective immunologic response to HIV infection. In summary, we failed to detect a substantial effect of early HIV infection on HCV sequence evolution, though our results did suggest that HIV infection results in less immune pressure on HCV (lower dN/dS), especially in those with rapid progression to AIDS. Additional studies are needed to understand how HIV infection alters the course of hepatitis C. ACKNOWLEDGMENTS This research was supported by National Institutes of Health grants DA 04334, DA 12568, and DA 10627.
6.
7. 8.
9.
REFERENCES 1. Barnes, W. M. 1992. The fidelity of Taq polymerase catalyzing PCR is improved by an N-terminal deletion. Gene 112:29–35. 2. Benhamou, Y., M. Bochet, M. Di, V. F. Charlotte, F. Azria, A. Coutellier, M. Vidaud, F. Bricaire, P. Opolon, C. Katlama, and T. Poynard. 1999. Liver fibrosis progression in human immunodeficiency virus and hepatitis C virus coinfected patients. The Multivirc Group. Hepatology 30:1054–1058. 3. Booth, J. C., U. Kumar, D. Webster, J. Monjardino, and H. C. Thomas. 1998. Comparison of the rate of sequence variation in the hypervariable region of E2/NS1 region of hepatitis C virus in normal and hypogammaglobulinemic patients. Hepatology 27:223–227. 4. Centers for Disease Control and Prevention. 1999. 1999 USPHS/IDSA guidelines for the prevention of opportunistic infections in persons infected with human immunodeficiency virus: disease-specific recommendations. USPHS/ IDSA Prevention of Opportunistic Infections Working Group. U.S. Public Health Services/Infectious Diseases Society of America. Morbid. Mortal. Wkly. Rep. 48:1–82. 5. Choo, Q. L., K. H. Richman, J. H. Han, K. Berger, C. Lee, C. Dong, C. Gallegos,
10.
11. 12. 13. 14.
15.
Coit, R. Medina-Selby, and P. J. Barr. 1991. Genetic organization and diversity of the hepatitis C virus. Proc. Natl. Acad. Sci. USA 88:2451–2455. Darby, S. C., D. W. Ewart, P. L. Giangrande, R. J. Spooner, C. R. Rizza, G. M. Dusheiko, C. A. Lee, C. A. Ludlam, and F. E. Preston. 1997. Mortality from liver cancer and liver disease in haemophilic men and boys in UK given blood products contaminated with hepatitis C. Lancet 350:1425–1431. Eigen, M. 1993. Viral quasispecies. Sci. Am. 269:42–49. Evans, D. T., D. H. O’Connor, P. Jing, J. L. Dzuris, J. Sidney, J. da Silva, T. M. Allen, H. Horton, J. E. Venham, R. A. Rudersdorf, T. Vogel, C. D. Pauza, R. E. Bontrop, R. DeMars, A. Sette, A. L. Hughes, and D. I. Watkins. 1999. Virus-specific cytotoxic T-lymphocyte responses select for amino-acid variation in simian immunodeficiency virus Env and Nef. Nat. Med. 5:1270– 1276. Eyster, M. E., L. S. Diamondstone, J. M. Lien, W. C. Ehmann, S. Quan, and J. J. Goedert. 1993. Natural history of hepatitis C virus infection in multitransfused hemophiliacs: effect of coinfection with human immunodeficiency virus. The Multicenter Hemophilia Cohort Study. J. Acquir. Immune Defic. Syndr. 6:602–610. Eyster, M. E., M. W. Fried, A. M. Di Bisceglie, and J. J. Goedert. 1994. Increasing hepatitis C virus RNA levels in hemophiliacs: relationship to human immunodeficiency virus infection and liver disease. Blood 84:1020– 1023. Felsenstein, J. 1985. Confidence limits on phylogenies: an approach using the bootstrap. Evolution 39:783–791. Felsenstein, J. 1989. PHYLIP—phylogeny inference package (version 3.2). Cladistics 5:164–166. Garfein, R. S., M. C. Doherty, D. Brown, D. L. Thomas, S. A. Villano, E. Monterroso, and D. Vlahov. 1998. Hepatitis C virus infection among shortterm injection drug users. J. Acquir. Immune Defic. Syndr. 18:S11–S19. Gerberding, J. L. 1994. Incidence and prevalence of human immunodeficiency virus, hepatitis B virus, hepatitis C virus, and cytomegalovirus among health care personnel at risk for blood exposure: final report from a longitudinal study. J. Infect. Dis. 170:1410–1417. Gretch, D. R., S. J. Polyak, J. J. Wilson, R. L. Carithers, Jr., J. D. Perkins, and L. Corey. 1996. Tracking hepatitis C virus quasispecies major and minor
VOL. 75, 2001
16. 17. 18. 19. 20. 21. 22. 23.
24.
25.
26. 27.
HIV SEROCONVERSION AND EVOLUTION OF HCV QUASISPECIES
variants in symptomatic and asymptomatic liver transplant recipients. J. Virol. 70:7622–7631. Hoffman, R. A., P. C. Kung, W. P. Hansen, and G. Goldstein. 1980. Simple and rapid measurement of human T lymphocytes and their subclasses in peripheral blood. Proc. Natl. Acad. Sci. US A 77:4914–4917. Kiyosawa, K. 1992. Hepatitis C after needlestick injuries. Ann. Intern. Med. 116:345–345. Kumar, U., J. Monjardino, and H. C. Thomas. 1994. Hypervariable region of hepatitis C virus envelope glycoprotein (E2/NS1) in an agammaglobulinemic patient. Gastroenterology 106:1072–1075. Learn, G. H., Jr., B. T. Korber, B. Foley, B. H. Hahn, S. M. Wolinsky, and J. I. Mullins. 1996. Maintaining the integrity of human immunodeficiency virus sequence databases. J. Virol. 70:5720–5730. Lundberg, K. S., D. D. Shoemaker, M. W. Adams, J. M. Short, J. A. Sorge, and E. J. Mathur. 1991. High-fidelity amplification using a thermostable DNA polymerase isolated from Pyrococcus furiosus. Gene 108:1–6. Nei, M., and T. Gojobori. 1986. Simple methods for estimating the numbers of synonymous and nonsynonymous nucleotide substitutions. Mol. Biol. Evol. 3:418–426. Nelson, K. E., D. Vlahov, L. Solomon, S. Cohn, and A. Mun ˜ oz. 1995. Temporal trends of incident human immunodeficiency virus infection in a cohort of injecting drug users in Baltimore, Md. Arch. Intern. Med. 155:1305–1311. Nousbaum, J., S. J. Polyak, S. C. Ray, D. G. Sullivan, A. M. Larson, R. L. Carithers, Jr., and D. R. Gretch. 2000. Prospective characterization of fulllength hepatitis C virus NS5A quasispecies during induction and combination antiviral therapy. J. Virol. 74:9028–9038. Pawlotsky, J. M., G. Germanidis, P. O. Frainais, M. Bouvier, A. Soulier, M. Pellerin, and D. Dhumeaux. 1999. Evolution of the hepatitis C virus second envelope protein hypervariable region in chronically infected patients receiving alpha interferon therapy. J. Virol. 73:6490–6499. Pawlotsky, J. M., G. Germanidis, A. U. Neumann, M. Pellerin, P. O. Frainais, and D. Dhumeaux. 1998. Interferon resistance of hepatitis C virus genotype 1b: relationship to nonstructural 5A gene quasispecies mutations. J. Virol. 72:2795–2805. Ray, S. C., Q. Mao, R. E. Lanford, S. Bassett, O. Laeyendecker, Y. M. Wang, and D. L. Thomas. 2000. Hypervariable region 1 sequence stability during hepatitis C virus replication in chimpanzees. J. Virol. 74:3058–3066. Ray, S. C., Y. M. Wang, O. Laeyendecker, J. Ticehurst, S. A. Villano, and D. L. Thomas. 1998. Acute hepatitis C virus structural gene sequences as predictors of persistent viremia: hypervariable region 1 as decoy. J. Virol. 73: 2938–2946.
3267
28. Sherman, K. E., C. Andreatta, J. O’Brien, A. Gutierrez, and R. Harris. 1996. Hepatitis C in human immunodeficiency virus-coinfected patients: Increased variability in the hypervariable envelope coding domain. Hepatology 23:688– 694. 29. Sherman, K. E., J. O’Brien, A. G. Gutierrez, S. Harrison, M. Urdea, P. Neuwald, and J. Wilber. 1993. Quantitative evaluation of hepatitis C virus RNA in patients with concurrent human immunodeficiency virus infections. J. Clin. Microbiol. 31:2679–2682. 30. Sherman, K. E., S. D. Rouster, R. Chung, and N. Rajicic. 2000. Hepatitis C prevalence in HIV-infected patients: a cross-sectional analysis of the US adult clinical trials group. Antiviral Ther. 5(Suppl. 1):64. 31. Smith, D. B., and P. Simmonds. 1997. Characteristics of nucleotide substitution in the hepatitis C virus genome: constraints on sequence change in coding regions at both ends of the genome. J. Mol. Evol. 45:238–246. 32. Sullivan, D. G., J. J. Wilson, R. L. Carithers, Jr., J. D. Perkins, and D. R. Gretch. 1998. Multigene tracking of hepatitis C virus quasispecies after liver transplantation: correlation of genetic diversification in the envelope region with asymptomatic or mild disease patterns. J. Virol. 72:10036–10043. 33. Thomas, D. L., J. Astemborski, R. M. Rai, F. A. Anania, M. Schaeffer, N. Galai, K. Nolt, K. E. Nelson, S. A. Strathdee, L. Johnson, O. Laeyendecker, J. Boitnott, L. E. Wilson, and D. Vlahov. 2000. The natural history of hepatitis C virus infection: host, viral, and environmental factors. JAMA 284: 450–456. 34. Thomas, D. L., J. W. Shih, H. J. Alter, D. Vlahov, S. Cohn, D. R. Hoover, L. Cheung, and K. E. Nelson. 1996. Effect of human immunodeficiency virus on hepatitis C virus infection among injecting drug users. J. Infect. Dis. 174:690– 695. 35. Villano, S. A., D. Vlahov, K. E. Nelson, C. M. Lyles, S. Cohn, and D. L. Thomas. 1997. Incidence and risk factors for hepatitis C among injection drug users in Baltimore, Maryland. J. Clin. Microbiol. 35:3274–3277. 36. Vlahov, D., J. C. Anthony, A. Mun ˜ oz, J. Margolik, D. D. Celentano, L. Solomon, and B. F. Polk. 1991. The ALIVE Study: a longitudinal study of HIV-1 infection in intravenous drug users: description of methods. J. Drug Issues 21:759–776. 37. Wang, Y. M., S. C. Ray, O. Laeyendecker, J. R. Ticehurst, and D. L. Thomas. 1998. Assessment of hepatitis C virus sequence complexity by electrophoretic mobilities of both single- and double-stranded DNAs. J. Clin. Microbiol. 36: 2982–2989. 38. World Health Organization. 1997. Hepatitis C: global prevalence. Wkly. Epidemiol. Rec. 72:341–348.