Jan 21, 2005 - total rainfall falls over land, which is then channeled through river flows (R) and discharges into the Arctic Ocean. A direct consequence of this ...
GEOPHYSICAL RESEARCH LETTERS, VOL. 32, L02703, doi:10.1029/2004GL021570, 2005
Human influence on increasing Arctic river discharges Peili Wu, Richard Wood, and Peter Stott Hadley Centre for Climate Prediction and Research, Met Office, Exeter, UK Received 21 September 2004; revised 3 December 2004; accepted 22 December 2004; published 21 January 2005.
[ 1 ] Climate models predict an intensification of hydrological cycle as anthropogenic greenhouse gas emissions to the atmosphere increase. As part of the process, high latitude precipitation and consequently river runoffs are expected to increase. Some observations have indicated that such a process may have started already during the late half of the 20th century. Arctic river flow changes simulated in HadCM3 with all historical external factors agree with river monitoring data reported by Peterson et al. [2002]. Model simulated total river discharges into the Arctic Ocean have increased by an annual rate of 8.73 km3 since the 1960s. Increasing high latitude precipitation is contributing a substantial part to the upward trend, which is likely to be the early stage of intensifying global hydrological cycle caused by anthropogenic factors, as we do not see the trend in the same model forced with natural factors alone. Citation: Wu, P., R. Wood, and P. Stott (2005), Human influence on increasing Arctic river discharges, Geophys. Res. Lett., 32, L02703, doi:10.1029/2004GL021570.
1. Introduction [2] Global warming is expected to intensify the hydrological cycle with increasingly more rainfall dropping into the polar regions (IPCC report [Houghton et al., 2001]). Apart from net precipitation (precipitation-evaporation or P-E) directly into the polar oceans, a large proportion of the total rainfall falls over land, which is then channeled through river flows (R) and discharges into the Arctic Ocean. A direct consequence of this is a freshening of the polar oceans. There may be observed signs of this happening already [Dickson et al., 2002; Curry et al., 2003]. Being a major location of deep ocean convection in the world, the sub-polar North Atlantic is very sensitive to freshwater perturbations [e.g., Manabe and Stouffer, 1995]. Freshwater transport to and from the Arctic/sub-polar North Atlantic oceans have important implications for the global climate system, such as the thermohaline circulation (THC). Excessive freshwater input into the sub-polar North Atlantic could significantly suppress the Atlantic THC and consequently cause the near surface air temperature to drop several degrees over Europe due to weakened northward ocean heat transport [e.g., Vellinga and Wood, 2002]. [3] Given the difficulties of measuring precipitation over the polar regions, Arctic river flows may be a good integral indicator for monitoring climate change. Peterson et al. [2002] have reported increasing discharges of six major Eurasian rivers into the Arctic Ocean for the 20th century based on river monitoring data. Net precipitation, melt ice and river discharges may all have contributed to the observed [Dickson et al., 2002; Curry et al., 2003] and the Published in 2005 by the American Geophysical Union.
model simulated [Wu et al., 2004] freshening of the polar oceans during the past four decades. It is very desirable to understand what role Arctic river runoffs have played. A very recent study by Oka and Hasumi [2004] have shown that the deep North Atlantic circulation is particularly sensitive to high latitude river runoffs. It is also of great importance from the model development perspective to validate our model simulations against valuable observations. Accurate simulation of recent forced decadal climate changes increases our confidence in model projection of future forced changes.
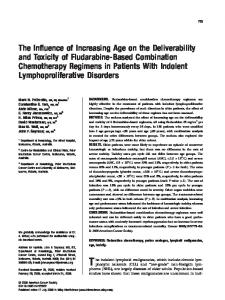
2. Global Warming and the Hydrological Cycle [4] The moisture holding capacity of the atmosphere is governed by the Clausius-Clapeyron equation and increases exponentially with rising temperature. However, changes in global precipitation rate (the intensity of the overall hydrological cycle) are controlled not by the availability of moisture but by the availability of energy [Mitchell et al., 1987; Allen and Ingram, 2002; Yang et al., 2003], namely the ability of the troposphere to radiate away latent heat released by precipitation. Longwave greenhouse gas forcing from above and shortwave surface warming both tend to warm the troposphere, but the global precipitation rate mainly depends on surface warming [Yang et al., 2003; Lambert et al., 2004]. In a global integral sense, the IPCC report predicts that the average temperature and precipitation rate will both increase in the 21st century. [5] One important aspect of the hydrological cycle involves freshwater transport (moisture transport by the atmosphere). It is possible that the hydrological cycle intensifies without total precipitation increase globally. Figure 1 shows the zonal mean surface freshwater flux (P-E+R) anomalies into the ocean in a climate simulation of the 21st century using HadCM3 [Gordon et al., 2000] with the IPCC-B2 scenario forcing. Figure 1 does not include the melting of sea-ice. The trends are clearly different at different latitudes. Net precipitation into the subtropics has a negative trend while the polar regions show a strong positive trend in both hemispheres. For the Arctic (north of 65°N), river inflow is the dominant factor for the total surface freshwater flux (P-E+R). Although the integrated P-E increases at a slightly faster rate, R still contributes 70– 80% of total P-E+R. [6] There is also a noticeable shift of the tropical rainfall band from the southern hemisphere to the north, possibly reflecting the position and frequency of ITCZ. The total freshwater input into the ocean creates an increasing imbalance between the northern and southern hemispheres. The integral north-south difference has a correlation with the Atlantic maximum overturning streamfunction of 0.57 on
L02703
1 of 4
L02703
WU ET AL.: INCREASING ARCTIC RIVER DISCHARGES
Figure 1. Zonal mean anomalies of surface fresh water flux into the ocean simulated by the HadCM3 coupled climate model using the IPCC SRES B2 scenario.
L02703
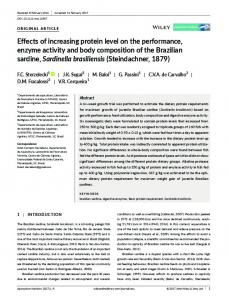
2002] and North Atlantic water mass changes [Wu et al., 2004]. The four simulations were each started from different initial conditions taken from a long HadCM3 control run at a 100yr interval. The model was run for nearly 140 years but only the last 73 years are presented here. [9] Figure 2 shows separately (a) discharges from Eurasian rivers alone and (b) total river discharge into the Arctic Ocean for the period between 1929 and 2001. Figure 2a is specifically produced to compare with observations reported by Peterson et al. [2002]. However, the model was only able to resolve five rather than six of the major Eurasian rivers. Figure 2b includes all the rivers within the polar cap north of 65°N. The thin lines are from each individual member and thick line is the ensemble mean. Figure 2a shows a higher average of Eurasian river flows than observations, but the trends are consistent. Most of the upward trend appears from the 1980s or 1960s. To compare with Peterson et al. [2002], the linear trend from 1936 is also drawn. For the long term trend, the model shows an annual rate of increase by 1.82 km3, close to the 2 km3 per year calculated by Peterson et al. [2002]. The mean Arctic river runoff here is 0.1065 Sv (1 Sv = 106 m3/Sec), compared to 0.104 Sv for the control simulation in HadCM3 [Pardaens et al., 2003]. There is strong interannual variability and large uncertainty for a particular year. However, a strong upward trend from the 1960s is clearly evident among all members as shown by the ensemble
annual means, 0.92 on decadal means. Thorpe et al. [2001] have found that northern high latitude warming is the major contributor to a reduction of meridional steric height gradient that is correlated to the weakening THC in HadCM3 on decadal time scales. This shift could also have contributed to the slowdown of THC in the model based on the mechanism proposed by Vellinga and Wu [2004], which emphasizes the role of asymmetric freshwater forcing across the equator in long term THC variability. Both P-E and R show significant increasing trends in northern high latitudes suggesting increasing precipitation on both land and ocean. Further work is required to investigate the possible role of asymmetric freshwater forcing on THC changes. [7] However, this is only a model prediction based on scenario projection of future anthropogenic emissions. In reality, natural factors such as solar variability and volcanic eruptions also contribute to forcing the climate system. Can we detect any early signs of those trends at the current stage?
3. Simulated Changes of 20th Century Arctic River Flows [8] First, a set of four simulations using HadCM3 is analyzed for the simulation of Arctic river runoffs. These four simulations were carried out with all historical external forcings including both anthropogenic (greenhouse gases, sulphate aerosols and ozone) and natural (solar and volcanic) factors. These simulations have already shown success in simulating some of the observed changes for the 20th century, including the global mean surface air temperature [Stott et al., 2000], Arctic sea-ice changes [Gregory et al.,
Figure 2. Evolution of HadCM3 simulated river discharges into the Arctic Ocean for the 20th century: (a) discharges from Eurasian rivers only in comparison with Peterson et al.’s [2002] observations and (b) total discharges from all model Arctic rivers. Thin lines show the four individual runs and the thick solid line is the ensemble mean. The four members are simulated with different initial conditions under the same estimated all historical external forcings.
2 of 4
L02703
WU ET AL.: INCREASING ARCTIC RIVER DISCHARGES
L02703
onwards. Although Peterson et al. calculated their trend from 1936, it is very clear (from their Figure 2) that most of the observed increase also occurred after the 1960s. The annual rate of increase from 1965 is about 8.73 km3/yr, far greater than the long term trend. [ 10 ] To summarize, the all forcings simulation by HadCM3 is in very good agreement with Peterson et al.’s [2002] river monitoring data, confirming an increasing river discharge into the Arctic Ocean. The upward trend is consistent with increasing high latitude precipitation that shows a similar trend. However, global land precipitation in the same model simulation does not show such a trend [Allen and Ingram, 2002; Lambert et al., 2004], which suggests an increased northward transport of moisture by the atmosphere to the catchment areas of the Arctic rivers must have taken place.
4. Attribution
Figure 3. Evolution of HadCM3 simulated total river discharges into the Arctic Ocean for the 20th century: (a) natural forcings ensemble and (b) anthropogenic forcings ensemble. Thin lines are individual members and solid thick lines are the ensemble mean. Straight lines are the linear trends for the corresponding periods. mean. The upward trend appears stronger in Figure 2b than Figure 2a. The long term pan-Arctic trend between 1936 and 2001 is 2.81 km3/yr compared to 1.82 km3/yr for Eurasian rivers alone. On average, there is 6.5% increase between 1936 and 2001, so there is about 185 km3/yr more freshwater discharged into the Arctic Ocean through river runoffs at the end of the period. It is even clearer to see from Figure 2b that most of the increase occurs from 1960s
[11] The immediate question to ask is what causes the upward trend during the late half of the past century. Is that trend the early part of the model predicted intensification of the global hydrological cycle under global warming? [12] Parallel HadCM3 simulations, with either natural forcings only or anthropogenic forcings only, are also analyzed in the same way as shown in Figure 2b. Figure 3a is the equivalent of Figure 2b but for the natural forcings only runs while Figure 3b is for the anthropogenic runs. The difference between Figures 3a and 3b is very clear. There is no trend during the 20th century if anthropogenic forcings are excluded. With purely anthropogenic forcings the long term trend from 1936 would be 4.15 km3/yr, nearly 50% more than the rate of the all forcings simulation. Comparing Figure 3 with Figure 2, there is a strong indication that anthropogenic forcing is playing the major role in the increased river flows into the Arctic Ocean seen in the all forcings simulation during the past four decades. [13] One of the four members of the all forcings simulation was extended into the 21st century following the SRES B2 scenario while natural forcings were fixed at the end of the 20th century values. The total Arctic river discharge is
Figure 4. Comparison of HadCM3 all forcings ensemble mean simulation of Arctic river flow changes for the 20th century with the projected changes for the 21st century under the IPCC SRES B2 and A2 forcing scenarios, showing the upward trend of the late 20th century is probably part of long term increase in river discharges into the Arctic Ocean. 3 of 4
L02703
WU ET AL.: INCREASING ARCTIC RIVER DISCHARGES
plotted in Figure 4 as a thin solid line, with the all forcings ensemble mean superimposed. The dashed line is another anthropogenic simulation following the A2 scenario. The model predicts that Arctic river discharges will continue to rise in the new century if the current rate of anthropogenic emissions follows the IPCC projections. The observed [Peterson et al., 2002] and simulated (see Figure 2) upward trend during the late half of the 20th century seems to be part of the long term increase.
5. Conclusions [14] Climate models predict an intensifying hydrological cycle as global warming continues for the 21st century. As part of this process, net precipitation increases disproportionately at the high latitudes, particularly the northern high latitudes. There have been observational signs of this happening already, probably started during the late half of the 20th century as revealed by water mass property changes in the North Atlantic [Dickson et al., 2002; Curry et al., 2003] and river flow changes in the Arctic [Peterson et al., 2002]. [15] An ensemble simulation of the 20th century climate by the Hadley Centre’s coupled climate model HadCM3 proves successful in simulating many aspects of the observed climate change, including mean surface temperatures [Stott et al., 2000], Arctic sea ice changes [Gregory et al., 2002] and the recent freshening trend in the sub-polar North Atlantic Ocean [Wu et al., 2004]. The model was forced with both anthropogenic and natural external factors (all forcings simulation). In this paper we have shown that in the same model runs, the simulated Arctic river flow changes show a consistent upward trend from the 1960s with an annual rate of 8.73 km3. Both the timing and amplitude of the trend are in very good agreement with Peterson et al.’s [2002] report from river monitoring data. Ensemble mean integrated total precipitation over the polar cap north of 65°N shows a similar trend accounting for 70% of river discharge increase from 1965. The trend fits well in the large picture of long term climate change predicted by the same model under projected anthropogenic emissions. The trends are stronger in the ensemble simulation with only anthropogenic forcings. However, we do not find any clear trend in another set of parallel model simulations with only natural forcings. This suggests that historical anthropogenic forcing is likely to have been a major driving factor for the runoff increase. It is likely that such upward trend in river flow changes is part of an intensifying hydrological cycle at an early stage. [16]
Acknowledgments. This work is funded by the Department of Environment, Food and Rural Affairs under the Climate Prediction Program
L02703
(PECD/7/12/37). We thank Anne Pardaens, Michael Vellinga, Jonathan Gregory and Chris Gordon for helpful comments and discussions.
References Allen, M. R., and W. J. Ingram (2002), Constraints on future changes in climate and the hydrological cycle, Nature, 419, 224 – 232. Curry, R., B. Dickson, and I. Yashayaev (2003), A change in the freshwater balance of the Atlantic Ocean over the past four decades, Nature, 426, 826 – 829. Dickson, B., I. Yashayaev, J. Meincke, B. Turrel, S. Dye, and J. Holfort (2002), Rapid freshening of the deep North Atlantic Ocean over the past four decades, Nature, 416, 832 – 837. Gordon, C., C. Cooper, C. A. Senior, H. Banks, J. M. Gregory, T. C. Johns, J. F. B. Mitchell, and R. A. Wood (2000), The simulation of SST, sea ice extents and ocean heat transports in a version of the Hadley Centre coupled model without flux adjustments, Clim. Dyn., 16, 147 – 168. Gregory, J. M., P. A. Stott, D. J. Cresswell, N. A. Rayner, C. Gordon, and D. M. H. Sexton (2002), Recent and future changes in Arctic sea ice simulated by the HadCM3 AOGCM, Geophys. Res. Lett., 29(24), 2175, doi:10.1029/2001GL014575. Houghton, J. T., Y. Ding, D. J. Griggs, M. Noguer, P. J. van der Linden, and X. Dai (2001), Projection of future climate change, in Climate Change 2001: The Scientific Basis, edited by J. T. Houghton et al., pp. 525 – 582, Cambridge Univ. Press, New York. Lambert, F. H., P. A. Stott, M. R. Allen, and M. A. Palmer (2004), Detection and attribution of changes in 20th century land precipitation, Geophys. Res. Lett., 31, L10203, doi:10.1029/2004GL019545. Manabe, S., and R. J. Stouffer (1995), Simulation of abrupt climate change induced by fresh-water input into the North Atlantic Ocean, Nature, 378, 165 – 167. Mitchell, J. F. B., C. A. Wilson, and W. M. Cunnington (1987), On CO2 climate sensitivity and model dependence of results, Q. J. R. Meteorol. Soc., 113, 293 – 322. Oka, A., and H. Hasumi (2004), Effects of freshwater forcing on the Atlantic deep circulation: A study with an OGCM forced by two different surface freshwater flux datasets, J. Clim., 17, 2180 – 2194. Pardaens, A. K., H. T. Banks, J. M. Gregory, and P. R. Rowntree (2003), Freshwater transports in HadCM3, Clim. Dyn., 21, 177 – 195. Peterson, B. J., R. M. Holmes, J. W. McClelland, C. J. Vorosmarty, R. B. Lammers, A. I. Shiklomanov, I. A. Shiknomanov, and S. Rahmstorf (2002), Increasing river discharge to the Arctic Ocean, Science, 298, 2171 – 2173. Stott, P., S. Tett, G. Jones, M. Allen, J. Mitchell, and G. Jenkins (2000), External control of 20th century temperature by natural and anthropogenic forcings, Science, 290, 2133 – 2137. Thorpe, R. B., J. M. Gregory, T. C. Johns, R. A. Wood, and J. F. B. Mitchell (2001), Mechanisms determining the Atlantic thermohaline circulation response to greenhouse gas forcing in a non-flux-adjusted coupled climate model, J. Clim., 14, 3102 – 3116. Vellinga, M., and R. A. Wood (2002), Global climatic impacts of a collapse of the Atlantic thermohaline circulation, Clim. Change, 54, 251 – 267. Vellinga, M., and P. Wu (2004), Low-latitude freshwater influence on centennial oscillation of the thermohaline circulation, J. Clim., 17, 4498 – 4511. Wu, P., R. Wood, and P. Stott (2004), Does the recent freshening trend in the North Atlantic indicate a weakening thermohaline circulation?, Geophys. Res. Lett., 31, L02301, doi:10.1029/2003GL018584. Yang, F., A. Kumar, M. E. Schlesinger, and W. Wang (2003), Intensity of hydrological cycles in warmer climates, J. Clim., 16, 2419 – 2423.
P. Stott, R. Wood, and P. Wu, Hadley Centre for Climate Prediction and Research, Met Office, FitzRoy Road, Exeter EX1 3PB, UK. (peili.wu@ metoffice.gov.uk)
4 of 4