University School of Physical Education in Wrocław University School of Physical Education in Kraków
vol. 15, number 4 (December), 2014
University School of Physical Education in Wrocław (Akademia Wychowania Fizycznego we Wrocławiu) University School of Physical Education in Kraków (Akademia Wychowania Fizycznego im. Bronisława Czecha w Krakowie) Human Movement quarterly vol. 15, number 4 (December), 2014, pp. 191 – 250 Editor-in-Chief Alicja Rutkowska-Kucharska University School of Physical Education, Wrocław, Poland Associate Editor Edward Mleczko University School of Physical Education, Kraków, Poland Editorial Board Physical activity, fitness and health Wiesław Osiński University School of Physical Education, Poznań, Poland Applied sport sciences Zbigniew Trzaskoma Józef Piłsudski University of Physical Education, Warszawa, Poland Biomechanics and motor control Tadeusz Bober University School of Physical Education, Wrocław, Poland Kornelia Kulig University of Southern California, Los Angeles, USA Physiological aspects of sports Andrzej Suchanowski Józef Rusiecki Olsztyn University College, Olsztyn, Poland Psychological diagnostics of sport and exercise Andrzej Szmajke Opole University, Opole, Poland Advisory Board Wojtek J. Chodzko-Zajko Gudrun Doll-Tepper Józef Drabik Kenneth Hardman Andrew Hills Zofia Ignasiak Slobodan Jaric Toivo Jurimae Han C.G. Kemper Wojciech Lipoński Gabriel Łasiński Robert M. Malina Melinda M. Manore Philip E. Martin Joachim Mester Toshio Moritani Andrzej Pawłucki John S. Raglin Roland Renson Tadeusz Rychlewski James F. Sallis James S. Skinner Jerry R. Thomas Karl Weber Peter Weinberg Marek Woźniewski Guang Yue Wladimir M. Zatsiorsky Jerzy Żołądź
University of Illinois, Urbana, Illinois, USA Free University, Berlin, Germany University School of Physical Education and Sport, Gdańsk, Poland University of Worcester, Worcester, United Kingdom Queensland University of Technology, Queensland, Australia University School of Physical Education, Wrocław, Poland University of Delaware, Newark, Delaware, USA University of Tartu, Tartu, Estonia Vrije University, Amsterdam, The Netherlands University School of Physical Education, Poznań, Poland University School of Physical Education, Wrocław, Poland University of Texas, Austin, Texas, USA Oregon State University, Corvallis, Oregon, USA Iowa State University, Ames, Iowa, USA German Sport University, Cologne, Germany Kyoto University, Kyoto, Japan University School of Physical Education, Wrocław, Poland Indiana University, Bloomington, Indiana, USA Catholic University, Leuven, Belgium University School of Physical Education, Poznań, Poland San Diego State University, San Diego, California, USA Indiana University, Bloomington, Indiana, USA University of North Texas, Denton, Texas, USA German Sport University, Cologne, Germany Hamburg, Germany University School of Physical Education, Wrocław, Poland Cleveland Clinic Foundation, Cleveland, Ohio, USA Pennsylvania State University, State College, Pennsylvania, USA University School of Physical Education, Kraków, Poland
Translation: Michael Antkowiak, Tomasz Skirecki Design: Agnieszka Nyklasz Copy editor: Beata Irzykowska Statistical editor: Małgorzata Kołodziej Indexed in: SPORTDiscus, Index Copernicus, Altis, Sponet, Scopus, CAB Abstracts, Global Health 7 pkt wg rankingu Ministerstwa Nauki i Szkolnictwa Wyższego © Copyright 2014 by Wydawnictwo AWF we Wrocławiu ISSN 1732-3991 http://156.17.111.99/hum_mov Editorial Office Dominika Niedźwiedź 51-612 Wrocław, al. Ignacego Jana Paderewskiego 35, Poland, tel. 48 71 347 30 51,
[email protected] This is to certify the conformity with PN-EN-ISO 9001:2009 Circulation: 100
HUMAN MOVEMENT 2014, vol. 15 (4)
contents
Editorial..................................................................................................................................................................194 ph y sic a l ac t i v i t y, f i t n e s s a n d h e a lt h Justyna Drzał-Grabiec, Aleksandra Truszczyńska Body posture in young women involved in regular aerobic exercise................................................................195 Agnieszka Olchowska-Kotala, Krystyna Chromik Education and the prevention of postural defects..............................................................................................199 applied sport sciences Beata Pluta, Marcin Andrzejewski, Jarosław Lira The effects of rule changes on basketball game results in the Men’s European Basketball Championships........................................................................................... 204 biomechanics and motor control Jonathan Sinclair, Stephen Atkins, Hayley Vincent The effects of various running inclines on three-segment foot mechanics and plantar fascia strain...................................................................................................................................... 209 Artur Struzik, Andrzej Rokita, Bogdan Pietraszewski, Marek Popowczak Accuracy of replicating static torque and its effect on shooting accuracy in young basketball players..................................................................................................................................216 Jonathan Sinclair, Hayley Vincent, Paul John Taylor, Jack Hebron, Howard Thomas Hurst, Stephen Atkins Effects of varus orthotics on lower extremity kinematics during the pedal cycle...........................................221 Fellipe Machado Portela, Erika Carvalho Rodrigues, Arthur de Sá Ferreira A critical review of position- and velocity-based concepts of postural control during upright stance...........................................................................................................227 Dariusz Boguszewski, Sylwia Szkoda, Jakub Grzegorz Adamczyk, Dariusz Białoszewski Sports massage therapy on the reduction of delayed onset muscle soreness of the quadriceps femoris.................................................................................................................................... 234 physiological aspects of sports Theophilos Pilianidis, Nikolaos Mantzouranis, Nikolaos Siachos Evaluation of barefoot running in preadolescent athletes................................................................................ 238 Conferences............................................................................................................................................................243 Publishing guidelines – Regulamin publikowania prac....................................................................................... 244
193
HUMAN MOVEMENT 2014, vol. 15 (4)
editorial
We would like to express our deepest gratitude to all Reviewers for their most effective contribution to improvement of quality of Human Movement in 2014: Marianna Barlak, Warszawa (Poland) Tadeusz Bober, Wrocław (Poland) Michał Bronikowski, Poznań (Poland) Anna Burdukiewicz, Wrocław (Poland) Kamila Czajka, Wrocław (Poland) Jacek Dembiński, Wrocław (Poland) Henryk Duda, Kraków (Poland) Abbigail L. Fietzer, Los Angeles (USA) Sean Flanagan, Los Angeles (USA) Jan Gajewski, Warszawa (Poland) Rami Hashish, Los Angeles (USA) Janusz Iskra, Katowice (Poland) Zygfryd Juczyński, Bydgoszcz (Poland) Grzegorz Juras, Katowice (Poland) Adam Kantanista, Poznań (Poland) Adam Kawczyński, Wrocław (Poland) Tadeusz Koszczyc, Wrocław (Poland) Magdalena Król-Zielińska, Poznań (Poland) Magdalena Krzykała, Poznań (Poland) Michał Kuczyński, Wrocław (Poland) Lesław Kulmatycki, Wrocław (Poland) Janusz Maciaszek, Poznań (Poland) Waldemar Mieszała, Wrocław (Poland) Edward Mleczko, Kraków (Poland)
194
Bartosz Molik, Warszawa (Poland) Wiesław Osiński, Poznań (Poland) Beata Pluta, Poznań (Poland) John M. Popovich, East Lansing (USA) Miroslava Pridalova, Olomouc (Czech Republic) Danuta Pupek-Musialik, Poznań (Poland) Jerzy Sadowski, Biała Podlaska (Poland) Tomasz Sahaj, Poznań (Poland) Sachithra Samarawickrame, Los Angeles (USA) Adam Siemieński, Wrocław (Poland) Teresa Sławińska-Ochla, Wrocław (Poland) Małgorzata Słowińska-Lisowska, Wrocław (Poland) Aleksandra Stachoń, Wrocław (Poland) Rafał Stemplewski, Poznań (Poland) Helena Stokłosa, Katowice (Poland) Robert Szeklicki, Poznań (Poland) Maciej Tomczak, Poznań (Poland) Aleksander Tyka, Kraków (Poland) Sławomir Winiarski, Wrocław (Poland) Barbara Woynarowska, Warszawa (Poland) Jacek Zieliński, Poznań (Poland) Ewa Ziółkowska-Łajp, Poznań (Poland) Stanisław Żak, Kraków (Poland)
HUMAN MOVEMENT 2014, vol. 15 (4), 195– 198
Body posture in young women involved in regular aerobic exercise doi: 10.1515/humo-2015-0010
Justyna Drzał-Grabiec 1, Aleksandra Truszczyńska 2 * 1 2
University of Rzeszów, Rzeszów, Poland Józef Piłsudski University of Physical Education, Warsaw, Poland
Abstract
Purpose. The aim of the study was an assessment of posture in women who regularly perform aerobic exercise. Methods. The study group consisted of 50 women actively participating in aerobics classes (mean: age 28.64 ± 5.3 years, body mass 59.83 ± 6.7 kg, height 167.75 ± 4.9 cm, BMI 21.24 ± 3.6 m/kg2) and a control group of 50 women not involved in any regular physical activity (mean: age 28.55 ± 5.05 years, body mass 62.47 ± 10.5 kg, height 167.74 ± 4.8 cm, BMI 22.26 ± 4.8 m/kg2). All participants were subjected to a photogrammetric assessment of posture. Results. Statistically significant differences in posture were identified between the two groups for lumbarosacral and thoracolumbar spinal curvatures. Conclusions. Women who regularly perform aerobic exercise present greater thoracic kyphosis and shoulder asymmetry than women not involved in aerobics. Key words: aerobic exercise, body posture, photogrammetry, women, spine
Introduction Aerobic exercise as a form of physical activity is continuously developing. Mass media has encouraged this form of exercise to society, touting its positive effects on health and fitness. A lot of such information, however, is not entirely based on scientifically-proven facts but instead guided by marketing strategies. Scientific research to date has analysed some of the effects of such physical activity on the body. The literature indicates that the benefits of regular aerobics exercise include an increase in muscular strength, endurance, and coordination [1] as well as better intervertebral disc nutrition, better back pain prevention, and improved physical and mental condition [2]. Although studies such forms of exercise as Pilates, stretching, or weight training on individuals with postural disorders have shown improved postural control and reduced pain [3–5], the effects of regular aerobics exercise on body posture have yet to be studied. Therefore, the aim of the study was an assessment of posture in women who regularly perform aerobic exercise. Material and methods The study group involved 50 women (mean: age 28.64 ± 5.3 years, body mass 59.83 ± 6.7 kg, height 167.75 ± 4.9 cm, BMI 21.24 ± 3.6 m/kg2) who had been practicing aerobics regularly (two to three times per week) for at least 5 years. All participants attended classes in the same
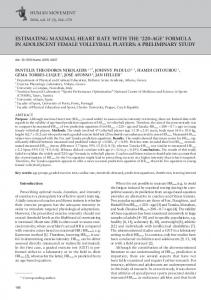
high quality fitness centre located in Warsaw, Poland by certified aerobics instructors holding degrees in physical education or sport. The control group consisted of 50 women (mean: age 28.55 ± 5.05 years, body mass 62.47 ± 10.5 kg, height 167.74 ± 4.8 cm, BMI 22.26 ± 4.8 m/kg2) not involved in any regular physical activity. Criteria for inclusion in the study were informed consent to participate in the study and, for the study group, active, regular and continuing participation in aerobic classes. Exclusion criteria were any acute or recent injuries and orthopaedic or neurologic disorders. Ethical approval was obtained by the Bioethics Committee of the Medical Faculty at the University of Rzeszów, Poland. The authors declare no conflict of interest. All participants were subjected to a photogrammetric assessment of posture, which involved photo-based anthropometric measurement of the back using equipment from CQ Elektronik System [6]. This method provides a spatial (three-dimensional) image by using projection equipment to displays lines on a patient’s back. The lines deform when they are projected on a patient’s back at a specific angle. These line deformations are dependent on how close or far away a reference marker is from the equipment and are registered by a computer, which uses numerical algorithms to generate a contour map of the back. Analysis of the photograms involved calculating the following angular measures (an illustration of how these parameters were measured is shown in Figure 1): ALPHA – lumbosacral spinal curvature calculated between the S1 and apex of lordosis,
* Corresponding author. 195
HUMAN MOVEMENT J. Drzał-Grabiec, A. Truszczyńska, Body posture in women
C7 – spinous process of the seventh cervical vertebra KP – apex of thoracic kyphosis PL – transition from kyphosis to lordosis LL – apex of lumbar lordosis S1 – transition from lumbar lordosis to the sacral spinal cord
Table. 2 Differences in body posture between the two groups Levene’s test for homogeneity of variance F
Figure 1. Illustration of analyzed postural measures how analyzed parameters were measured
BETA – thoracolumbar spinal curvature calculated between the transition from lordotic and kyphotic curves (at maximum kyphosis), GAMMA – thoracic spinal curvature calculated between the C7 and apex of kyphosis, KKP – thoracic kyphosis angle calculated as 180° – (BETA + GAMMA), GKP – depth of thoracic kyphosis calculated between the apex of kyphosis and transition from kyphosis to lordosis, KLL –lumbar lordosis angle calculated as 180° – (ALPHA + BETA), GLL – depth of lumbar lordosis calculated between the transition from kyphosis to lordosis and apex of lordosis, KLB – angle of shoulder asymmetry. Differences between the means of the two groups were analysed with the use of Student’s t for independent samples. Additional analysis was limited measures with statistically significant differences at p < 0.05. As the variance in the compared groups could be considered homogenous (established with the Levene’s test), Student’s original t test with the assumption of equality of variance was used to compare the means. All calculations were performed with SPSS ver. 8.0 (IBM, USA). Table 1. Results of the photogrammetric assessment Measures ALPHA (°) BETA (°) GAMMA (°) GKP (mm) KLL (°) GLL (mm) KLB (°) 196
Study group
Control group
SD 19.42 9.02 24.61 19.11 180.58 –20.32 4.16
26.10 2.56 24.15 7.90 31.85 6.53 8.85
SD 31.37 4.10 29.39 2.92 193.40 –15.06 –1.65
27.03 5.77 22.48 9.58 38.95 35.47 8.79
ALPHA (°) 3.870 BETA (°) 0.622 GAMMA (°) 1.075 GKP (mm) 2.605 KLL (°) 11.849 GLL (mm) 2.325 KLB (°) 0.063
Independent t test of mean differences
p
t
df
p
0.052 0.433 0.303 0.110 0.001 0.131 0.802
–2.043 4.771 –0.940 8.269 –1.615 –0.877 3.001
83 83 83 83 83 83 83
0.044 0.000 0.350 0.000 0.110 0.383 0.004
Results The mean values of the analysed measures of posture are presented in Table 1. Statistically significant differences were found between the two groups were found for ALPHA and BETA, indicating that lumbarosacral (p = 0.044) and thoracolumbar (p = 0.000) spinal curvatures were significantly greater in the control group (Table 2). The posture of women involved in aerobic exercise showed significantly deeper thoracic kyphosis (p = 0.000) and greater shoulder asymmetry (p = 0.004). The remaining measures did not reveal any statistically significant differences. Discussion The results revealed an increased lumbosacral angle and decreased thoracolumbar angle in women who performed aerobic exercise. Moreover, the posture of these women showed greater shoulder asymmetry and deepened thoracic kyphosis. Aerobic exercise is usually conducted in groups. This might have an adverse effect on the quality of exercise and may have lead the participants to adopt poor or incorrect form. The incidence of deepened thoracic kyphosis may have resulted from assuming incorrect body posture or by overloading. The same may have led to the decrease in thoracolumbar spinal curvature. When compared with the control group, the deepened thoracic kyphosis accompanied with decreased BETA angle in the study group indicates kyphosis of the whole spine. Shoulder asymmetry could have resulted from strengthening exercises performed in these types of classes. Based on the available literature, no studies to date have assessed body posture in women who regularly perform aerobic exercise, making it very difficult to compare our results with the findings reported in other studies. However, the beneficial effects of other related forms of physical activity on the body and health have been thoroughly discussed. Cruz-Ferreira et al. [7] presented
HUMAN MOVEMENT J. Drzał-Grabiec, A. Truszczyńska, Body posture in women
the effects of Pilates exercises in women, finding an improvement in some of the postural alignment measures (frontal alignment of the shoulder and sagittal alignment of the head and pelvis). This group suggested that the significant improvement in the sagittal alignment of the head may imply that 6 months of Pilates-based exercise can enhance sagittal alignment of the cervical or thoracic spine. In turn, physical exercise, mainly in the form of resistance training, has led to increased muscle mass and also increased bone mineral density in postmenopausal women [8]. Physical activity has also been recommended as a form of rehabilitation for and in the prevention of low back pain [9]. Other studies determined that a high level of physical fitness is related to a decreased incidence of spine-related pain [10]. Other exercise-based interventions resulted in significant improvements in range of motion and body posture and significant decreases in low back pain. The functional ability of patients in everyday activities of life improved as well [11]. Several studies were conducted on the effects of various forms of dance in patients suffering from Parkinson’s disease, showing an increase in the quality of life of patients who did dance [12]. The relevant literature reveals a wide spectrum of beneficial effects resulting from physical activity both in healthy individuals and patients with health conditions. The need for additional research on the posture of individuals performing particular forms of physical activity appears to be necessary in order to determine recommendations for and against participation in certain sports and forms of physical activity. In light of the present study, a postural assessment of women who perform aerobic exercise including comparisons with a control group could help determine what types of body posture would or would not benefit from aerobics. Based on the results of the present study, particular attention should be paid to the prevention of exaggerated thoracic kyphosis and kyphosis of the whole spine. On this basis, the results indicate that aerobic exercise is suitable for individuals with decreased thoracic kyphosis whereas those with kyphosis or kyphoscoliosis should avoid this form of exercise. Instead, it is recommended that this population should be involved in individual training targeting particular disorders that, for example, involve relaxing and stretching exercises. Such exercises should be conducted in isolated and spine-relieving positions. Current research has shown that body posture correlates with spinal disc disorder, which confirms the importance of the issue studied herein [13] and also indicates the need for additional study on this issue. The results of the present study also point to the importance of monitoring body posture throughout the physical training process. This should be one of the responsibilities of aerobics instructors, where, apart from
explaining the aim and execution of a particular exercise, should also educate participants on the ergonomics of maintaining correct posture during training and provide exercises strengthening proper posture habits. Considering the limitations of the present study, it would be useful to broaden the scope of the study by incorporating individuals from different age groups as well as assess the effects of aerobic exercise on body posture pre- and post-intervention. Conclusions The results indicate statistically significant differences between the study and control groups, where women who regularly perform aerobic exercise present greater thoracic kyphosis and shoulder asymmetry than women not involved in aerobics References 1. Donath L., Roth R., Hohn Y., Zahner L., Faude O., The effects of Zumba training on cardiovascular and neuromuscular function in female college students. Eur J Sport Sci, 2014, 14 (6), 569–577, doi: 10.1080/17461391.2013.866168. 2. Prouty J., Fitness fact or fitness fad. ACSMS Health Fit J, 1999, 3 (6), 35, doi: 10.1249/00135124-199911000-00011. 3. Da Fonseca J.L., Magini M., de Freitas T.H., Laboratory gait analysis in patients with low back pain before and after Pilates intervention. J Sport Rehabil, 2009, 18 (2), 269–282. 4. Kluemper M., Uhl T.L., Hazelrigg H., Effect of stretching and strengthening shoulder muscles on forward shoulder posture in competitive swimmers. J Sport Rehabil, 2006, 15 (1), 58–70. 5. Sculco A.D., Paup D.C., Fernhall B., Sculco M.J., Effects of aerobic exercise on low back pain patients in treatment. Spine J, 2001, 1 (2), 95–101, doi: 10.1016/S15299430(01)00026-2. 6. Drzał-Grabiec J., Snela S., The influence of rural environment on body posture. Ann Agric Environ Med, 2012, 19 (4), 846–850. 7. Cruz-Ferreira A., Fernandes J., Kuo Y.L., Bernardo L.M., Fernandes O., Laranjo L. et al., Does pilates-based exercise improve postural alignment in adult women? Women Health, 2013,53(6),597–611,doi:10.1080/03630242.2013.817505. 8. Nelson M.E., Fiatarone M.A., Morganti C.M., Trice I., Greenberg R.A., Evans W.J., Effects of high-intensity strength training on multiple risk factors for osteoporotic fractures. A randomized controlled trial. JAMA, 1994, 272 (24), 1909–1914, doi: 10.1001/jama.1994.03520240037038. 9. Krismer M., van Tulder M., Strategies for prevention and management of musculoskeletal conditions. Low back pain (non-specific). Best Pract Res Clin Rheumatol, 2007, 21 (1), 77–91, doi: 10.1016/j.berh.2006.08.004. 10. Heneweer H., Picavet H.S., Staes F., Kiers H., Vanhees L., Physical fitness, rather than self-reported physical activities, is more strongly associated with low back pain: evidence from a working population. Eur Spine J, 2012, 21 (7), 1265–1272, doi: 10.1007/s00586-011-2097-7. 11. Dzierżanowski M., Dzierżanowski M., Maćkowiak P., Słomko W., Radzimińska A., Kaźmierczak U. et al., The in197
HUMAN MOVEMENT J. Drzał-Grabiec, A. Truszczyńska, Body posture in women
fluence of active exercise in low positions on the functional condition of the lumbar-sacral segment in patients with discopathy. Adv Clin Exp Med, 2013, 22 (3), 421–430, Available from: http://www.advances.am.wroc.pl/pdf/ 2013/22/3/421.pdf. 12. Batson G., Feasibility of an intensive trial of modern dance for adults with Parkinson Disease. J EvidenceBased Complement Altern Med, 2010, 15 (2), 65–83, doi: 10.1177/1533210110383903. 13. Lee P.J., Lee E.L., Hayes W.C., The ratio of thoracic to lumbar compression force is posture dependent. Ergonomics, 2013, 56 (5), 832–841, doi: 10.1080/00140139.2013.775354.
Paper received by the Editor: October 8, 2014 Paper accepted for publication: November 12, 2014 Correspondence address Aleksandra Truszczyńska Wydział Rehabilitacji Akademia Wychowania Fizycznego Józefa Piłsudskiego ul. Marymoncka 34 00-968 Warszawa, Poland e-mail:
[email protected]
198
HUMAN MOVEMENT 2014, vol. 15 (4), 199 – 203
Education and the prevention of postural defects
doi: 10.1515/humo-2015-0011
Agnieszka Olchowska-Kotala1 *, Krystyna Chromik 2 1 2
Wrocław Medical University, Wrocław, Poland University School of Physical Education, Wrocław, Poland
Abstract
Purpose. The aim of this study was to determine: whether and at what stage of education is proper body posture learned, the intention of young adults to participate in activities teaching proper posture, and the effects of factors related with the said intention. Methods. The study involved 430 university students aged 18–24 years. Anthropometric data was collected. Participants completed questionnaires assessing physical activity level (IPAQ) and their intention to participate in extracurricular activities teaching proper posture while sitting or walking, proper running technique, corrective gymnastics, or weight loss exercises. A self-assessment of posture, physical fitness, attractiveness, and body satisfaction was also completed. Results. Lower back pain was experienced by 41% of the respondents. Most were taught proper posture-related habits in primary school, followed by secondary school, and then at university. Many students expressed their intention to participate in the extracurricular activities. None of the questionnaire variables were associated with the intention to learn proper walking posture or proper running technique. The intention to participate in classes teaching proper sitting posture was associated with lower back pain in women and low physical activity level in men. In women, a relationship was found between the intention to participate in weight loss exercises and body dissatisfaction, high BMI, and poor self-evaluations of posture and attractiveness. In men, this activity was associated with body dissatisfaction. Conclusions. There is a need for further education on the development of proper postural habits at the university level. Key words: education, body posture, body satisfaction, BMI
Introduction Many studies are concerned with self care today. Their authors emphasize the need of increasing physical activity, paying attention to diet, and maintaining a healthy body weight in all age groups. More and more prevention programs have been introduced to encourage such healthy behavior. This is both due to real-life needs and the increasing recognition of the importance of lifestyle on health. Increased sedentary behavior has led to people spending large amounts time in a sitting position. Mechanical equipment, vehicles, and other forms of technology have made life easier at the cost of a lazier and less active population. It can be argued that life in the 21st century has begun to deviate from the evolutionary path set out for us by nature. Among the appeals for improved self care, more and more attention is being paid to the development of good posture. Incorrect posture in everyday activities of life contributes to back pain, especially in the lower back. Pain in the lumbar region of the spine is a serious problem in developed countries. It is estimated that between 60% and 80% of the population experiences lower back pain at some point in life [1]. To effectively combat this phenomenon, we need to be aware of the relationship between back pain and how everyday activities are per-
* Corresponding author.
formed. We need to know how to properly perform these activities and how to exercise and strengthen associated muscle groups based on adopted kinesitherapeutic principles. This also includes restoring joint mobility, if impaired. Although a number of educational programs addressing back pain and proper posture have been enacted in schools, they seem to be insufficient. Recent studies have indicated that an increasing number of children and adolescents experience back pain [2]. Interventions in childhood were found to be ineffective [3], hence the need for educating people on how to properly take care of their bodies even at later stages of life. Only such continuing education can consciously change healthrelated habits. The psychological models used to describe the behavioral changes needed to develop healthy habits often stress the concept of intention. Although several studies found that formulating intention does not ultimately lead to behavioral changes [4], it is still a crucial factor in taking action. Based on the above considerations, the aim of this study was to determine (1) whether and at what stage of education did the participants learn about proper sitting and walking posture and also proper running technique (2) whether young adults are willing to participate in extracurricular activities aimed at correcting posture in sitting, walking, or running or other healthrelated goals, and (3) what factors are associated with the intention to participate in the suggested extracurricular activities. 199
HUMAN MOVEMENT A. Olchowska-Kotala, K. Chromik, Education and the prevention of postural defects
Material and methods The study involved 430 environmental and life science university students aged 18–24 years (309 women and 121 men). Participation in the study was voluntary. Body height and mass were recorded. Participants completed the International Physical Activity Questionnaires (IPAQ), a questionnaire on their intention to participate in extracurricular activities associated with correcting posture and health, and a self-assessment on posture, physical fitness, body satisfaction, and attractiveness. The study was approved by the local ethics committee and conducted in October 2012 during the participants’ physical education classes in accordance with the Declaration of Helsinki. Anthropometric measurements were made in accordance with accepted procedures using calibrated equipment; measurement error was limited to 1%. Body mass was measured using a portable Seca 761 scale (Seca, Germany) with an accuracy of 0.1 kg. Body height was measured using a Posturometer S (Posmed, Poland) with an accuracy of 0.1 mm. During measurement the participants stood upright with their feet together and head in the Frankfort horizontal plane while unshod and dressed in gym clothes. Body mass index (BMI) was calculated by dividing body weight (kg) with body height (m²). BMI [5] was classified into four categories: underweight (< 18.5), normal (18.5–24.9), overweight (25–29.9), and obese (> 30). The Polish version of the IPAQ Short Form was administered [6]. All procedures delineated by the IPAQ scientific committee were followed. Physical activity was estimated based walking and moderate and intensive physical activity. Total energy cost and therefore the physical activity level (PA) of each respondent was calculated by multiplying exercise frequency and duration by its corresponding intensity to determine the Metabolic Equivalent of Tasks (MET), a metabolic measure corresponding to oxygen consumption at rest. The IPAQ describes PA in MET min/week; this value was used to distinguish three levels of intensity: low, moderate, and high. The participants were asked to indicate where (primary school, secondary school, university, at home) they were educated about proper sitting posture, proper walking posture, and proper running technique. Respondents were allowed to select more than one source. Intention to participate in extracurricular activities was assessed with the question, “Would you like to participate in extracurricular activities teaching: (a) proper sitting habits, (b) proper walking posture, (c) proper running technique, (d) corrective gymnastics, or (e) weight-loss exercises?” Respondents answered with a “yes” or “no”. Information on the incidence of low back pain within the past year was also collected by using a “yes” or “no” question. Respondents were asked to evaluate their body posture. Responses were ordered on a 7-point scale from 1 200
(very correct) to 7 (very incorrect). This included a selfassessment of body satisfaction, physical fitness, and attractiveness, where the responses were also scaled using a 7-point scale from 1 (very negative position) to 7 (very positive position). The 7 levels were then simplified into three response categories: “positive”, “I have no opinion”, and “negative”. The response “I have no opinion” was based on a response level 4 as the neutral option; the remaining response levels were accordingly grouped. Statistical analysis was performed with SPSS ver. 18 (PASW, USA). Descriptive statistics were calculated for all variables. The chi-square test was used to establish any relationships between the intention to participate in the extracurricular activities (on proper posture while sitting, walking, and running; corrective gymnastics; and weight loss) and the questionnaire variables. Analyses were performed separately for men and women. Statistical significance was set at p 0.05. Results As shown in Table 1, the majority of the participants fell within normal ranges. More were underweight than Table 1. Descriptive statistics characterizing the respondents (as mean ± SD and percent response) Women
Men
BMI Underweight Normal Overweight Obese
21.78 ± 13.89 16% 73% 7% 4%
23.60 ± 7.15 6% 65% 22% 7%
IPAQ PA Low Average High
3877 ± 3662 8% 45% 47%
5843 ± 4927 3% 23% 74%
Posture Positive I have no opinion Negative
3.98 ± 1.34 35% 26% 39%
3.88 ± 1.60 38% 18% 44%
Body satisfaction Positive I have no opinion Negative
4.51 ± 1.33 54% 25% 21%
5.14 ± 1.23 75% 16% 9%
Physical fitness Positive I have no opinion Negative
4.43 ± 1.29 49% 30% 21%
5.37 ± 1.16 82% 14% 4%
Attractiveness Positive I have no opinion Negative
4.51 ± 1.24 53% 28% 19%
5.06 ± 1.21 68% 25% 7%
HUMAN MOVEMENT A. Olchowska-Kotala, K. Chromik, Education and the prevention of postural defects
Table 2. Prevention of postural defects at different stages of education Stage of education Proper sitting posture
Primary school Secondary school University Home
87% 31% 14% 84%
Proper walking posture
Primary school Secondary school University Home
70% 22% 7% 75%
Proper running technique
Primary school Secondary school University Home
38% 33% 7% 20%
Corrective gymnastics
Primary school Secondary school University
57% 3% 2%
Table 3. Intention to participate in extracurricular activities Extracurricular activity Proper sitting posture Proper walking posture Proper running technique Corrective gymnastics Weight loss exercises
Women
Men
28% 39% 38% 35% 62%
20% 32% 39% 25% 28%
obese and overweight combined. Among men, the majority had BMI above 24.9 while only 6% were classified as underweight. The majority of the respondents indicated that they learned proper posture and running technique in primary school (87% – sitting posture, 70% – walking posture, 38% running technique; Table 2). This was then followed by secondary school (31% – sitting, 22% – walking, 33% – running technique) and then at university (14% – sitting, 7% – walking, 7% – running technique). Approximately 41% of the sample experienced low back pain. Corrective gymnastics classes had been attended by 2% of the respondents at the university level. Many of the respondents expressed their intention to participate in the suggested extracurricular activities (Table 3). However, none of the questionnaire variables were associated with the intention to participate in activities teaching proper walking posture or proper running technique (Tables 4 and 5). In women, a relationship between the intention to participate in classes on proper sitting posture and lower back pain was found. In men, the intention to participate in classes on proper sitting posture was associated with low PA. A relationship was found in women between the intention to participate in weight loss activities and high BMI and a low self-evaluation of body satisfaction, posture, and attractiveness. In men, the intention to participate in weight loss activities was associated only with body dissatisfaction. Analysis between the women and men on their intention to participate in the suggested extracurricular activities showed that significantly more women expressed their intention to take part in activities aimed
Table 4. Intention to participate in extracurricular activities among the female respondents (n = 309)
Sitting Walking Running Corrective gymnastics Weight loss *p
0.05, ** p
BMI ² df(3)
PA level ² df(2)
Posture ² df(6)
Back pain ² df(1)
Physical fitness ² df(6)
Attractiveness ² df(6)
0.633 3.048 0.168
6.858 5.504 0.480
8.626 5.785 2.389
4.449
5.192
21.853**
0.492
Body satisfaction ² df(6)
5.916* 3.163 1.952
4.945 4.250 7.779
6.095 2.808 4.617
2.131 3.839 10.343
17.874*
0.728
3.580
4.387
3.293
16.587*
0.216
7.413
15.387*
35.015**
0.001
Table 5. Intention to participate in extracurricular activities among the male respondents (n = 121)
Sitting Walking Running Corrective gymnastics Weight loss *p
BMI ² df(3)
PA ² df(2)
Posture ² df(6)
Back pain ² df(1)
Physical fitness ² df(5)
Attractiveness ² df(6)
Body satisfaction ² df(5)
6.146 2.488 2.224
4.116* 0.250 0.460
3.179 1.984 5.105
0.051 0.155 0.781
6.059 2.889 3.903
1.218 3.230 3.237
7.521 6.000 7.724
10.757*
1.038
2.931
0.130
7.838
7.124
5.805
5.340
1.187
6.730
0.130
7.282
3.565
13.334*
0.05 201
HUMAN MOVEMENT A. Olchowska-Kotala, K. Chromik, Education and the prevention of postural defects
at weight loss, ²(1, n = 424) = 40.563, p = 0.001. Slightly more women than men wanted to participate in the posture correction classes, ²(1, n = 423) = 3.395, p = 0.065. There were no differences between the men and women in the intention to participate in the remaining extracurricular activities. Discussion Although a majority of the respondents, both female and male, were found to have normal BMI and aboveguideline PA [7], 41% declared they felt lower back pain. Acute pain in the lumbar spine is very common [1], but considering that this result was found in a group of young individuals, 41% is a worrying number. This finding suggests the need for introducing interventions in this population. The present study examined the prevention of postural defects by considering various aspects that may determine healthy posture in sitting and walking, as these are the most frequently performed activities in the course of the day, and using proper running technique, an increasingly popular physical activity among young people. The collected data indicated that information imparting healthy postural habits was most commonly introduced in primary school. Many respondents also indicated their family home as a source of learning proper postural habits. Although proper posture should be established at an early school age [8], not all of the respondents indicated they acquired such knowledge during this period. Thus, due to the high health and economic costs of chronic low back pain [9], education on proper posture habits in everyday activities of life (and preventing spine-related pain) should be continual, from primary school to later educational stages as well as in the workplace [10]. Although not all of respondents declared being taught proper sitting and walking habits or correct running technique, this is not indicative that some schools lacked posturerelated programs. Such information is sometimes conveyed separately, interwoven in other school activities such as physical education classes. Another explanation for these results may also stem from the fact that the respondents did not remember being taught this subject or that not enough emphasis was placed during classes in the prevention of postural disorders. Not all of the respondents who negatively assessed their body posture wanted to participate in the extracurricular activities, such as corrective gymnastics classes. However, the predictors of the intention to participate in this extracurricular were poor self-assessed posture in women and being overweight in men. The results showed that slightly more women than men wanted to participate in corrective gymnastics. The results also suggested that the predictors of the intention to participate in activities on proper sitting posture were taking little physical activity in men and low back pain in women. Although many of the respondents expressed their in202
tention to participate in activities on proper walking posture and proper running technique, none of the analyzed variables were found to determine these intentions. Noteworthy is the fact that a large number of respondents wanted to participate in the suggested activities, indicative that young people do recognize the need to improve body image and work on correcting posture. The age range of this sample (university students) is a time when involvement in physical activity switches from habitual to intentional behavior [11]. Therefore, it would worthwhile to expand current university-level physical education classes and place emphasis on proper postural habits. One finding that was not surprising was that women were more willing to participate in weight-loss exercises. This has been confirmed in earlier studies, showing higher levels of body dissatisfaction in women than men [12, 13] and is a reflection of the social pressure to be slim [14]. Previous studies have indicated that body mass is a significant contributing factor not only to women’s body image [15] but also self-esteem [16]. The results of our study indicated that the intention to participate in the suggested posture- and health-related activities among women was higher in those with greater BMI and body dissatisfaction and with a lower opinion of one’s attractiveness or posture. Among men, the intention to participate in weight-loss exercises was not associated with BMI but instead body dissatisfaction. The lack of a relationship between the intention to participate in weight-loss exercises and BMI reveals that not all men with above normal BMI wish to participate in such activities. In turn, the number of women who declared their intention to perform weight-loss exercise was much higher than the number of women that who would warrant such exercise as based on their BMI. Nonetheless, the differences between the sexes indicate the need for separate prevention models. In men, this should involve building awareness on maintaining a normal weight to height ratio. Interventions aimed at women should instead concentrate on correcting weight-related misconceptions and introduce psychological skills increasing body satisfaction levels. The present study has a number of limitations that require addressing. First, it is subject to self-evaluation and recall biases, where respondents may have consciously or unconsciously misreported data. The potential errors of these methods are well-known [17]. Second, the study was correlational in nature, limiting the drawing of any cause-and-effect conclusions. Conclusions Based on the fact that a significant number of the respondents experienced low back pain and declared their intention to participate in extracurricular postureand weight-related activities, additional educational interventions at all levels of education are needed to prevent the onset of postural disorders. These conclusions,
HUMAN MOVEMENT A. Olchowska-Kotala, K. Chromik, Education and the prevention of postural defects
similar to those presented elsewhere [18, 19], point to the need for a multi-disciplinary intervention involving physical education teachers and therapists and include the development of posture-related knowledge, beliefs, and habits and include well-thought-out and planned physical activity. References 1. Anderson L., Educational approaches to management of low back pain. Orthop Nurs, 1989, 8 (1), 43–46 2. Calvo-Muñoz I., Gómez-Conesa A., Sánchez-Meca J., Prevalence of low back pain in children and adolescents: a meta-analysis. BMC Pediatrics, 2013, 13, 14, doi: 10.1186/1471-2431-13-14. 3. Dolphens M., Cagnie B., Danneels L., De Clercq D., De Bourdeaudhuij I., Cardon G., Long-term effectiveness of a back education program in elementary schoolchildren: an 8-year follow-up study. Eur Spine J, 2011, 20 (12), 2134–2142, doi: 10.1007/s00586-011-1856-9. 4. Webb T.L., Sheeran P., Luszczynska A., Planning to break unwanted habits: habit strength moderates implementation intention effects on behavior change. Br J Soc Psychol, 2009, 48 (3), 507–523, doi: 10.1348/014466608X370591. 5. WHO, Obesity: Preventing and managing the global epidemic. Report of a WHO consultation World Health Organization Technical Report Series 2001/03/10 ed. WHO, Geneva 2000, 894, 1–253. 6. Biernat E., Stupnicki R., Gajewski A.K., Międzynarodowy Kwestionariusz Aktywności Fizycznej (IPAQ) – Polish version. Wychowanie Fizyczne i Sport, 2007, 51 (1), 47–54. 7. Haskell W.L., Lee I.M., Pate R.R., Powell K.E., Blair S.N., Franklin B.A. et al., Physical activity and public health: updated recommendation for adults from the American College of Sports Medicine and the American Heart Association. Circulation, 2007, 116 (9), 1081–1093, doi: 10.1161/CIRCULATIONAHA.107.185649. 8. Jones G.T., Macfarlane G.J., Predicting persistent low back pain in schoolchildren: a prospective cohort study. Arthritis Rheum, 2009, 61 (10), 1359–1366, doi: 10.1002/ art.24696. 9. Andersson G.B.J., Epidemiological features of chronic low-back pain. Lancet, 1999, 354 (9178), 581–585. 10. Burton A.K., Balague F., Cardon G., Eriksen H.R., Henrotin Y., Lahad A. et al., How to prevent low back pain.
Best Pract Res Clin Rheumatol, 2005, 19 (4), 541–555, doi: 10.1016/j.berh.2005.03.001. 11. Wood W., Tam L., Witt M.G., Changing circumstances, disrupting habits. J Pers Soc Psychol, 2005, 88 (6), 918–933, doi: 10.1037/0022-3514.88.6.918. 12. Ogden J., Mundray K., The effect of the media o body satisfaction: the role of gender and size. Eur Eat Disord Rev, 1996, 4 (3), 171–182, doi: 10.1002/(SICI)10990968(199609)4:33.0.CO;2-U. 13. Olmsted M.P., McFarlane T., Body weight and body image. BMC Women’s Health, 2004, (Suppl 1), S5, doi: 10.1186/14726874-4-S1-S5. 14. Monteath S.A., McCabe M.P., The influence of societal factors on female body image. J Soc Psychol, 1997, 137 (6), 708–727, doi: 10.1080/00224549709595493. 15. Algars M., Santtila P., Varjonen M., Witting K., Johansson A., Jern P. et al., The adult body: How age, gender, and body mass index are related to body image. J Aging Health, 2009, 21 (8), 1112–1132, doi: 10.1177/0898264309348023. 16. Biro F.M., Striegel-Moore R.H., Franko D.L., Padgett J., Bean J.A., Self-esteem in adolescent females. J Adolesc Health, 2006, 39 (4), 501–507, doi:10.1016/j.jadohealth.2006.03.010. 17. Maughan B., Rutter M., Retrospective reporting of childhood adversity: Issues in assessing long-term recall. J Pers Disord, 1997, 11 (1), 19–33. 18. Wand B.M., Bird C., McAuley J.H., Dore C.J., MacDowell M., De Souza L.H., Early intervention for the management of acute low back pain: a single-blind randomized controlled trial of biopsychosocial education, manual therapy, and exercise. Spine, 2004, 29 (21), 2350–2356. 19. Mendez F.J., Gomez-Conesa A., Postural Hygiene Program to Prevent Low Back Pain. Spine, 2001, 26 (11), 1280–1286.
Paper received by the Editor: May 27, 2014 Paper accepted for publication: June 9, 2014 Correspondence address Agnieszka Olchowska-Kotala Zakład Humanistycznych Nauk Lekarskich Uniwersytet Medyczny we Wrocławiu ul. Mikulicza-Radeckiego 7 50-367 Wrocław, Poland e-mail:
[email protected]
203
HUMAN MOVEMENT 2014, vol. 15 (4), 204– 208
The effects of rule changes on basketball game results in the Men’s European Basketball Championships doi: 10.1515/humo-2015-0012
Beata Pluta1 *, Marcin Andrzejewski 1, Jarosław Lira 2 1 2
Faculty of Tourism and Recreation, University School of Physical Education, Poznań, Poland Department of Finance and Accounting, University of Environmental and Life Sciences, Poznań, Poland
Abstract
Purpose. The aim the study was to analyze the effects of rule changes in men’s professional basketball. Univariate analysis examined game statistics, concentrating only on points scores from selected basketball games and did not include situational variables that may have affected game dynamics. Methods. Data on the results of all games played in the men’s European Basketball Championships between 1935 and 2013 were collected and subjected to statistical analysis. Six main rule modifications which directly affected game play were identified in chronological order. Results. The number of points scored and allowed changed significantly after 1956. The greatest changes in game scores as a result of rule modifications were after rule changes in 1956 and after 1984. Conclusions. Rule changes involve processes that modify game conditions and should be validated following reflective analysis. Key words: basketball, rules of the game, sports championships, statistical analysis
Introduction Along with the increased popularity of basketball, multiple adjustments have been introduced to the organizational framework of the game by international sports organizations [1–3]. Since 1892, the rules of basketball have undergone many fundamental changes, steps which have led to changes in playing dynamics. Arias et al. [4] has proposed two types of basic sport rules. The first type of rules refer to internal logic and define the criteria that mark the relationships between a player and the rest of the team, time, spatial boundaries, and game equipment. The second are based on external logic and constitute the criteria that are nonessential to game play including the nature of a sporting event, the scoring system, team differentiators, or playing seasons. Although these elements are not directly intertwined with game ‘actions’, they can nonetheless affect game dynamics. When considering team sports played at the competitive level, key elements include the specific methodology of how a score is calculated, the official rules and regulations determining the principles of competition, and the procedures behind team qualification, promotion, or elimination. Competitive success is translated by the standing of teams according to their scores. Tables containing comparative data on various sports results are common in professional sports, where the main purpose of such statistics is to summarize a competitive season, sports event, the achievements of individual players, or to provide various comparative analyses in a given time
* Corresponding author. 204
and space. A sports result in a team sport is measured directly by the points scored and lost in a game according to the formula ST
{(SE1sr1) (SE2 sr2)}
so
where: ST – sports team, SEj – a given sports event, Srj – score at the sports event, and so – standing after the sports event. When considering a team sport such as basketball, history shows that a number of rule modifications have been introduced. The six ‘basketball paradigms’ having the most direct impact on game play are, (1) by 1915 a) standardizing the usage of backboards and metal hoops with bottomless nets, b) setting the free-throw line 4.5 m from the backboard, c) allowing only five players from each team to be on the court at one time, d) ejecting a player after committing four fouls, e) awarding a successful shot from the court with two points, and f) replacing the soccer ball with a special purpose-built basketball; (2) by the 1956 Melbourne Olympic Games a) the game was expanded by introducing the 3-s rule and the 30-s shot clock after gaining possession of the ball; (3) by 1984 a) introducing the three-point shot from behind a 6.25 m line, b) enlarging the basketball court, c) modifying of the 5- and 30-s rules, d) having seven team fouls in a quarter result in a ‘one-and-one’ free throw; (4) by 1994 a) having basketball matches divided into two 20-min halves or four 12-min quarters, b) introducing two free throws after seven team fouls in one half of a game; (5) by 2000 a) dividing a basketball game into four 10-min quarters, b) introducing two free throws after four team fouls are committed in a quarter, c) shortening the requirement for a team to advance the ball over the center line within
HUMAN MOVEMENT B. Pluta, M. Andrzejewski, J. Lira, Modified rules in basketball
10 s of ball possession to 8 s, d) reducing the weight of the official basketball for women; and (6) since 2010 a) moving the three-point line back to 6.75 m, b) changing the shape of the key from a trapezoid to a rectangle, c) introducing the restricted area arc with a marginally wider radius of 1.25 m, d) modifying the 24-s rule, e) introducing stricter penalties for flagrant fouls, especially for unsportsmanlike behavior; f) relaxing restrictions on traveling and illegally returning the ball to the back of the court. The aim of the present study was to analyze the effects of the above rule modifications on point scoring in basketball and explore any developmental tendencies. To the authors’ knowledge, no studies from the sphere of team sports theory, especially on basketball, have attempted to directly assess the impact of rule modifications on scores. Such enquiry could serve as a basis for understanding the future evolution of game outcomes. Due to its long history (78 years), it was decided to focus on the Men’s European Basketball Championships. Given the aim of the study, the following research questions were posed: 1. How has the structure of point scoring in men’s professional basketball developed over the examined period? 2. Which of the changes in the rules of basketball (the six chronological ‘paradigms’) influenced the evolution of scoring to the greatest extent? Material and methods The study analyzed the game results from 38 Men’s European Basketball Championships from 1935 to 2013, i.e. beginning with the first championship in Switzerland to the most recent event held in Slovenia. Data were obtained directly from the FIBA Europe website [5] and from Ströher [2]. The study protocol was approved by
the ethics committee of the Poznań University of Physical Education and conducted according to the Declaration of Helsinki. Statistical analysis involved a summary description of all data using basic statistical methods (measures of location, spread, and shape). The arithmetic means, medians, interquartile ranges, and standard deviations were calculated for the number of points scored (PS) and points allowed (PA). Significant differences between the mean ranks for PS and PA were grouped for each rule paradigm (Rule Changes 1–6) using the Kruskal–Wallis test (as a nonparametric alternative to one-way ANOVA) to allow for multiple comparisons. All statistical procedures were performed using Statistica 9.1. software (Statsoft, USA) with the significance level set at p < 0.05. Results Table 1 presents the data for all 45 national teams who had participated in the 38 European Basketball Championships, including those from currently defunct states. It is worth noting that 11 national teams participated in more than half of the European Championships. Altogether only 34 national teams advanced to qualify in the European Championships, this decrease had no effect on the standings of the top five teams. Moreover, after the division of the basketball games into halves and quarters, the ranking leaders remained the same: Spain, France, Russia (divided into quarters – 16 teams) and Italy, Yugoslavia, Czechoslovakia (divided into halves – 30 teams). These data illustrate that the performance level of European national basketball teams remained relatively fixed over the studied timeframe. Table 2 presents the basic descriptive statistics for points scored and allowed in all the basketball matches played in the European Basketball Championships.
Table 1. Participation of national teams in the Men’s European Basketball Championships (1935–2013) No.
Nat. team
n
%
No.
Nat. team
n
%
No.
Nat. team
n
%
1 2 3 4 5 6 7 8 9 10 11 12 13 14 15
France Italy Spain Czechoslovakia Poland Israel Yugoslavia Bulgaria Greece Turkey USSR Romania Hungary Belgium Finland
36 35 29 27 27 27 26 24 24 22 21 17 15 14 14
94.7 92.1 76.3 71.1 71.1 71.1 68.4 63.2 63.2 57.9 55.3 44.7 39.5 36.8 36.8
16 17 18 19 20 21 22 23 24 25 26 27 28 29 30
Netherlands Lithuania Latvia Federal Republic of Germany Russia Croatia Slovenia Sweden Germany Bosnia and Herzegovina Austria Ukraine Switzerland German Democratic Republic England
13 12 12 12 11 11 11 11 10 8 6 6 5 5 5
34.2 31.6 31.6 31.6 28.9 28.9 28.9 28,9 26.3 21.1 15.8 15.8 13.2 13.2 13.2
31 32 33 34 35 36 37 38 39 40 41 42 43 44 45
Egypt Estonia Serbia Macedonia Luxembourg Great Britain Serbia and Montenegro Libya Albania Portugal Georgia Montenegro Syria Scotland Iran
4 4 4 4 3 3 2 2 2 2 2 2 1 1 1
10.5 10.5 10.5 10.5 7.9 7.9 5.3 5.3 5.3 5.3 5.3 5.3 2.6 2.6 2.6 205
HUMAN MOVEMENT B. Pluta, M. Andrzejewski, J. Lira, Modified rules in basketball
Table 2. Descriptive statistics for points scored (PS) and points allowed (PA) Total Number of measurements Minimum Lower quartile Marginal median Arithmetic mean Upper quartile Maximum Standard deviation Coefficient of variation (%)
PS
PA
3720 0 67.0 71.0 69.9 83.0 140 20.01 28.62
3720 0 67.0 71.0 69.9 83.0 140 20.02 28.64
The results were calculated for a maximum of 11 consecutive European Championship games. Only in one case, the 2011 European Championships, did the Spanish national team play twelve consecutive tournament matches. A detailed comparison of points scored (PS) and points allowed (PA) in the individual championship games showed that the vast majority of the statistical values favored comparisons made between games divided into quarters. This applied mainly to the arithmetic mean, marginal median, standard deviation, and coefficient of variation. The minimum number of PS and PA in all analyzed championship games was 0 points in the 1937 Championships between Latvia – Egypt (2:0) and Czechoslovakia – Egypt (2:0). The maximum number of PS and PA was 140 points in the 1955 Championships between Poland – England (140:44). The variability in points scored and lost in all examined games was average (below 30%).
There was a noticeable dispersion of PS and PA before the introduction of the rules encompassed in Change 1. Variance between PS and PA can be observed after the introduction of Change 1. After the rules were modified as per Change 2, the number of points (PS and PA) reached similar levels. PS and PA approached values similar to the median after the introduction of Change 4 and subsequent rule modifications. The Kruskal–Wallis test revealed statistically significant differences between the successive rule changes. Multiple comparisons analysis showed no differences between Changes 2 and 4, 2 and 6, 4 and 5, and 5 and 6. Statistically significant differences were observed between Change 2 and Change 3 and Change 3 and Change 4 with respect to PS in most of the championship games. These results highlight the effects of introducing the threepoint shot and time restrictions on offensive play. Similar results were obtained for PA. No statistically significant differences were observed between Changes 2 and 4, 2 and 6, 4 and 5, and 4 and 6 (Table 3 and 4). Only the differences between Change 3 and Change 2 were statistically significant in the majority of the championship games. A similar relationship was found between Change 3 and 4. No differences between PS and PA were found in any of the rule modifications (Rule Changes 1–6). Discussion The rules of basketball refer to both internal logic and external logic. Rules of internal logic may be structural or functional. Structural rules are static and determine the quantitative aspects of game space, time,
Table 3. Multiple comparisons; p values for points scored (PS)
Change 1 Change 2 Change 3 Change 4 Change 5 Change 6
Change 1
Change 2
R:935,11
R:1952,1 0.000
0.000 0.000 0.000 0.000 0.000
0.000 0.084 0.009 1.000
Change 3
Change 4
Change 5
Change 6
R:2802,8
R:2130,3
R:2148,2
R:2079,5
0.000 0.000
0.000 0.084 0.000
0.000 0.009 0.000 1.000
0.000 1.000 0.000 1.000 1.000
0.000 0.000 0.000
1.000 1.000
1.000
Table 4. Multiple comparisons; p values for points allowed (PA)
Change 1 Change 2 Change 3 Change 4 Change 5 Change 6 206
Change 1
Change 2
Change 3
Change 4
Change 5
Change 6
R:935,93
R:1952,5
R:2806,9
R:2128,6
R:2144,6
R:2075,8
0.000
0.000 0.000
0.000 0.093 0.000
0.000 0.012 0.000 1.000
0.000 1.000 0.000 1.000 1.000
0.000 0.000 0.000 0.000 0.000
0.000 0.093 0.012 1.000
0.000 0.000 0.000
1.000 1.000
1.000
HUMAN MOVEMENT B. Pluta, M. Andrzejewski, J. Lira, Modified rules in basketball
equipment, and the number of players necessary for game play. Functional rules are qualitative in nature and determine the form and use of structural elements and indicate obligations, rights, and prohibitions concerning space, time, equipment, and relationships with other players. One example of a structural rule in basketball would be how many players per team can be found in a given area at the same time, whereas a functional rule would determine what form of body contact is permitted between players and, if exceeded, what penalties apply. Although the internal logic of a sport is not explained exclusively by its rules, they should define all the conditions necessary to play the game while allowing for certain freedom in athlete behavior. This variation, along with the inherent complexity of all the variables that can affect game play, makes it difficult to determine the exact implications of rule changes [4]. Most studies researching the dynamics of basketball usually are based on a singular analysis of competitive results [6–8]. Researchers analyzing basketball statistics can be divided into two groups. The first deals with indicators describing situational efficiency whereas the second uses various methods to assess basketball players during game play. Most of the assessment procedures use simple, one-factor models that do not consider the relationships between numerous causal variables influencing the dependent variable (the score. Earlier studies on elite basketball by Gómez et al. [9], Durković et al. [10], Ibáñez et al. [11], Karipidis et al. [12], Pojskić et al. [13], Šeparović and Nuhanović [14, 15], Trninić et al. [3] attempted to determine which gamerelated statistical parameters best discriminated winning and losing basketball teams. Other studies searched for correlations between various game-related parameters and the win–loss record. Melnick [16] analyzed five NBA seasons to determine a relationship between team assists and team success. However, there have been very few studies on the effects of rule modifications and game outcomes. This is important as objective data are required to determine if certain game rules ought to be changed [17–21]. Rule changes directly affecting game outcomes in top-level basketball constitute an immensely complicated process determined by multiple factors. The identification, verification, and understanding of these factors is indispensable for coaching purposes and requires the application of complex analytical research methods [9, 11, 12, 15, 22, 23]. Performance analyses in basketball is a fundamental tool for coaches, allowing them to obtain valid and reliable information on their team and competitors. This information can be used to not only identify the most valuable players but also determine the importance of specific roles as well as evaluate the performance of starting players and substitutes [24, 25]. Such analysis can determine how each player contributes to team performance [26] as well as assess the impact of rule changes on game results [27].
The aim of the present study was to determine the effects of rule changes on scoring by examining the results in the European Basketball Championships over the last decades. Rule changes modify the game conditions with a certain goal in mind. For example, in 2000 the International Basketball Federation (FIBA) changed the rules of basketball in Europe to speed up offensive play with hopes of increasing viewership and attracting more sponsors. This was performed by reducing backcourt time from 10 to 8 s and the shot clock from 30 to 24 s. These changes in combination with the continuous improvement of defensive tactics significantly altered offensive play. However, the results of the present study show that successive changes in official rules have not always had a direct impact on sports outcomes. The number of points scores and points allowed changed significantly as a consequence of such modifications starting from 1956. The largest effect on the pace of a basketball game, and indirectly on the number of scored points, was a decrease in shot time and rules on advancing the ball over the center line. The greatest changes in game scores were noted following the introduction of Changes 2 and 3. In particular, Change 3 decidedly increased the number of scored and allowed points in the matches under study. Similar observations were also made by Gomez et al. [27] and Ibáñez et al. [11]. This suggests a quickened game pace [28] and indicative of better physical parameters permitting more intensive defensive play, more physical contact, and game play based on defensive rebounds to gain ball possession and the use of fouls to block offensive. Therefore, it is possible to distinguish two explanations for rule changes in basketball. The first is the need to modify the accepted threshold of poor sporting behavior. The second is the need to modify game dynamics and motor demands, allowing the game to improve over time. Such changes help smooth out game play and facilitate referring and resolve in-game contentions. Rule changes also help improve the game’s popularity among spectators. Future changes in basketball may involve increased time restrictions to enhance viewership by increased game dynamics. Other changes could include moving the three-point line by a few centimeters, requiring a greater development of player techniques and skills. Conclusions The present study is novel as no other studies in the literature have analyzed the effects of rule modifications in basketball on game results. Since the data set used in the study is relatively small, any conclusions can be considered arbitrary and demand additional examination. However, future research should concentrate on data originating from teams of a similar competitive level. 207
HUMAN MOVEMENT B. Pluta, M. Andrzejewski, J. Lira, Modified rules in basketball
References 1. Shaper R., History of the Rules. International Basketball. Special Issue. Magazin of AIPS Basketball Commission and FIBA, 1982, 2, 48–49. 2. Ströher M., Basketball: The rules: 1931–2000 including the very first playing rules from 1891. International Basketball Federation, München 2001. 3. Trninić S., Dizdar D., Lukšić E., Differences between winning and defeated top quality basketball teams in final tournaments of European club championship. Coll Antropol, 2002, 26 (2), 521–531. 4. Arias J.L., Argudo F.M., Alonso J.I., Review of rule modification in sport. J Sports Sci Med, 2011, 10 (1), 1–8. 5. Available from http://www.fiba.com 6. Simović S., Komić J., Analysis of influence of certain elements of basketball game on final result based on differetiant at the XIII, XIV and XV World Championship. Acta Kinesiol, 2008, 2, 57–65. 7. Kreivytė R., Čižauskas A., Differences of indicators in competitive performance between winning and losing teams in basketball. Ugdymas, Kûno Kultûra, Sportas, 2010, 2 (77), 41–48. 8. Maroti S., Study on three-point shots scored by teams ranked in the 1st–4th places in the Women Olympic Basketball Tournament, Beijing 2008. Palestrica Mileniului III – Civilizaţie şi Sport, 2010, 11 (2), 144–147. 9. Gómez M.A., Lorenzo A., Sampaio J., Ibáñez S.J., Ortega E., Game-related statistics that discriminated winning and losing teams from the Spanish men’s professional basketball teams. Coll Antropol, 2008, 32 (2), 451–456. 10. Durkovic T., Gjergja D., Marelic N., Antekolovic L., Resetar T., The analysis of two groups of basketball teams based on the situational parameters of the game. In: Milanovic D., Prot F. (eds.), 4th International Scientific Conference on Kinesiology, Proceeding Book – Science and Profession – Challenge for the Future, Opatija 2005, 466–469. 11. Ibáñez S.J., Sampaio J., Feu S., Lorenzo A., Gomez M.A., Ortega E., Basketball game-related statistics that discriminate between teams’ season-long success. Eur J Sport Sci, 2008, 8 (6), 369–372, doi: 10.1080/17461390802261470. 12. Karipidis A., Fotinakis P., Taxildaris K., Fatouros J., Factors characterizing a successful performance in basketball. J Hum Mov Stud, 2001, 41 (5), 385–397. 13. Pojskić H., Šeparović V., Užičanin E., Differences between successful and unsuccessful basketball team on the final Olympic tournament. Acta Kinesiologica, 2009, 3 (2), 110–114. 14. Šeparović V., Nuhanović A., Latent structure of standard indicators of situational effectiveness in basketball in Bosnian league 6. Sport Scientific and Practical Aspects, 2008, 5 (1–2), 13–18. 15. Šeparović V., Nuhanović A., Nonstandard indicators of the offensive effectiveness in basketball and successfulness of basketball teams. Sport Sci, 2008, 1 (2), 7–11. 16. Melnick M.J., Relationship between team assists and winloss record in the National Basketball Association. Percept Mot Skills, 2001, 92 (2), 595–602, doi: 10.2466/ pms.2001.92.2.595. 17. Arias J.L., Argudo F.M., Alonso J.I., Effect of the 3-point line change on the game dynamics in girls’ minibasketball. Res Q Exerc Sport, 2009, 80 (3), 502–509, doi: 10.1080/02701367.2009.10599588.
208
18. Cormery B., Marcil M., Bouvard M., Rule change incidence on physiological characteristics of elite basketball players: a 10-year-period investigation. Br J Sports Med, 2008, 42 (1), 25–30, doi: 10.1136/bjsm.2006.033316. 19. Krauss M.D., Equipment innovations and rules changes in sports. Curr Sports Med Rep, 2004, 3 (5), 272–276, doi: 10.1249/00149619-200410000-00007. 20. Satern M.N., Messier S.P., Keller-McNulty S., The effects of ball size and basket height on the mechanics of the basketball free throw. J Hum Mov Stud, 1989, 16, 123–137. 21. Usabiaga O., Castellano J., A proposal to adapt game rules in scholastic sport. In: I Congreso de Deporte en Edad Escolar. Propuestas para un nuevo modelo. Ayuntamiento de Valencia, Fundación Deportiva Municipal, Valencia Spain 2005, 1–9. 22. Sampaio J., Lago C., Drinkwater E.J., Explanations for the United States of America’s dominance in basketball at the Beijing Olympic Games (2008). J Sports Sci, 2010, 28 (2), 147–152, doi: 10.1080/02640410903380486. 23. Robinson G., O’Donoghue P., A weighted kappa statistic for reliability testing in performance analysis of sport. Int J Perform Anal Sport, 2007, 7 (1), 12–19. 24. Sampaio J., Ibáñez S., Lorenzo A., Gomez M., Discriminative game related statistics between basketball starters and nonstarters when related to team quality and game outcome. Percept Mot Skills, 2006, 103 (2), 486–494, doi: 10.2466/pms.103.2.486-494. 25. Peterson D., Hruby G., The European Basketball Register – 1998 to 2013 Edition. Libreria Dello Sport, Jumpo & Julius Scouting, Milan 2013. 26. Sampaio J., Janeira M., Ibáñez S.J., Lorenzo A., Discriminant analysis of game related statistics between basketball guards, forwards and centres in three professional leagues. Eur J Sports Sci, 2006, 6 (3), 173–178, doi: 10.1080/17461390600676200. 27. Gómez M.A., Lorenzo A., Ortega E., Sampaio J., Ibáñez S.J., Game related statistics discriminating between starters and nonstarters players in Women’s National Basketball Associationleague (WNBA). J Sports Sci Med, 2009, 8 (2), 278–283. 28. Ortega E., Palao J.M., Gómez M.A., Lorenzo A., Cárdenas D., Analysis of the efficacy of possessions in boys’ 16-and-under basketball teams: Differences between winning and losing teams. Percept Mot Skills, 2007, 103, 961–964, doi: 10.2466/pms.104.3.961-964.
Paper received by the Editor: October 3, 2014 Paper accepted for publication: November 26, 2014 Correspondence address Beata Pluta Wydział Turystyki i Rekreacji Akademia Wychowania Fizycznego ul. Królowej Jadwigi 27/39 61-871 Poznań, Poland e-mail:
[email protected]
HUMAN MOVEMENT 2014, vol. 15 (4), 209 – 215
The effects of various running inclines on three-segment foot mechanics and plantar fascia strain doi: 10.1515/humo-2015-0013
Jonathan Sinclair*, Stephen Atkins, Hayley Vincent Division of Sport Exercise and Nutritional Sciences, University of Central Lancashire, Preston, United Kingdom
Abstract
Purpose. There has yet to be a combined analysis of three-dimensional multi-segment foot kinematics and plantar fascia strain in running gait at various degrees of inclination. The aim of the current study was therefore to investigate the above during treadmill running at different inclines (0°, 5°, 10° and 15°). Methods. Twelve male participants ran at 4.0 m · s–1 in the four different inclinations. Three-dimensional kinematics of the foot segments and plantar fascia strain were quantified for each incline and contrasted using one-way repeated measures ANOVA. Results and conclusions. The results showed that plantar fascia strain increased significantly as a function of running incline. Given the projected association between plantar fascia strain and the aetiology of injury, inclined running may be associated with a greater incidence of injury to the plantar fascia. Key words: running, incline, biomechanics
Introduction Recreational and competitive running has been linked to a significant number of clinical benefits [1]. However, aetiological analyses indicate that chronic injuries are extremely common in runners, with an occurrence rate of around 70% per year [2]. Both retrospective and prospective studies have explored the biomechanical mechanisms responsible for chronic running injuries [3–7]. Malalignment of the foot segments during the stance phase of running have been implicated in the aetiology of a number of chronic foot and ankle pathologies [8]. Excessive coronal and transverse plane motions of foot segments have been associated with the progression of various pathologies such as tibial stress syndrome and Achilles tendonitis [9]. In addition to this, atypical foot-segment mechanics are also linked to the aetiology of plantar fasciitis, which has been shown to affect in excess of 10% of runners [10]. The kinematics of incline running have been previously examined by those interested in the biomechanical study of human locomotion. Using an overground protocol, Roberts and Belliveau, [11] demonstrated progressive increases in hip joint moments and powers at inclines of 0°, 6° and 12°. It was proposed that this was due to a poorer mechanical advantage of this joint for producing force and that increases in hip mechanical work were necessary to provide propulsion in the latter part of the stance phase. Telhan et al. [12] demonstrated that no significant differences in three-dimensional (3-D) joint moments of the lower extremities were present when comparing a 4° incline to flat running using a treadmill protocol. Swanson and Caldwell [13] showed that * Corresponding author.
flexion of the lower extremity joints was greater at initial contact during inclined running. They also demonstrated that EMG amplitude of the gastrocnemius, soleus, rectus femoris, vastus lateralis and gluteus maximus muscles was greater while hamstring amplitudes were lower when running at a 30% gradient. Sinclair et al. [14] showed that both hip and knee flexion decreased linearly with running inclines. It was also demonstrated that peak tibial internal rotation was larger during flat running and proposed as being linked to the aetiology of injury. Running at an incline may be beneficial in that it induces a larger physiological response than flat running and mediates increased training adaptations [15]. Incline running forms a key component in both training and competition [15]. However, despite the frequent utilization of incline running training, there is no known research that has directly measured the effects of different treadmill inclines on 3-D multi-segment foot kinematics and plantar fascia strain during running. The aim of the current study was therefore to investigate the influence of treadmill running at various inclines (0°, 5°, 10° and 15°) on foot kinematics and plantar fascia strain during the stance phase of running. Material and methods Twelve male participants (age 25.33 ± 3.47 years, height 1.79 ± 0.11 m and body mass 75.22 ± 6.97 kg) volunteered to take part in the current investigation. All were free from musculoskeletal pathology at the time of data collection and provided informed consent. Ethics approval was obtained from the local University Ethics Committee and the procedures outlined in the Declaration of Helsinki were followed. Participants ran at 4.0 m · s–1 on a Woodway high-power treadmill (ELG, Germany) at four different gradients 0° 209
HUMAN MOVEMENT J. Sinclair, S. Atkins, H. Vincent, Effects of incline on running biomechanics
(flat), 5°, 10° and 15°. Five trials were recorded for each inclination without stopping the treadmill and the order in which the different gradients were undertaken was randomized. As force information was not available, the instances of footstrike and toe-off were determined using kinematic information. Footstrike was determined as the point at which the vertical velocity of the calcaneus marker changed from negative to positive and toe-off was delineated using the second instance of peak knee extension. The calibrated anatomical systems technique (CAST) procedure for modelling and tracking segments was followed [16]. Markers were placed on anatomical landmarks in accordance with the Leardini et al. [17] foot model protocol to define the anatomical frames of the rearfoot (Rear), midfoot (Mid) and forefoot (Fore). Markers were positioned on the medial and lateral femoral epicondyles to allow the anatomical frame of the tibia (Tib) to be delineated and a rigid tracking cluster was also positioned on the tibia. Participants wore the same footwear throughout (Pro Grid Guide II, Saucony, USA). Markers were digitized using Qualisys Track Manager (Qualisys Medical AB, Sweden) and exported to Visual 3D software (C-motion, USA). Retroreflective marker trajectories were filtered at 12 Hz using a zero-lag low-pass Butterworth filter. Euler angles were used to quantify 3-D rotations of the foot segments relative to one another. Stance phase angles were computed using an XYZ sequence of rotations between the rearfoot–tibia (Rear–Tib), midfoot–rearfoot (Mid–Rear), forefoot–midfoot (Fore–Mid) and forefoot–rearfoot (Fore–Rear). The medial longitudinal arch (MLA) angle was calculated in accordance with the protocol documented by Tome et al. [18] as the angle created by the lines from the calcaneus marker to the navicular tuberosity and from the first metatarsal to the navicular tuberosity. Discrete 3-D kinematic measures which were extracted for statistical analysis included 1) angle at footstrike, 2) angle at toe-off, 3) range of motion (ROM) from footstrike to toe-off during stance, 4) peak angle during stance and 5) relative ROM (representing the angular displacement from footstrike to peak angle). Plantar fascia strain was quantified by calculating the distance between the first metatarsal and calcaneus markers and quantified by the relative position
of the markers. Plantar fascia strain was then calculated as the change in length during the stance phase divided by the original length. Descriptive statistics (means and standard deviations) of the above measures were calculated for each incline condition. Differences in 3-D kinematic and plantar fascia strain parameters were examined using one-way repeated measures ANOVA with statistical significance accepted at p < 0.05 [19]. Post-hoc pairwise comparisons were conducted using a Bonferroni correction to control for type I error. Shapiro–Wilk tests were used to screen the data for normality, finding that the normality assumption was not violated. Effect sizes for all statistical main effects were calculated using partial eta2 (p 2). Statistical procedures were undertaken using SPSS ver. 21 (IBM, USA). Results The results indicate that whilst the multi-segment foot kinematic waveforms measured as a function of different inclines were quantitatively similar, significant differences were found between the various inclinations. Figures 1 and 2 present the 3-D multi-segment foot kinematics and MLA angles from the stance phase. Tables 1–5 present the results of the statistical analyses conducted on the measures of multi-segment foot kinematics. Plantar fascia strain and temporal parameters A significant main effect was shown for plantar fascia strain; F(3, 33) = 5.99, p < 0.05, p 2 = 0.40 (Table 1). Posthoc analysis showed that plantar fascia strain was significantly smaller in the flat condition compared with the 10° and 15° incline conditions. A significant main effect was found for stance duration; F(3, 33) = 6.68, p < 0.05, p 2 = 0.44. Post-hoc analysis showed that stance duration was longer in the flat condition compared with the 15° and 10° inclines. It was also shown that stance duration was longer in the 5° incline compared with 15°. A significant main effect was found for stride frequency; F(3, 33) = 7.02, p < 0.05, p 2 = 0.47. Post-hoc analysis showed that stride frequency was greater in the 15° incline compared with the flat condition.
Table 1. Plantar fascia strain and temporal parameters as a function of different inclines Stance time (ms) Stride frequency (Hz) Plantar fascia strain Peak MLA angle (°) MLA relative ROM (°) MLA ROM (°) 210
0° (flat)
5°
10°
15°
Mean
SD
Mean
SD
Mean
SD
Mean
SD
188.37 2.82 5.63 115.41 6.00 27.23
16.44 0.22 2.25 7.40 2.31 3.12
178.05 2.95 6.37 116.79 7.37 36.87
15.14 0.21 2.53 7.80 1.99 3.46
172.87 3.07 6.60 116.51 5.71 32.90
11.20 0.22 2.32 7.30 2.22 3.21
168.76 3.16 6.78 117.48 6.48 21.61
13.25 0.25 2.56 6.90 2.18 3.33
HUMAN MOVEMENT J. Sinclair, S. Atkins, H. Vincent, Effects of incline on running biomechanics
Table 2. Rearfoot–Tibia kinematics as a function of different inclines
0° (flat)
Mean
Sagittal plane Angle at footstrike Angle at toe−off Peak dorsiflexion ROM Relative ROM
5° Mean
SD
10° Mean
SD
15° Mean
SD
SD
1.33 −16.92 17.63 22.06 16.80
9.70 7.91 7.93 7.83 10.50
0.45 −19.47 16.43 20.93 18.65
8.84 9.57 7.07 8.37 12.36
−3.11 −20.47 15.54 18.13 15.98
13.67 10.24 6.19 6.51 7.01
−3.34 −20.69 13.46 13.58 16.31
10.61 8.96 5.64 5.28 7.33
Coronal plane Angle at footstrike Angle at toe−off Peak eversion ROM Relative ROM
2.93 2.82 −7.41 3.87 10.34
4.33 5.08 3.94 2.15 3.92
3.67 2.84 −7.54 4.38 11.21
5.84 4.89 4.24 3.99 5.59
2.21 2.92 −7.88 4.75 10.10
4.22 5.52 4.39 3.10 4.01
1.91 2.89 −7.98 5.47 9.89
4.51 4.96 4.44 3.12 4.16
Transverse plane Angle at footstrike Angle at toe−off Peak external rotation ROM Relative ROM
−1.15 2.11 −6.79 3.85 5.64
2.19 3.55 3.28 2.75 3.03
0.13 2.35 −6.62 4.27 6.75
4.65 3.87 3.73 3.00 4.63
−1.12 2.80 −6.90 4.33 5.79
3.78 3.98 4.97 3.00 4.70
−1.15 2.98 −6.71 4.67 5.57
4.05 3.40 4.81 3.82 5.36
Table 3. Midfoot−Rearfoot kinematics as a function of different inclines
0° (flat)
Mean
Sagittal plane Angle at footstrike Angle at toe−off Peak dorsiflexion ROM Relative ROM
5° Mean
SD
10° Mean
SD
15° Mean
SD
SD
1.80 −1.11 6.24 4.49 4.43
2.78 3.71 2.10 2.56 3.00
2.45 −1.86 6.88 4.54 4.43
4.49 4.57 4.46 2.36 2.22
2.09 −2.08 6.39 4.27 4.30
2.49 3.91 3.10 2.30 2.02
2.14 −2.38 6.87 5.01 4.73
2.68 5.00 3.64 2.55 2.18
Coronal plane Angle at footstrike Angle at toe−off Peak eversion ROM Relative ROM
−1.61 −2.19 −0.08 2.43 1.53
2.08 3.42 2.56 1.88 2.51
−3.40 −3.03 −0.95 3.37 2.45
4.40 3.65 2.53 4.16 4.56
−2.00 −2.65 −0.55 2.65 1.44
2.52 4.51 3.14 2.17 2.31
−1.93 −2.21 0.09 3.29 2.02
2.84 4.00 3.15 2.40 2.96
Transverse plane Angle at footstrike Angle at toe−off Peak external rotation ROM Relative ROM
1.46 2.23 −0.65 1.30 2.11
1.15 1.69 1.27 1.25 1.35
1.15 2.00 −0.67 1.34 1.81
1.41 1.93 1.25 1.05 0.84
1.10 1.91 −0.66 1.32 1.75
1.57 1.77 1.29 1.30 0.80
1.31 1.84 −0.68 0.95 1.99
1.86 1.73 1.34 0.61 0.88
Rearfoot–Tibia In the sagittal plane, the results showed a significant main effect for the angle at footstrike; F(3, 33) = 4.54, p < 0.05, p 2 = 0.30 (Table 2). Post-hoc pairwise comparisons showed that this angle was significantly more dorsiflexed in the flat and 5° conditions compared with the 10° and 15° conditions. The results also showed a sig-
nificant main effect for the peak dorsiflexion angle; F(3, 33) = 5.76, p < 0.05, p 2 = 0.3. Post-hoc pairwise comparisons showed that peak dorsiflexion was significantly greater in the flat and 5° conditions than at 15°. Finally, a significant main effect was found for sagittal plane ROM; F(3, 33) = 12.67, p < 0.05, p 2=0.54. Posthoc pairwise comparisons showed that peak dorsiflexion was significantly greater in the flat, 5° and 10° 211
HUMAN MOVEMENT J. Sinclair, S. Atkins, H. Vincent, Effects of incline on running biomechanics
Table 4. Forefoot−Midfoot kinematics as a function of different inclines
0° (flat)
Mean
Sagittal plane Angle at footstrike Angle at toe−off Peak dorsiflexion ROM Relative ROM
5° Mean
SD
4.48 13.51 19.32 11.50 14.83
Coronal plane Angle at footstrike Angle at toe−off Peak eversion ROM Relative ROM
0.11 1.61 2.27 1.83 2.16
Transverse plane Angle at footstrike Angle at toe−off Peak external rotation ROM Relative ROM
0.14 1.38 2.81 2.53 2.67
6.17 11.77 9.44 4.36 4.15
Mean
SD
5.17 14.23 20.68 9.06 15.51
7.56 8.62 10.61 3.55 5.08
1.28 2.12 2.14 1.26 1.54
10°
−0.64 0.85 1.52 1.68 2.16
0.28 0.58 2.31 1.38 2.03
8.81 9.67 10.59 2.53 3.69
0.98 1.70 1.82 1.29 1.58
1.74 1.89 1.98 0.89 1.50
SD
4.04 12.28 20.37 8.74 16.33
−0.12 0.94 1.72 1.40 1.84
−0.03 0.04 1.96 1.31 1.99
7.64 9.16 10.73 3.49 5.08
2.42 3.08 2.85 0.85 1.22
1.73 1.16 1.48 1.68 1.24
Mean
SD
3.93 12.35 20.33 8.70 16.40
−0.84 −0.22 0.61 1.26 1.45
15°
0.72 2.02 2.12 1.65 1.95
1.47 2.21 2.15 0.98 1.19
0.24 1.26 2.91 1.65 2.67
1.83 2.62 2.30 1.60 1.63
Table 5. Forefoot−Rearfoot kinematics as a function of different inclines
0° (flat)
Mean
Sagittal plane Angle at footstrike Angle at toe−off Peak dorsiflexion ROM Relative ROM
5° Mean
SD
10° Mean
SD
15° Mean
SD
SD
6.17 12.41 18.42 7.57 12.25
5.87 9.34 8.44 3.97 5.01
7.38 12.02 19.60 6.23 12.22
8.10 8.26 9.82 4.35 5.26
5.89 10.15 19.25 5.65 13.36
6.92 9.74 9.30 3.41 5.07
5.85 9.64 18.81 5.22 12.96
7.97 9.31 8.21 2.28 3.16
Coronal plane Angle at footstrike Angle at toe−off Peak eversion ROM Relative ROM
−1.11 −1.56 1.37 3.97 2.48
3.33 4.54 3.15 3.55 3.19
−2.50 −0.78 1.03 3.28 3.54
5.69 3.68 3.38 4.61 4.75
−1.58 −1.46 0.60 2.10 2.18
3.61 4.34 4.12 2.04 2.37
−1.37 −1.50 0.62 2.30 1.99
4.76 5.18 4.53 2.42 2.87
Transverse plane Angle at footstrike Angle at toe−off Peak external rotation ROM Relative ROM
1.23 2.41 −1.05 2.36 2.28
2.10 2.73 1.44 1.67 2.11
0.23 1.19 −2.05 2.18 2.28
3.19 4.07 3.11 1.16 1.68
0.70 2.02 −1.14 1.96 1.84
2.25 2.22 2.00 1.45 1.48
0.35 1.70 −1.16 1.66 1.51
2.00 2.00 1.99 0.70 1.27
conditions compared with 15°. In addition, ROM was shown to be significantly larger in the flat condition compared with 10°. Midfoot–Rearfoot No significant (p > 0.05) differences were observed (Table 3, Figure 1). 212
Forefoot–Midfoot No significant (p > 0.05) differences were observed (Table 4, Figure 1). Forefoot–Rearfoot No significant (p > 0.05) differences were observed (Table 5, Figure 1).
HUMAN MOVEMENT J. Sinclair, S. Atkins, H. Vincent, Effects of incline on running biomechanics
Figure 1. Multi-segment foot kinematics as a function of different inclines black – 0°, dash – 5°, grey – 10° and dot – 15°; DF – dorsiflexion, IN – inversion, INT – internal
MLA angle No significant (p > 0.05) differences were observed (Table 1, Figure 2). Discussion The current investigation, as the first study on this subject, analysed the influence of treadmill running at various inclines (flat, 5°, 10° and 15°) on three-segment foot kinematics and plantar fascia strain during the stance phase of running. The first key observation is that three-segment foot kinematics were shown to be significantly altered as a function of different running inclines. Specifically, it was shown that at footstrike the rearfoot exhibited significantly greater plantarflexion during the incline conditions. This concurs with the findings of Swanson and Caldwell [13] who also showed similar increases in plantarflexion during incline running. It is proposed that this observation relates to the increased stride frequencies noted in the incline running conditions. Increases in stride frequency are associated with reductions in step length, signifying that the ankle is required to plantarflex to a greater extent in order to reduce the linear distance from the foot to the centre of mass so as to maintain balance. This observation may also provide insight into the mechanism by which reductions in impact loading have been noted during incline running, as
black – 0°, dash – 5°, grey – 10° and dot – 15°
Figure 2. MLA angle as a function of different inclines
an increase in plantarflexion at footstrike have been shown to increase the duration of the impact phase in running [20, 21]. Another important observation from the current investigation is that plantar fascia strain was shown to be significantly greater with increased incline. This finding may be an important one regarding the aetiology of plantar fasciitis in runners. Plantar fasciitis itself is believed to be caused by excessive strain imposed on the plantar fascia [22]. The findings from this study may provide insight into the clinical differences between different running inclines and the susceptibility of runners to plantar fasciitis. On the basis that increases in plantar fascia strain were observed during incline running, the results from the current study provide evidence to support the utili213
HUMAN MOVEMENT J. Sinclair, S. Atkins, H. Vincent, Effects of incline on running biomechanics
zation of flat running for those susceptible to plantar fasci pathologies. These observations can be further contextualized by taking into account the observed increases in stride frequencies during the incline running conditions. Although increases in plantar fascia strain were shown for each individual step during inclined running, the amount of cumulative stress is likely to be further accentuated as the total number of required steps to achieve the same running velocity is greater. Thus, it can be concluded that the cumulative strain experienced by the plantar fascia during incline running conditions is likely to be considerably larger, placing runners at increased risk from plantar fascial pathologies. A potential drawback of this study is that foot mechanics were quantified using a treadmill. As overground running is still the most common running modality, the generalizability of the findings is limited. Because running mechanics have been shown to differ between treadmill and overground locomotion [23], future work should seek to repeat the present study using an overground running protocol. In addition, the positioning of the retroreflective markers onto the shoe may not have quantified movement of the foot within the shoe. The accuracy of this method has been questioned, where previous analyses have demonstrated that markers positioned onto the shoe may lead to errors particularly in the coronal and transverse planes [8, 24]. However, these investigations showed that cutting holes in experimental footwear compromised the structural integrity of the shoe and affected footwear perception. Hence, it was determined that in the context of the current investigation that such a technique is acceptable. Conclusions The present study provides new information on multisegment foot kinematics and plantar fascia strain at different running inclines. Of importance is that increased plantar fascia strain and alterations in the sagittal plane angles of rearfoot–tibial articulation were observed in the incline running conditions. Given the proposed relationship between high levels of plantar fascia strain and the aetiology of injury, it is likely that the potential risk of developing running injuries in relation to these mechanisms is higher during incline conditions. Acknowledgements Thanks go to Rob Graydon for his technical help and support throughout this work.
References 1. Hillman C.H., Erickson K.I., Kramer A.F., Be smart, exercise your heart: exercise effects on brain and cognition. Nat Rev Neurosci, 2008, 9 (1), 58–65, doi: 10.1038/nrn2298. 2. van Gent R.N., Siem D., van Middlekoop M., van Os AG., Bierma-Zeinstra S.M.A, Koes B.W., Incidence and determinants of lower extremity running injuries in long dis214
tance runners: a systematic review. Br J Sports Med, 2007, 41 (8), 469–480, doi: 10.1136/bjsm.2006.033548. 3. Taunton J.E., Ryan M.B., Clement D.B., McKenzie D.C., Lloyd-Smith D.R., Zumbo B.D., A retrospective case-control analysis of 2002 running injuries. Br J Sports Med, 2002, 36 (2), 95–101, doi:10.1136/bjsm.36.2.95. 4. Daoud A.I., Geissler G.J., Wang F., Saretsky J., Daoud Y.A., Lieberman, D.E. Foot strike and injury rates in endurance runners: a retrospective study. Med Sci Sports Exerc, 2012, 44 (7), 1325–1334, doi: 10.1249/MSS.0b013e3182465115. 5. Zifchock R.A., Davis I., Higginson J., McCaw S., Royer T., Side-to-side differences in overuse running injury susceptibility: a retrospective study. Hum Mov Sci, 2008, 27 (6), 888–902, doi: 10.1016/j.humov.2008.03.007. 6. Taunton J.E., Ryan M.B., Clement D.B., McKenzie D.C., Lloyd-Smith D.R., Zumbo B.D., A prospective study of running injuries: the Vancouver Sun Run “In Training” clinics. Br J Sports Med, 2003, 37 (3), 239–244, doi: 10.1136/bjsm.37.3.239. 7. Nielsen R.O., Buist I., Parner E.T., Nohr E.A., Sørensen H., Lind M. et al., Predictors of Running-Related Injuries Among 930 Novice Runners A 1-Year Prospective Followup Study. Orthop J Sports Med, 2013, 1 (1), doi: 10.1177/2325967113487316. 8. Sinclair J., Taylor P.J., Hebron J., Chockalingam N., Differences in multi-segment foot kinematics measured using skin and shoe mounted markers. Foot & Ankle Online Journal, 2014, 7 (2), doi: 10.3827/faoj.2014.0702.0007. 9. Eslami M., Begon M., Farahpour N., Allard P., Forefootrearfoot coupling patterns and tibial internal rotation during stance phase of barefoot versus shod running. Clin Biomech, 2007, 22 (1), 74–80, doi: 10.1016/j.clinbiomech. 2006.08.002. 10. Lareau C.R., Sawyer G.A., Wang J.H., DiGiovanni C.W., Plantar and Medial Heel Pain: Diagnosis and Management. J Am Acad Orthop Sur, 2014, 22 (6), 372–380, doi: 10.5435/JAAOS-22-06-372. 11. Roberts T.J, Belliveau R.A., Sources of mechanical power for uphill running in humans. J Exp Biol, 2005, 208 (10), 1963–1970, doi: 10.1242/jeb.01555. 12. Telhan G., Franz J.R., Dicharry J., Wilder R.P., Riley P.O., Kerrigan D.C., Lower limb joint kinetics during moderately sloped running. J Ath Train, 2010, 45 (1), 16–21, doi: 10.4085/1062-6050-45.1.16. 13. Swanson S.C., Caldwell G.E. An integrated biomechanical analysis of high speed incline and level treadmill running. Med Sci Sports Exerc, 2000, 32 (6), 1146–1155. 14. Sinclair J., Greenhalgh A., Taylor P.J., Bentley I., Varying degrees of running incline: Implications for chronic injury aetiology and rehabilitation. Comp Exerc Phys, 2014, 10 (4), 207–214, doi: 10.3920/CEP140016. 15. Padulo J., Powell D., Milia R., Ardigò L.P., A Paradigm of Uphill Running. PloS One, 2013, 8 (7), 1–8, doi:10.1371/ journal.pone.0069006. 16. Cappozzo A., Catani F., Della Croce U., Leardini A., Position and orientation in space of bones during movement: anatomical frame definition and determination. Clin Biomech, 1995, 10 (4), 171–178, doi: 10.1016/02680033(95)91394-T. 17. Leardini A., Benedetti M.G., Berti L., Bettinelli D., Nativo R., Giannini S., Rear-foot, mid-foot and fore-foot motion during the stance phase of gait. Gait Posture, 2007, 25 (3), 453–462, doi: 10.1016/j.gaitpost.2006.05.017.
HUMAN MOVEMENT J. Sinclair, S. Atkins, H. Vincent, Effects of incline on running biomechanics
18. Tome J., Nawoczenski D.A., Flemister A., Houck J., Comparison of foot kinematics between subjectss with posterior tibialis tendon dysfunction and healthy controls. J Orthop Sports Phys Ther, 2006, 36 (9), 635–644, doi: 10.2519/jospt.2006.229. 19. Sinclair J., Taylor P.J., Hobbs S.J., Alpha level adjustments for multiple dependent variable analyses and their applicability – A review. Int J Sport Sci Eng, 2013, 7 (2), 17–20. 20. Sinclair J., Greenhalgh A., Brooks D., Edmundson C.J., Hobbs S.J., The influence of barefoot and barefoot-inspired footwear on the kinetics and kinematics of running in comparison to conventional running shoes. Footwear Science, 2013, 5 (1), 45–53, doi: 10.1080/19424280. 2012.693543. 21. Lieberman D.E., Venkadesan M., Werbel W.A., Daoud A.I., D’Andrea S., Davis I.S. et al., Foot strike patterns and collision forces in habitually barefoot versus shod runners. Nature, 2010, 463 (7280), 531–535, doi: 10.1038/nature08723. 22. Pohl M.B., Messenger N., Buckley J.G., Forefoot, rearfoot and shank coupling: effect of variations in speed and mode of gait. Gait Posture, 2007, 25 (2), 295–302, doi: 10.1016/ j.gaitpost.2006.04.012. 23. Sinclair J., Richards J., Taylor P.J., Edmundson C.J., Brooks D., Hobbs S.J., Three-dimensional kinematic comparison of treadmill and overground running. Sports Biomech, 2013, 12 (3), 272–282, doi: 10.1080/14763141. 2012. 759614. 24. Sinclair J., Greenhalgh A., Taylor P.J., Edmundson C.J., Brooks D., Hobbs S.J., Differences in Tibiocalcaneal Kinematics Measured with Skin-and Shoe-Mounted Markers. Hum Mov, 2013, 14 (1), 64–69, doi: 10.2478/humo-20130005.
Paper received by the Editor: October 5, 2014 Paper accepted for publication: November 28, 2014 Correspondence address Jonathan Sinclair Division of Sport Exercise and Nutritional Sciences School of Sport Tourism and Outdoors College of Culture Media and Sport University of Central Lancashire Preston, Lancashire PR1 2HE, United Kingdom e-mail:
[email protected]
215
HUMAN MOVEMENT 2014, vol. 15 (4), 216– 220
Accuracy of replicating static torque and its effect on shooting accuracy in young basketball players doi: 10.1515/humo-2015-0014
Artur Struzik*, Andrzej Rokita, Bogdan Pietraszewski, Marek Popowczak University School of Physical Education, Wrocław, Poland
Abstract
Purpose. Accurate shooting in basketball is a prerequisite for success. Coordination ability, one of the abilities that determine the repeatability of accurate shooting, is based on kinesthetic differentiation. The aim of the study was to evaluate the strength component of kinesthetic differentiation ability and determine its relationship with shooting accuracy. Methods. Peak muscle torque of the elbow extensors under static conditions was measured in 12 young basketball players. Participants then reproduced the same movement at a perceived magnitude of 25%, 50%, and 75% of static peak torque, with error scores calculated as a measure of kinesthetic differentiation. The results were compared with players’ field goal percentages calculated during game play in a regional championship. Results. No statistically significant relationships were found between the level of kinesthetic differentiation ability and field goal percentage. Additionally, no upper limb asymmetry was found in the sample. Conclusions. The relatively high levels of elbow static peak torque suggest the importance of upper limb strength in contemporary basketball. The lack of a statistically significant difference between the right and left limbs decreases the risk of suffering injury. It is likely that choosing other suitable tests would demonstrate the relationships between field goal percentage and kinesthetic differentiation ability. Key words: kinesthetic differentiation, proprioception, upper limb asymmetry
Introduction Shooting is the most important skill in basketball as it directly tied with scoring points. In contemporary basketball, the jump shot is the most commonly performed, with training designed to automate its movement so that, regardless of external factors, maximum repeatability and accuracy can be attained [1]. The high level of specialization of the jump shot requires players to maximize jumping (speed–strength) and coordination abilities [2]. Although the shooting technique used by basketball players may appear to be similar, significant differences, not the least those as a result of different upper body proportions, give rise to individual shooting styles [1]. However, regardless of shooting technique (itself dependent on external factors such as in-game shot situations), the defining criterium of any type of shot is the attained accuracy rate. As only accurate shots are significant in basketball, improving those abilities connected with shot accuracy and repeatability appear to be of critical importance. Every sport contains a number of specific technical elements an athlete has to master, where performance level determines, either directly or indirectly, competitive success. One indicator of neuromuscular efficiency is the level of motor coordination ability. Despite the importance of this factor in sporting success, there is nonetheless a paucity of research on coordination ability in the literature. This may possibly stem from the lack of * Corresponding author. 216
standardized measurement methodologies [3], although numerous studies have investigated the level of other motor abilities such as speed, strength, and endurance in team sports [4, 5]. This is surprising as without an adequate level of coordination ability, many athletes would be unable to maximize their full athletic potential. For instance, a sprinter with a higher running speed may lose to other runners due to a longer start reaction time coupled with poor technique when taking off from the starting blocks [3]. In the game of basketball, almost every shot taken is performed from a different place and in different conditions. As a result, one of the most common manifestations of coordination ability in shot-taking is through kinesthetic differentiation [3, 6]. Kinesthetic differentiation ability is based on the sensation or perception of the strength (muscle tension), temporal (movement speed) and spatial (position of body segments with respect to one another) components a particular motor task or activity. It is connected with movement accuracy and precision (and therefore economy), as improved kinesthetic differentiation ability allows for optimum performance in a variety of conditions [6]. Measurement of static torque is frequently used to evaluate athletic progress and skill level among athletes. However, despite the high test–retest reliability of this method, it has seen little use in the evaluation of the strength component of kinesthetic differentiation ability. Generally, athletes from different sports are characterized by different static torque profiles [7], although withinsubject differences are also found in a given sport. In basketball, differences in the distribution of static torque meas-
HUMAN MOVEMENT A. Struzik, A. Rokita, B. Pietraszewski, M. Popowczak, Torque replication accuracy
ures were found to depend on age, experience, and playing position [8]. A similar relationship between the above variables was observed in the measurement of torque in isokinetic conditions [9]. Similar to other motor abilities, kinesthetic differentiation is subject to exercise-induced fatigue. Zatoń et al. [10] tested replicating force in a flexion and extension movement at the elbow joint in a group of cyclists. Using a ‘kinethesiometer’ built with two force plates, this group of researchers showed a decrease in the ability to reproduce movement by both upper limbs after an exercise test, which signified reduced kinesthetic differentiation ability. Another study measured kinesthetic differentiation ability in lower limb extensors in a group of monofin swimmers [11] using a device similar to the above-mentioned ‘kinethesiometer’. The subjects were asked to use the same force in repeating a movement ‘by feel’ twelve times. These authors found that the best scores obtained during the measurement resulted from individual adaptations to those movements performed in-water. They concluded that technical training should be supplemented with individual drills aimed to improve kinesthetic differentiation ability. Bańkosz [12] used a goniometer to evaluate the accuracy of performing pronation and supination movement with the forearm at the elbow joint in a group of table tennis players. The subjects were asked to replicate this movement but at different angles as a way to measure the spatial component of kinesthetic differentiation ability. The author found more accurate and precise scores in individuals with more table-tennis experience. Bajdziński and Starosta [3] used a dynamometer to examine the accuracy in replicating force (the strength component of kinesthetic differentiation ability) with the upper limbs. After recording the peak force of an elbow-joint flexion, the participants performed a flexion at 50% of their perceived peak force. Their analysis of the error scores (number of deviations from the actual 50% value) indicated no relationship between this component of differentiation ability and age. Bilateral asymmetry is often observed in athletes due to the specificity of the practiced sport and natural use of one’s stronger side of the body (laterality). This naturally involves loading one side of the body [13], although the amount of asymmetry differs depending on age and skill level [14]. Increased lower limb strength asymmetry is discussed extensively in the literature as it is a common occurrence in team sports due to asymmetric movement structures. However, this phenomenon is regarded as unfavorable as it has been associated with an increased risk of injury [15], whereas movement symmetry has been found to improve athlete versatility, increase movement quality, and stimulate proper body growth [13, 14]. Upper limb symmetry is especially important in basketball, as it allows players to take shots with either the right or left hand as well as maintain fluid ball control when dribble and passing.
In basketball, kinesthetic differentiation ability manifests itself in the ability to accurately shoot a ball from different distances and different positions. The aim of the study was therefore to evaluate the above-mentioned strength component of kinesthetic differentiation ability and determine its relationship with shooting accuracy. With this in mind, the study was formed to answer whether a higher level of this ability would be related with a higher in-game field goal percentage? Such a relationship would be helpful in determining which athletes would be most effective in taking shots during play. Additionally, a very useful trait in basketball would be upper limb symmetry, as it would allow for better performance with right- or left-handed shots and with dribbling and passing. Therefore, would a group of competitive basketball players be characterized by this property? Material and methods The study was carried out on 12 right-handed basketball players belonging to a local junior basketball team from the city of Wrocław, Poland. Each participant had several years training experience and had played at least five games in a 2012/2013 regional championship. Basic characteristics of the study group are presented in Table 1. The study was conducted at the Biomechanical Analysis Laboratory (ISO: 9001:2009 accredited) of the University School of Physical Education in Wrocław, Poland after receiving approval by the university’s research bioethics committee. The participants were familiarized with the purpose and procedures of the study and provided their or their parents’ written informed consent if underage. Kinesthetic differentiation ability was evaluated by the accuracy of replicating particular values of static torque by the elbow extensors. Muscle torque was measured under static conditions using a UPR-01 B exercise armchair (OPIW, Poland) pictured in Figure 1. A torquemeter was used to allow for the direct measurement of static torque without needing to measure the length of the lever arm to which force is applied. This direct measurement of torque rather than force allows for a more accurate recording of the amount of work performed by an individual body segment when performing a rotational movement. Testing began by fastening the participant in the armchair of the machine (hips pressed against the chair back) with a belt around the thoracic region to prevent the involvement of adjacent muscle groups. This allowed for a more accurate measure of elbow flexor torque. MotivaTable 1. Characteristics of the study group (mean ± SD) n
Body height Body mass (cm) (kg)
Age (years)
Training experience (years)
12
190.6 ± 9.1 83.1 ± 10.7
16.8 ± 0.9
7.3 ± 1.9 217
HUMAN MOVEMENT A. Struzik, A. Rokita, B. Pietraszewski, M. Popowczak, Torque replication accuracy
peak torque was based on the mean value of three trials for each percentage value (Dx), with an error score calculated both as a percentage (1) and as total error (2): 3
(1) Dx =
i=1
0,x · Mmax – M(x–i) · 100, x , 3 · 0,x · Mmax
3
(2) Dx =
Figure 1. Test stand for measurement of manifestations of strength components of kinesthetic differentiation ability
tion and guidance was provided throughout the test. Measures were taken separately for each limb at an angle of 75o at the elbow joint and 90o at the shoulder joint, where 0o at the elbow joint was considered to be a full extension and, for the shoulder joint, when the arm was located alongside the trunk. These angular values were selected to obtain maximum static torque values for these muscle groups [16]. Furthermore, this angle at the elbow joint approximately corresponded to the initial angle of this joint when taking a shot in basketball [17]. Immediately after the peak static torque values were recorded (best value out of three trials) for the right and left elbow extensors (Mmax), the participant was asked to reproduce the movement but this time at what they perceived to be 25%, 50%, and 75% of their peak static torque. The participant was allowed to practice with visual feedback for each of the percentages of peak torque for 60, 30 and 15 seconds, respectively. Duration times were decreased with an increase in the percentage value in order to normalize the total load. During the actual measurement, the subject was not informed of the results. The accuracy in replicating each percentage of
i=1
0,x · Mmax – M(x–i) , x . 3
The symbol M(x–i) denotes successive measurements of static torque for a particular percentage x. Based on the above formulas, a score of 0 would denote the most accurate replication of a percentage of static peak torque, while a higher value would denote lower accuracy. In order to compare the above results with players’ shooting accuracy, the games the participants played in during the 2012/2013 junior championships were analyzed (these games were played before the present study) to calculate field goal percentage. Statistical analysis included Student’s t test for dependent samples to evaluate differences between the variables of the right and left upper limb. Pearson’s correlation coefficient (r) was employed to measure the relationships between the individual variables. The level of significance was set at = 0.05. The results were first analyzed by group means and then individually for each participant. Results Table 2 presents the mean peak static torque generated by the right and left elbow extensors and how accurate the participants were in replicating a percentage (25%, 50%, and 75%) of static peak torque, calculated as a relative (percentage) and total error. No statistically significant differences were found between the right and left upper limbs neither for static peak torque nor in the accuracy of replicating the three percentage target values as calculated by the two methods. No statistically significant correlations were observed between the accuracy of replicating static torque for any of the percentages of static peak torque either as a percentage or total error and the field goal percentage calculated for the players (group mean field goal percentage: 42.2%) during their
Table 2. Means and standard deviations of peak static torque generated by the elbow extensors (Mmax) of the right (R) and left (L) upper limbs and the accuracy in replicating 25% (D25), 50% (D50), and 75% (D75) of the static peak torque expressed as a percentage and total error Upper limb
Mmax (N · m)
R L
70.3 ± 16.5 63.2 ± 20.8
218
Percentage
Total errors
D25 (%)
D50 (%)
D75 (%)
D25 (N · m)
D50 (N · m)
D75 (N · m)
33.5 ± 9.5 42.3 ± 29.5
27 ± 15.8 36.7 ± 19.8
11.0 ± 5.7 15.0 ± 9.4
5.6 ± 1.7 6.9 ± 4.7
8.8 ± 5.2 10.3 ± 5.0
5.7 ± 2.6 6.7 ± 3.5
HUMAN MOVEMENT A. Struzik, A. Rokita, B. Pietraszewski, M. Popowczak, Torque replication accuracy
Table 3. Comparison of mean field goal percentage, accuracy of replicating static torque (mean from the three percentage values of D25, D50 and D75) expressed as a percentage (D%) and total error (Dte) for the right upper limb Athlete No. 1. 2. 3. 4. 5. 6. 7. 8. 9. 10. 11. 12.
Field goal percentage FG (%) 61.3 54.5 44.7 40 50 43.3 50 36.8 20 33.8 40 46.4
Ranking
Percentage
Total errors
D% (%)*
Ranking
Dte (N · m)*
Ranking
21.7 24.1 20.3 43.9 17.6 30.7 15.3 20.1 22.2 35.1 16 18.6
7 9 6 12 3 10 1 5 8 11 2 4
5.1 6.1 8.7 13.6 4.1 8 5.8 5.3 7.1 6.4 4.6 5.3
3 7 11 12 1 10 6 4/5 9 8 2 4/5
1 2 6 8/9 3 7 4 10 12 11 8/9 5
* statistically significant correlation between variables (p < 0.02)
participation in a regional championship. Furthermore, analysis performed individually for each participant also did not demonstrate any relationships (the results for the right upper limb are presented in Table 3). Discussion When comparing the results of the present study with those in the literature, the basketball players obtained higher static peak torque for the elbow extensors than their peers also involved in basketball [8, 18]. However, similar mean static torques for the elbow joint were reported in a group of senior basketball players by Buśko [19]. The above comparisons suggest that the basketball players in the present study were characterized by a relatively high level of elbow extensor torque production. This result suggests the importance of upper limb strength in contemporary basketball. Basketball players have been found to commonly exhibit significant muscle strength asymmetry and, as a result, are at risk of suffering various injuries [20]. This has been credited to the specificity of basketball technique (dribbling, shooting, one-handed passing, jump take-offs, pull-up jump shots) and the habitual use of the stronger side of the body [13]. In turn, the elevated risk of limb injuries due to asymmetry [15] has been found to advance body asymmetry even further [20, 21]. Besides basketball, substantial muscle torque asymmetry measured in isokinetic conditions was found in both the lower and upper limbs of volleyball players [22]. Additionally, unequal muscle growth has been even found to reduce the strength of those muscles responsible for movement at a particular joint on the weaker side of the body, also resulting in an increased risk of injury [23]. Therefore, the lack of statistically significant differences between the static torque values and kinesthetic differentiation ability of the right and left upper limbs should be regarded very positively and may arguably
be the effect of properly selected coaching methods and training loads. Training oriented towards equally developing the body should be considered necessary so as to improve player efficiency in performing both offensive and defensive actions. However, when measuring the anthropometric characteristics of basketball players, no significant asymmetry was found by Tomkinson et al. [13]. Furthermore, Theoharopoulos and Tsitskaris [24] did not find any significant asymmetry for the ankle joint (plantar/dorsiflexion ratio, plantar/dorsiflexion peak torque, and range of motion) in basketball players. Tests based on basketball shooting at different distances have often been mentioned as a measure of kinesthetic differentiation ability [6]. In the present study, no significant relationships were found between the in-game field goal percentage of the participants during a championship and the results evaluating the strength component of kinesthetic differentiation ability. This may be due to the numerous interacting factors present during a game, all of which may impair shooting accuracy (opponents, time pressure, fatigue, stress, etc.), although it can be argued that competitive basketball athletes are expected to successfully cope with such factors. It may be possible that the present experiment’s focus on only the strength component is too restrictive in using kinesthetic differentiation ability as a predictor of shooting accuracy. The inclusion of additional tests measuring, for example, the temporal component of this ability may provide better relationships with shooting movement. The usefulness of this measure can be seen in a study by Tang and Shung [25], who found a significant and positive relationship between shooting accuracy and elbow extensor torque measured in isokinetic conditions. Conclusions 1. The analyzed group of basketball players obtained relatively high elbow extensor static torque values, sug219
HUMAN MOVEMENT A. Struzik, A. Rokita, B. Pietraszewski, M. Popowczak, Torque replication accuracy
gesting the importance of upper limb strength in basketball. 2. No statistically significant differences were found between the right and left upper limbs neither for peak static torque nor in the accuracy of replicating 25%, 50%, and 75% of peak static torque. 3. No statistically significant relationships were found between the accuracy of replicating the static peak torque percentages and field goal percentage. In order to verify the above relationships, future research should include other suitable tests measuring kinesthetic differentiation ability as well as shooting accuracy. References 1. Kornecki S., Lenart I., Siemieński A., Dynamical analysis of basketball jump shot. Biol Sport, 2002, 19 (1), 73–90. 2. Spina M.S., Cleary T.D., Hudson J.L., An exploration of balance and skill in the jump shot. In: Bauer T. (ed.), XIII International Symposium for Biomechanics in Sport: Proceedings. Lakehead University, Thunder Bay, Ontario, Canada, July 18–22, 1995. Lakehead University, Thunder Bay, Ontario 1996, 294–297. 3. Bajdziński M., Starosta W., Movements kinesthetic differentiation ability and its conditions [in Polish]. International Association of Sport Kinetics, OSGRAF, Warszawa –Gorzów Wielokopolski 2002. 4. Alemdaroğlu U., The relationship between muscle strength, anaerobic performance, agility, sprint ability and vertical jump performance in professional basketball players. J Hum Kinet, 2012, 31, 149–158, doi: 10.2478/v10078012-0016-6. 5. Kotzamanidis C., Chatzopoulos D., Michailidis C., Papaiakovou G., Patikas D., The effect of a combined highintensity strength and speed training program on the running and jumping ability of soccer players. J Strength Cond Res, 2005, 19 (2), 369–375. 6. Raczek J., Mynarski W., Ljach W., Developing and diagnosing of co-ordination motor abilities [in Polish]. AWF, Katowice 2003. 7. Jaszczuk J., Wit A., Trzaskoma Z., Iskra L., Gajewski J., Biomechanical criteria of muscle force evaluation in the aspect of top-level athletes selection. Biol Sport, 1988, 5 (1), 51–63. 8. Buśko K., Selected biomechanical characteristics of male and female basketball national team players. Biol Sport, 1989, 6 (4), 319–329. 9. Gerodimos V., Manou V., Stavropoulos N., Kellis E., Kellis S., Agonist and antagonist strength of ankle musculature in basketball players aged 12 to 17 years. Isokinet Exerc Sci, 2006, 14 (1), 81–89. 10. Zatoń M., Błacha R., Jastrzębska A., Słonina K., Repeatability of pressure force during elbow flexion and extension before and after exercise. Hum Mov, 2009, 10 (2), 137–143, doi: 10.2478/v10038-009-0010-6. 11. Rejman M., Klarowicz A., Zatoń K., An evaluation of kinesthetic differentiation ability in monofin swimmers. Hum Mov, 2012, 13 (1), 8–15, doi: 10.2478/v10038-011-0048-0. 12. Bańkosz Z., The kinesthetic differentiation ability of table tennis players. Hum Mov, 2012, 13 (1), 16–21, doi: 10.2478/ v10038-011-0049-z. 13. Tomkinson G.R., Popović N., Martin M., Bilateral symmetry and the competitive standard attained in elite and 220
sub-elite sport. J Sport Sci, 2003, 21 (3), 201–211, doi: 10.1080/0264041031000071029. 14. Dworak L.B., Wojtkowiak T., Strength asymmetry of the muscles extending lower limbs among males in the aspects of age and different physical activity patterns. In: Osiński W., Starosta W. (eds.), Sport Kinetics 93. Proceedings of the 3rd International Conference, September 8–11, 1993 Poznań, Poland. Warsaw Academy of Physical Education in Poznań, Institute of Sport in Warsaw, Poznań 1994, 121–125. 15. Cheung R.T.H., Smith A.W., Wong D.P., H:Q ratios and bilateral leg strength in college field and court sports players. J Hum Kinet, 2012, 33, 63–71, doi: 10.2478/ v10078-012-0045-1. 16. Urbanik C., Staniszewski M., Mastalerz A., Karczewska M., Lutosławska G., Iwańska D. et al., Evaluation of the effectiveness of training on a machine with variable-cam. Acta Bioeng Biomech, 2013, 15 (4), 93–102, doi: 10.5277/ abb130412. 17. Miller S., Bartlett R., The relationship between basketball shooting kinematics, distance and playing position. J Sport Sci,1996,14(3),243–253,doi:10.1080/02640419608727708. 18. Buśko K., Muscle torque topography in female basketball players. Biol Sport, 1998, 15 (1), 45–49. 19. Buśko K., Training-induced changes in the topography of muscle torques and maximal muscle torques in basketball players. Biol Sport, 2012, 29 (1), 77–83, doi: 10.5604/20831862.984835. 20. Schiltz M., Lehance C., Maquet D., Bury T., Crielaard J.-M., Croisier J.-L., Explosive strength imbalances in professional basketball players. J Athl Training, 2009, 44 (1), 39–47, doi: 10.4085/1062-6050-44.1.39. 21. Dauty M., Dupré M., Potiron-Josse M., Dubois C., Identification of mechanical consequences of jumper’s knee by isokinetic concentric torque measurement in elite basketball players. Isokinet Exerc Sci, 2007, 15 (1), 37–41. 22. Markou S., Vagenas G., Multivariate isokinetic asymmetry of the knee and shoulder in elite volleyball players. Eur J Sport Sci, 2006, 6 (1), 71–80, doi: 10.1080/17461390500533147. 23. Steinfeld Y., Shabat S., Nyska M., Peretz C., Dvir Z., Ankle rotators strength and functional indices following operative intervention for ankle fractures. Isokinet Exerc Sci, 2012, 20 (3), 173–179, doi: 10.3233/IES-20120454. 24. Theoharopoulos A., Tsitskaris G., Isokinetic evaluation of the ankle plantar and dorsiflexion strength to determine the dominant limb in basketball players. Isokinet Exerc Sci, 2000, 8 (4), 181–186. 25. Tang W.-T., Shung H.-M., Relationship between isokinetic strength and shooting accuracy at different shooting ranges in Taiwanese elite high school basketball players. Isokinet Exerc Sci, 2005, 13 (3), 169–174.
Paper received by the Editor: May 5, 2014 Paper accepted for publication: July 10, 2014 Correspondence address Artur Struzik Katedra Biomechaniki Akademia Wychowania Fizycznego ul. Mickiewicza 58 51-612 Wrocław, Poland e-mail:
[email protected]
HUMAN MOVEMENT 2014, vol. 15 (4), 221– 226
Effects of varus orthotics on lower extremity kinematics during the pedal cycle doi: 10.1515/humo-2015-0015
Jonathan Sinclair 1 *, Hayley Vincent 1, Paul John Taylor 2 , Jack Hebron 1, Howard Thomas Hurst 1, Stephen Atkins 1 1 2
Division of Sport Exercise and Nutritional Sciences, University of Central Lancashire, Preston, United Kingdom School of Psychology, University of Central Lancashire, Preston, United Kingdom
Abstract
Purpose. Cycling has been shown to be associated with a high incidence of chronic pathologies. Foot orthoses are frequently used by cyclists in order to reduce the incidence of chronic injuries. The aim of the current investigation was to examine the influence of different varus orthotic inclines on the three-dimensional kinematics of the lower extremities during the pedal cycle. Methods. Kinematic information was obtained from ten male cyclists using an eight-camera optoelectronic 3-D motion capture system operating at 250 Hz. Participants cycled with and without orthotic intervention at three different cadences (70, 90 and 110 RPM). The orthotic device was adjustable and four different wedge conditions (0 mm – no orthotic, 1.5 mm, 3.0 mm and 4.5 mm) were examined. Two-way repeated measures ANOVAs were used to compare the kinematic parameters obtained as a function of orthotic inclination and cadence. Participants were also asked to subjectively rate their comfort in cycling using each of the four orthotic devices on a 10-point Likert scale. Results. The kinematic analysis indicated that the orthotic device had no significant influence at any of the three cadences. Analysis of subjective preferences showed a clear preference for the 0 mm, no orthotic, condition. Conclusions. This study suggests that foot orthoses do not provide any protection from skeletal malalignment issues associated with the aetiology of chronic cycling injuries. Key words: cycling, biomechanics, foot orthoses
Introduction Participation in both competitive and recreational cycling has considerably increased as a form of training and also as a leisure activity [1]. However, despite its popularity, cycling has been shown to be associated with a high incidence of chronic pathologies [2, 3]. Chronic musculoskeletal injuries have nonetheless received little attention in cycling research. The few investigations that have been undertaken have unanimously found knee injuries to be the most prevalent complaint, affecting between 24% and 62% of cyclists. Due to the structure of the bicycle and the mechanics of the pedal cycle, the knee joint bears the majority of the load during cycling [4]. Foot orthoses are frequently used by cyclists for a variety of goals [5]. The mechanical reasoning behind the use of foot orthoses is associated with improvements in the biomechanical alignment of the lower extremity and foot, facilitating a more linear cycling motion [6]. This mechanism is considered to be beneficial in preventing chronic injuries in cyclists [7]. The influence of foot orthotic devices has received considerable attention in running biomechanics literature, where orthotic intervention was shown to be an effective treatment of running injuries with a reported success rate of 50–90% [8].
* Corresponding author.
The effects of foot orthoses in cycling has received little attention despite the fact that the foot itself remains one of the primary load-bearing structures in the pedal cycle. Francis [9] proposed that orthotics may be able to compensate for alignment problems in the lower extremities that are linked to the development of injuries. Hannaford et al. [10] utilized an adjustable pedal system to alter foot position in the coronal plane. Although this study did report reductions in self-reported discomfort, the data collection was qualitative only and thus no measurements of the mechanics of the pedal cycle were obtained. Sanderson et al. [11] quantified the effect of a wedge placed between the cycling shoe and pedal on coronal plane kinematics of the knee during steady state cycling. The wedge was able to significantly alter knee coronal plane motion by moving the position of the knee itself away from the bicycle frame. This study utilized two-dimensional video analysis of the knee joint in only one of the three planes of rotation and did not examine the influence of different wedge inclinations on pedal cycle kinematics. The aim of the current investigation was to examine the influence of different varus wedge inclinations on the three-dimensional (3-D) kinematics of the lower extremities during the pedal cycle. A study of this nature may provide insight into the clinical effectiveness of different foot orthoses and offer better understanding of the mechanism by which orthotic intervention serves to reduce symptoms of chronic cycling injuries. This study tests the hypothesis that orthotic intervention 221
HUMAN MOVEMENT J. Sinclair et al., Effects of varus orthoses in cycling
will significantly alter the coronal and transverse plane kinematics of the lower extremities, with the larger wedge inclinations having a greater influence. Material and methods Ten male cyclists volunteered to take part in this study. Participants were active cyclists training at least three times per week. Basic characteristics of the participants were: age 26.74 ± 2.78 years, height 174.47 ± 4.03 cm and body mass 68.66 ± 4.78 kg. All were free from pathology at the time of data collection and written informed consent was provided in accordance with the Declaration of Helsinki. The procedure was approved by ethics committee of the School of Sport Tourism and Outdoors at the University of Central Lancashire. Commercially available insoles (High Performance Footbed, Specialized, USA) were utilized in the current investigation. These orthotics feature a varus wedge on their medial aspect and are classified as semi-custom as they allow the extent of the wedge to be altered with three options: 1.5 mm, 3.0 mm and 4.5 mm. Although the right side was selected for analysis, the orthotic devices were placed inside both shoes. All data were collected using a cycle ergometer (Monark Ergomedic 874E, Monark Exercise, Sweden). Participants were required to cycle with a fixed 2 kg load on the basket at three different cadences of 70, 90 and 110 RPM in each of the four conditions: 0 mm (no orthotic), 1.5 mm wedge, 3.0 mm wedge and 4.5 mm wedge. Saddle height was determined using the LeMond formula [12]. The order in which participants cycled in each of the four orthotic conditions was randomized. Immediately following each trial, participants were asked to rate their subjective comfort in cycling using the orthotic devices using a 10-point Likert scale, with 10 being totally comfortable and 0 being totally uncomfortable. Kinematic data were obtained using an eight-camera optoelectric motion capture system (Qualisys Medical AB, Sweden) at a capture frequency of 250 Hz. The calibrated anatomical systems technique [13] was used to quantify segmental kinematics. To delineate the anatomical frames of the foot, shank and thigh, retroreflective markers were positioned onto the calcaneus, 1st and 5th metatarsal heads, medial and lateral malleoli, medial and lateral epicondyle of the femur, greater trochanter and iliac crests. To define the pelvic co-ordinate axes, additional markers were placed on the anterior (ASIS) and posterior (PSIS) superior iliac spines. Tracking clusters were also positioned on the shank and thigh segments. A static calibration trial was conducted in which the participant stood in the anatomical position in order for the positions of the anatomical markers to be referenced in relation to the tracking clusters. The hip joint centre was defined using regression modelling based on the position of the ASIS markers [14]. Kinematic curves were time normalized to 100% of the pedal cycle. Movement trials were digitized using 222
Qualisys Track Manager then exported as C3D files. Kinematic parameters were quantified using Visual 3-D software (C-Motion, USA) after marker data were smoothed using a fourth-order zero-lag low-pass Butterworth filter at a cut off frequency of 15 Hz [15]. Three-dimensional kinematics of the hip, knee and ankle joints were calculated using an XYZ cardan sequence referenced to co-ordinate systems about the proximal segment [16]. The designation for rotations were X – sagittal, Y – coronal and Z – transverse plane. Discrete parameters of 1) peak angle during the pedal cycle and 2) relative range of motion (ROM) from top dead centre to peak angle were extracted for statistical analysis. Descriptive statistics were generated using means and standard deviations for each of the outcome measures. Differences between wedge heights and cadences were examined using two-way repeated measures factorial ANOVA in a 4 × 3 design. In addition, subjective ratings of comfort for each condition were examined using oneway repeated measured ANOVA. Statistical significance was accepted at the p < 0.05 level throughout. Appropriate post-hoc analyses were conducted on significant main effects using pairwise comparisons after Bonferroni adjustment to control for type I error. Post-hoc comparisons on significant interactions were conducted using simple main effects analyses. Effect sizes were calculated using partial Eta2 (p 2). If the homogeneity assumption was violated then the degrees of freedom were adjusted using the Greenhouse Geisser correction. The Shapiro-Wilk statistic for each condition confirmed that the normal distribution assumption was met in all cases. All statistical procedures were conducted using SPSS 21.0 (SPSS, USA). Results A significant main effect was shown for the subjective preferences; F(3, 27) = 27.68, p < 0.05, p 2 = 0.74. Post-hoc analyses showed that each of the four conditions differed significantly from one another, with the highest preferences shown for 0 mm (9.9 ± 0.32), followed by the 1.5 mm wedge (8.3 ± 0.82), 3.0 mm wedge (6.9 ± 0.99) and then 4.5 mm wedge (4.9 ± 0.88). 110 RPM No significant (p > 0.05) differences were observed as a function of the orthotic intervention. 90 RPM No significant (p > 0.05) differences were observed as a function of the orthotic intervention. 70 RPM No significant (p > 0.05) differences were observed as a function of the orthotic intervention.
SD
Mean SD
Mean SD
Mean SD
3.0 mm Mean SD
1.5 mm Mean SD
0.0 mm Mean SD
4.5 mm Mean SD
3.0 mm Mean SD
1.5 mm Mean
SD
0.0 mm
SD
Mean SD
1.5 mm Mean SD
0.0 mm Mean SD
4.5 mm Mean SD
3.0 mm Mean
SD
1.5 mm
90 RPM
Mean
SD
0.0 mm
Mean
SD
4.5 mm
Mean
SD
3.0 mm
Mean
SD
1.5 mm
70 RPM
Mean
SD
0.0 mm
−1.70 6.98 −1.89 6.76 4.29 7.48
7.59 5.43
7.16 1.95
−0.06 6.32 −0.54 7.46 6.09 3.49 6.84 6.62
−5.04 6.35 −4.51 8.03 3.81 2.26 4.22 2.67
−0.53 6.73 6.07 4.38
−4.47 7.54 3.72 2.25
−0.71 7.72 −0.41 6.12 7.03 5.70 6.25 4.11
−2.99 7.56 −5.70 6.45 3.01 1.49 4.55 2.53
No significant (p > 0.05) differences were observed as a function of the orthotic intervention at a cadence of 90 RPM.
−1.68 6.79 −1.60 6.32 5.82 3.09 7.32 5.90
Transverse plane Peak angle Relative ROM
−4.13 7.68 −3.88 3.47 2.06 3.66
0.03 6.41 6.95 5.83
0.62 6.27 −0.27 6.60 4.93 8.07
−4.04 7.60 −4.12 7.42 −4.14 4.45 2.53 4.05 1.92 4.52
6.86 5.22
6.88 2.15
43.01 6.31 40.03 6.49 39.36 6.54 39.53 6.69 40.52 6.95 39.60 6.13 38.16 6.70 42.21 10.35 38.80 7.26 37.85 7.14 40.39 8.03 36.69 6.54 65.05 7.95 67.52 7.39 67.96 7.71 66.95 8.29 67.99 6.07 67.92 7.20 69.15 7.23 64.82 9.23 70.38 6.64 69.05 7.51 67.21 7.58 71.05 7.56
Mean
−4.86 6.36 −4.09 7.53 3.90 1.79 4.14 1.84
SD
3.0 mm
Coronal plane Peak angle Relative ROM
Sagittal plane Peak angle Relative ROM
Mean
4.5 mm
110 RPM
Table 2. Knee joint kinematics as a function of orthotic wedge inclination and cadence
No significant (p > 0.05) differences were observed as a function of the orthotic interventions at a cadence of 110 RPM.
Transverse plane Peak angle −12.76 12.36 −9.27 9.16 −11.82 10.27 −11.70 10.63 −11.17 9.09 −8.21 8.88 −11.27 9.90 −10.33 9.81 −11.55 7.84 −11.05 10.14 −11.94 10.71 −11.72 9.05 Relative ROM 7.65 3.49 9.48 3.15 7.47 1.20 7.48 1.69 9.92 7.08 10.31 3.80 6.84 0.62 7.21 1.58 9.43 3.33 9.77 1.98 7.99 1.93 10.74 3.74
−12.65 3.91 −12.46 3.94 −12.32 4.89 −12.91 4.99 −14.29 6.69 −13.78 4.10 −11.47 4.15 −13.01 5.32 −11.71 4.12 −11.34 4.79 −11.59 3.99 −13.67 3.05 5.26 3.96 4.58 2.88 2.89 1.91 2.59 2.07 3.98 2.82 5.47 3.06 2.34 1.58 2.73 1.45 4.42 3.67 3.62 2.11 2.27 1.22 3.12 1.86
Mean
4.5 mm
Coronal plane Peak angle Relative ROM
SD
0.0 mm
48.97 18.42 48.78 19.66 44.61 15.23 44.85 15.55 45.35 18.56 47.32 17.12 43.18 15.56 46.53 16.96 43.73 18.19 44.86 16.24 44.28 18.20 39.98 16.98 44.20 6.35 45.59 3.09 45.51 3.62 44.59 4.03 45.66 6.87 44.72 4.09 46.15 4.25 42.90 5.12 47.40 3.77 44.43 5.11 43.42 4.36 45.30 3.69
Mean
1.5 mm
70 RPM
SD
3.0 mm
90 RPM
Sagittal plane Peak angle Relative ROM
Mean
4.5 mm
110 RPM
Table 1. Hip joint kinematics as a function of orthotic wedge inclination and cadence
HUMAN MOVEMENT
J. Sinclair et al., Effects of varus orthoses in cycling
223
224 Mean SD
Mean SD
Mean SD
Mean SD
1.5 mm Mean SD
0.0 mm Mean SD
4.5 mm Mean SD
3.0 mm Mean SD
1.5 mm Mean
SD
0.0 mm
−2.45 2.63 4.07 1.59
−7.36 3.38 3.00 1.40 −1.95 3.68
−6.58 2.92
−1.99 2.09
2.99 −1.09 2.11 −2.17 1.45 2.36 0.48 2.82
3.93 −3.23 3.37 1.43 2.57 1.59 2.60 −1.20 1.00 2.61
2.98 −2.72 2.95 1.27 3.62 1.12
−1.38 2.85
3.70 −3.61 0.95 2.03
2.22 −2.71 3.68 −2.23 1.23 1.78 0.79 1.68
No significant (p > 0.05) differences were observed as a function of the orthotic intervention at a cadence of 70 RPM.
−2.29 3.16 4.02 2.49
−6.74 2.57 2.63 1.72
1.53 −2.16 2.65 −2.50 2.49 1.15 2.67 0.73 3.09 0.75
3.52 −2.08 2.18 −3.64 3.13 1.48 2.16 1.30 1.94 0.85
−1.50 2.74
−3.31 2.10
2.41 0.62
3.67 1.16
−0.57 1.96 3.09 1.11
SD
3.0 mm
Transverse plane Peak angle Relative ROM
Mean
4.5 mm
−6.80 3.42 1.93 1.14
SD
0.0 mm
Coronal plane Peak angle Relative ROM
Mean
1.5 mm
70 RPM
−19.10 5.99 −19.95 7.16 −19.34 7.69 −20.44 10.02 −17.16 6.68 −18.14 8.58 −17.70 8.52 −17.04 10.99 −18.87 8.00 −18.99 9.67 −17.47 9.65 −15.61 10.27 20.62 5.19 22.69 6.06 20.73 6.16 20.74 8.01 18.34 7.19 20.58 11.33 16.78 8.01 17.04 8.97 22.67 10.33 23.00 11.71 18.87 9.22 18.16 9.73
SD
3.0 mm
90 RPM
Sagittal plane Peak angle Relative ROM
Mean
4.5 mm
110 RPM
Table 3. Ankle joint kinematics as a function of orthotic wedge inclination and cadence
HUMAN MOVEMENT
J. Sinclair et al., Effects of varus orthoses in cycling
black line – 4.5 mm, dash line – 3.0 mm, grey line – 1.5 mm, dotted line – 0 mm; FL – flexion, DF – dorsiflexion, AD – adduction, IN – inversion, INT – internal
Figure 1. Hip, knee and ankle joint kinematics at 110 RPM as a function of orthotic condition in the a. – sagittal, b. – coronal and c. – transverse planes
black line – 4.5 mm, dash line – 3.0 mm, grey line – 1.5 mm, dotted line – 0 mm; FL – flexion, DF – dorsiflexion, AD – adduction, IN – inversion, INT – internal
Figure 2. Hip, knee and ankle joint kinematics at 90 RPM as a function of orthotic condition in the a. – sagittal, b. – coronal and c. – transverse planes
HUMAN MOVEMENT J. Sinclair et al., Effects of varus orthoses in cycling
black line – 4.5 mm, dash line – 3.0 mm, grey line – 1.5 mm, dotted line – 0 mm; FL – flexion, DF – dorsiflexion, AD – adduction, IN – inversion, INT – internal
Figure 3. Hip, knee and ankle joint kinematics at 70 RPM as a function of orthotic condition in the a. – sagittal, b. – coronal and c. – transverse planes
Discussion The aim of the current investigation was to examine the influence of different varus wedge inclinations on the 3-D kinematics of the lower extremities during the pedal cycle. This investigation represents the first study to examine the influence of varus foot orthotics of different inclincations on the kinematics of the pedal cycle. The key finding from the current investigation was that orthotic devices, regardless of the wedge incination, did not significantly influence lower extremity kinematics during the pedal cycle. This observation does not support out hypothesis and also opposes the findings of by Sanderson et al. [11], who documented that varus orthotics were able to significantly influence the coronal plane motion of the knee during the pedal cycle and have the desired effect of moving the knee away from the bicycle frame. There are several mechanisms that may explain this discrepancy. Firstly, Sanderson et al. [11] utilized a wedge inclination of 10 mm which is considerably greater than any of the conditions used in the current investigation. An increased wedge inclination is likely to have an enhanced effect on lower extremity kinematics hence the observations of Sanderson et al. [11] are to be expected. Furthermore, the orthotic device may not have been sufficiently rigid to restrain the motion of the ankle joint, meaning that the wedge was not able to successfully attenuate non-sagittal motion during the pedal cycle.
Foot orthoses are frequently advocated for the management of chronic cycling injuries [17], often based on the notion they reduce non-sagittall cycling motions [18]. The observations from the current investigation provide clinically relevant data to cyclists that oppose this notion. Aetiological analyses have confirmed that excessive motions of the hip and knee joints in the coronal and transverse planes are assocaited with aetiology of a number of chronic pathologies in cyclists [5]. Therefore, given that foot orthoses regardless of angulation did not influence lower extremity kinematics, the findings from the current investigation contradict the notion that shoe footbeds serve to reduce the kinematic parameters linked to the aetiology of chronic cycling injuries. A further important finding from the current investigation is that participants rated the no-orthotic condition as being most preferable for riding comfort followed incremantally by the 1.5, 3.0 and then 4.5mm conditions. This finding, whilst subjective, indicates that riders perceive foot orthoses negatively in terms of their own comfort when pedalling. Furthermore, on the basis that foot orthoses do not appear to provide any clinically beneficial alterations in pedalling mechanics, the current investigation provides evidence indicating that foot orthoses may be unneccesary. A limitation of the current investigation is that only male cyclists were examined during data collection. This may limit the generalizability of the findings to female cyclists as females are likely to exhibit distinct lower extremity kinematics than males, particularly in the coronal and transverse planes. Therefore, the influence of foot orthoses on the kinematics of the lower extremities during the pedal cycle may be different. It is recommended that the current investigation be repeated using a sample of female cyclists. Conclusions The current investigation provides new information on the influence of orthotic foot inserts on the 3-D kinematics of the lower extremities during the pedal cycle. On the basis that no significant alterations in cycling kinematics were observed with the utilization of various foot orthotics, the current investigation may provide insight into the clinical efficacy of orthotic intervention. This study suggests that foot orthoses do not provide any protection from skeletal malalignment issues associated with the aetiology of chronic cycling injuries. References 1. Clarsen B., Krosshaug T., Bahr R., Overuse injuries in professional road cyclists. Am J Sports Med, 2010, 38 (12), 2494–2501, doi: 10.1177/0363546510376816. 2. Holmes J., Pruitt A., Whalen N., Cycling knee injuries: common mistakes that cause injuries and how to avoid them. Cycling Sci, 1991, 3, 11–14. 225
HUMAN MOVEMENT J. Sinclair et al., Effects of varus orthoses in cycling
3. Holmes J.C., Pruitt A.L., Whalen N.J., Lower extremity overuse in bicycling. Clin Sports Med, 1994, 13 (1), 187–205. 4. Ericson M.O., Nisell R., Ekholm J., Varus and valgus loads on the knee joint during ergometer cycling. Scand J Sports Sci, 1984, 6, 39–45. 5. Yeo B.K., Bonanno D.R., The effect of foot orthoses and in-shoe wedges during cycling: a systematic review. J Foot Ankle Res, 2014, 7, 31, doi: 10.1186/1757-1146-7-31. 6. Sanner W.H., O’ Halloran W.D., The biomechanics, etiology and treatment of cycling injuries. J Am Podiatr Med Assoc, 2000, 90 (7), 354–376. 7. Callaghan M.J., Lower body problems and injury in cycling. J Bodywork Mov Ther, 2005, 9 (3), 226–236, 10.1016/j. jbmt.2005.01.007. 8. Kilmartin T.E., Wallace W.A., The scientific basis for the use of biomechanical foot orthoses in the treatment of lower limb sports injuries – A review of the literature. Br J Sports Med, 1994, 28 (3), 180–184, doi:10.1136/ bjsm.28.3.180. 9. Francis P.R., Injury prevention for cyclists: a biomechanical approach. In: Burke E. (ed.) Science of cycling. Human Kinetics, Champaign 1986, 145–165. 10. Hannaford D.R., Moran G.T., Hlavec H.F., Video analysis and treatment of overuse knee injury in cycling: a limited clinical study. In: Terauds J., Basham J.K. (eds.), Biomechanics in sport II. Academinc Press, San Diego 1985, 153–159. 11. Sanderson D.J., Black A.H., Montgomery J., The effect of varus and valgus wedges on coronal plane knee motion during steady-rate cycling. Clin J Sport Med, 1994, 4 (2), 120–124, doi: 10.1097/00042752-199404000-00009. 12. Lemond G., Gordis K., Greg Lemond’s complete book of bicycling. Perigee Trade, New York 1987. 13. Cappozzo A., Catani F., Della Croce U., Leardini A., Position and orientation in space of bones during movement:
226
anatomical frame definition and determination. Clin Biomech, 1995, 10 (4), 171–178, doi: 10.1016/02680033(95)91394-T. 14. Sinclair J., Taylor P.J., Currigan G., Hobbs S.J., The testretest reliability of three different hip joint centre location techniques. Mov Sport Sci, 2014, 83, 31–39, doi: 10.1051/sm/2013066. 15. Winter D.A., Biomechanics and Motor Control of Human Movement. John Wiley & Sons., New York 1990. 16. Sinclair J., Hebron J., Hurst H., Taylor P., The influence of different Cardan sequences on three-dimensional cycling kinematics. Hum Mov, 2013, 14 (4), 334–339, doi: 10.2478/humo-2013-0040. 17. Asplund C., St Pierre P., Knee pain and bicycling: fitting concepts for clinicians. Phys Sportsmed, 2004, 32 (4), 23–30, doi: 10.3810/psm.2004.04.201. 18. Van Zyl E., Schwellnus M.P., Noakes T.D., A review of the etiology, biomechanics, diagnosis, and management of patellofemoral pain in cyclists. Int SportMed J, 2001, 2 (1), 1–34.
Paper received by the Editor: August 18, 2014 Paper accepted for publication: November 24, 2014 Correspondence address Jonathan Sinclair Division of Sport Exercise and Nutritional Sciences School of Sport Tourism and Outdoors College of Culture Media and Sport University of Central Lancashire Preston, Lancashire PR1 2HE, United Kingdom e-mail:
[email protected]
HUMAN MOVEMENT 2014, vol. 15 (4), 227– 233
A critical review of position- and velocity-based concepts of postural control during upright stance doi: 10.1515/humo-2015-0016
Fellipe Machado Portela, Erika Carvalho Rodrigues, Arthur de Sá Ferreira* Augusto Motta University Center (UNISUAM), Rio de Janeiro, Brazil
Abstract
Purpose. Postural control during quiet standing has been modeled by concepts using kinematic variables estimated from center of pressure (COP) signals. The concept of position-based postural control has had particular ramifications in the literature, although a more recent concept of velocity-based control has been proposed as being more relevant. Methods. This study reviews the literature investigating these concepts and their respective quantitative methods alongside current supporting evidence and criticisms. Results. The position-based control concept suggests the existence of two control loops that alternate whenever certain thresholds are exceeded. Such a theory is supported by studies describing the time delay between the skeletal muscle activation and CoP displacement. However, this concept has been criticized to be the result of statistical artifacts due to it not being adapted to the analysis of bounded time series. Conversely, the velocity-based control concept claims that velocity is the most relevant kinematic variable for postural control. Such a theory suggests that postural adjustments are executed to change the trajectory of the CoP whenever the velocity crosses a threshold. Both theories have their major methodological limitations, while interpretation of data from the position-based concept is difficult, velocity-based thresholds are empirical and still need verification in different motor tasks and populations. Conclusions. Given the observed similarities and mutual exclusivity of both concepts, there is a need for the development of methods that can quantitatively analyze stabilometric signals while simultaneously considering both kinematic variables. Key words: biomechanics, postural balance, rehabilitation
Introduction Postural control is an important factor of the motor system when performing activities of daily living. Information from the vestibular, visual, and somatosensory systems is integrated to generate postural adjustments appropriate for a given motor task. Each of these systems contributes to postural control by providing kinematic feedback on position, velocity, and acceleration variables, either linear or angular. The primary aim of the postural control system during upright standing is to counteract gravity and inertial forces acting on the body’s segments, represented by the body’s center of mass (CoM), so as to maintain the CoM within the base of support (BoS) and avoid falling [1–3]. Although the trajectory of the center of pressure (CoP) – the point of application of the body’s ground reaction force vector [1] – is totally independent of CoM displacement in the anteroposterior (AP) and mediolateral (ML) directions, CoP is usually interpreted as the neuromuscular response of the body to maintain balance. For these reasons, both univariate and bivariate CoP time series (stabilograms and statokinesigrams, respectively) obtained from force platforms are used to assess postural stability during quiet stance. Several theories alongside a wide array of metho dological approaches have been designed to explain the
* Corresponding author.
relationship between postural control mechanisms and CoP time series variables. Among several published models, Collins and De Luca’s proposition [4, 5] has had particular wide ramifications and been the subject of extensive research [2, 6]. In this model, postural adjustments related to upright stance were theorized to be accounted by the kinematic variable CoP position [4, 5]. More recently, Delignières et al. [7] proposed a new concept suggesting that CoP velocity is more relevant in explaining postural control. As both concepts have been used in the study of human movement science, researchers and clinicians ought to have a critical understanding of both theories in the planning of future studies and in assessing rehabilitation of patients with poor postural balance. Therefore, this study: 1) reviews the concepts and quantitative methods analyzing CoP signals in relation to position- and the velocity-based control of upright stance, and 2) discusses the similarities and dissimilarities of both concepts as well as supporting evidence and current criticism. Perspectives for the quantitative analysis of stabilometric signals and the need for the development of new quantitative analysis methods including both CoP position and velocity variables are also put forward. The concept of position-based postural control This concept theorizes that undisturbed erect stance is stabilized by two control loops, namely the ‘open-loop’ and ‘closed-loop’ [4, 5]. On the one hand, the open-loop 227
HUMAN MOVEMENT F.M. Portela, E.C. Rodrigues, A. de Sá Ferreira, Position- and velocity-based postural control
is characterized by commands descending to different postural muscles so that upright stance is maintained by ‘muscle stiffness’. On the other hand, the closed-loop is characterized by the use of feedback information to generate motor responses as a reaction to postural disturbances, where postural correction is thusly mediated by compensatory muscular responses. Loops are switched whenever the univariate (AP or ML) or bivariate CoP position reaches a given threshold. Within the context of position-based control, a threshold is defined as some systematic criterion, if exceeded, activates corrective feedback mechanisms. Changes in CoP trajectory as a result of such corrective feedback mechanisms are intended to alter the displacement of CoM, thus keeping it within the BoS. Quantitative method for the analysis of univariate and bivariate CoP time series The underlying idea is to model the statokinesigram as a fractional Brownian motion (fBm) and therefore decompose the oscillatory patterns of CoP time series into short- and long-time stochastic processes related to the open- and closed-loop, respectively. The statokinesigram is modeled as a random walk of CoP displacement in the AP (y axis) and ML (x axis) directions. The analysis involves the calculation of quadratic displacements ( r 2) between all pairs of n samples (ri and ri + m) of CoP times series separated by a time interval ( t), such that m corresponds to the number of CoP samples in t (see equations 1 and 2) [4, 5]: N–m
(1)
r 2 = t
2 ( r ) , where N–m i=1
(2) r2 = x2 + y2 , The repetition of the this iterative process for increasing values of m, usually in the range m = 0.1–10 s, generates
a distribution of the mean quadratic displacements in either the ML and AP directions ( and ), i.e. a statokinesigram (), versus the time interval t between samples (Fig. 1), namely a stabilogram-diffusion plot [4, 5] or variogram [8]. An empirical threshold (the critical point [ t, < j2>], where j = x, y, r) is estimated from the intersection of two straight lines representing the separation of the short- and long-time processes. Finally, the following variables are used to fit the lines to the variogram for the quantification of the postural control processes: 1) the diffusion coefficients Djs and Djl , as computed from the slopes of the lines fitted to the short-term (subscript s) and long-term (subscript l) regions, respectively; and 2) the scaling exponents Hjs , and Hjl as calculated from the slopes of the log-log plots of the short- and long-term regions, respectively [4, 5]. Evidence supporting the concept of position-based postural control Scientists started searching for evidence of open and closed control loops shortly after its existence was proposed almost three decades ago [4, 5]. Various studies presented by the founding authors showed that the openloop control mechanisms act during a time interval of less than 1 s in healthy subjects. This short-time window reinforced the idea that postural control processes are not solely based on feedback information [5]. Another study on healthy subjects showed that visual feedback reduces body sway, suggesting that feedback control acting for longer time periods could reduce the CoM displacement [9]. The simultaneous assessment of CoP displacement and surface electromyograms (sEMG) revealed positive latencies from 0.25 s to 0.3 s between the electrical activity of the lateral gastrocnemius muscle and sagittal CoP displacement, which further corroborated the hypothesis of anticipatory postural adjustments [10]. As another example, the higher positive latency between sEMG of the lateral gastrocnemius and AP CoP displacement observed after a muscle fatigue protocol suggests
Signal acquisition set-up: postural task – bipedal upright stance with open eyes and wide BoS; force platform – AccuSwayPlus (AMTI, USA); sampling frequency – 100 Hz; trial duration – 60 s; signal processing – bias and trend removal followed by a second order low-pass Butterworth filter at 2.5 Hz in direct and reverse order
Figure 1. Quantitative method for assessing the critical point in position-based control of posture 228
HUMAN MOVEMENT F.M. Portela, E.C. Rodrigues, A. de Sá Ferreira, Position- and velocity-based postural control
that the open-loop may be modified by physiological stress such as physical exercise [11]. The hypothesis of anticipatory mechanisms based on a sequence of motor adjustments was applied to the development of the sway-density curve (SDC), a plot of the quantity of CoP samples inside a fixed radius circle as a function of postural task time [8]. Comparisons between different quantitative methods for CoP signal analysis – traditional and mechanical ones – suggested that the variogram parameters better expressed the postural control process [12]. Additionally, variogram-derived parameters could be used to detect differences in the postural control of young and elderly subjects even if they have a low risk of falling [12]. In the variogram, the low frequencies (slower components) of body sway were related to inertial body characteristics while the higher frequencies (faster components) were related to intermittent muscle activity [13]. It was also observed in healthy subjects that postural control was affected if visual feedback was delayed [13]. In addition, stabilogram-diffusion parameters exhibited increased values in patients with Parkinson’s disease, suggesting an altered contribution of open- and closed-loops in postural control [14]. Criticisms of the concept of position-based postural control The concept of position-based postural control has been strongly criticized due to inaccuracies found in the quantitative methods proposed by original authors [3]. Another general objection against the fBm model of CoP displacement is that it disregards the biomechanics of the inverted pendulum and its intrinsic instability [8]. Moreover, the open-loop has a higher level of stochastic activity than the closed-loop, and does not appear to present a plausible biomechanical explanation of postural control [15]. While fBm is an adequate model for physical systems dominated by diffusion processes, it is questionable when applied to oscillatory biomechanical systems [8]. Variogram parameters exhibited low power to distinguish healthy individuals from patients with Parkinson’s disease or presenting osteoporosis as compared with statistical estimators [8]. Moreover, variogram para meters are not easily interpreted and/or related to the physiological systems controlling upright stance [8]. What is more, alternative interpretations beyond openand closed-loops have been applied to fBm modeling of the variogram. For instance, the closed-loop can be interpreted as either an exploratory process [16] or as a delay factor due to the time dispended by the central nervous system (CNS) to gather and combine all sensory information so as to generate corresponding motor output [17]. Methodologically, it was argued that both control loops result from statistical artifacts of variogram analysis, since this quantitative method was not adapted to
a bounded time series [15]. A bounded time series is mathematically defined as a function f(t) for which there exists a real number M such that f(t) M, i.e. f(t) cannot have a large amplitude regardless of the length of the data set. In particular, it was argued that postural control could not be explained by variogram analysis [7]. There are two common methods used to characterize the serial correlation properties of CoP data: the variogram and detrended fluctuation analysis (DFA). By definition, variance of fBm displacement is calculated as a power function of time, i.e. the base is the time interval t during which the displacement is observed. Equations 3 and 4 can be used for calculating the variance of displacement, considering either the variogram or the DFA, respectively: (3) Var ( x) (4) SD( x)
t 2H t H
In equations 3 and 4, x represents the displacement and exponent H represents the nonlinear function in the range of H = 0–1. These equations express the diffusion property specific to the fBm processes whose characteristics depend on H; a higher H refers to a more diffusive fBm. However, the diffusion can be interpreted as the probabilistic dispersion of the process with respect to its initial position, after a specific time interval t, for multiple repetitions of this process. When fBm is given by H > 0.5, it corresponds to the Brownian motion proportional to the variation of dispended time [3, 6]. While the variogram calculates the average variance of CoP displacement with respect to t, DFA is based on the evaluation of the variability of CoP displacement within variable path lengths and t. DFA corresponds to the average of the standard deviation of the time series; it can be integrated and determined as a function of the path length interval. Due to the integration step included in the analysis, the DFA method directly assesses the serial correlation properties and not the differentiated series as in the variogram. Since equation 4 is predicted to have values of H ranging between 1 and 2, if the series under evaluation is a fBm, H = 0.5 is a borderline value for the diffusion properties of DFA where the analyzed series is non-stationary. Therefore, it was shown that the variogram does not provide the best statistical interpretation for postural control [15, 18]. The concept of velocity-based postural control In this concept, stable upright posture is maintained through intermittent motor control [7]. Postural adjustments occur when univariate CoP instantaneous velocity (AP or ML) crosses a threshold, indicating a change in the CoP displacement trajectory and, consequently, a change in the CoM trajectory to try and keep it inside the BoS. 229
HUMAN MOVEMENT F.M. Portela, E.C. Rodrigues, A. de Sá Ferreira, Position- and velocity-based postural control
Signal acquisition set-up: postural task – bipedal upright stance with open eyes and wide BoS; force platform – AccuSwayPlus (AMTI, USA); sampling frequency – 100 Hz; trial duration – 60 s; signal processing – bias and trend removal followed by a second order low-pass Butterworth filter at 2.5 Hz in direct and reverse order
Figure 2. Quantitative method for assessment of the threshold in velocity-based control of posture; upper panel represents the time series of center of pressure (CoP) velocity in the mediolateral direction (Vx), lower panel shows the time series of CoP velocity in the anteroposterior direction (Vy)
Quantitative method for the analysis of univariate CoP time series The underlying idea of this concept is based on the calculation of CoP instantaneous velocities separately from AP and ML stabilograms and to estimate the CoP velocity boundaries for each axis. Two empirical variables were proposed to determine the threshold for postural adjustments from both CoP velocity time series: 1) the standard deviation of CoP velocity (SDVx and SDVy for the ML and AP directions, respectively) and 2) the average absolute maximal velocity (AAMV) calculated from non-overlapped 2-s epochs of the univariate CoP velocity time series (Figure 2) [19]. Evidence supporting the concept of velocity-based postural control Several studies published before the establishment of the velocity-based theory suggested that velocity information has an important role in the postural control of undisturbed upright stance. In healthy subjects, a coupling was observed between body sway velocity and the velocity of either the supporting surface (corresponding to somatosensory inputs) or a visual display [20, 21]. Other evidence comes from observations finding that absolute angular velocity was the best variable in controlling the vertical position of the body, modelled as an inverted pendulum, on a ‘slack line’ [22]. Therefore, it was suggested that the CNS adopts a postural control strategy that depends on velocity information provided through multisensory integration [23]. Changes in CoM velocity indicate the direction and magnitude of its dis230
placement in the next time steps. Therefore, velocity information seems to be highly useful for the CNS to anticipate CoM position and produce compensatory adjustments through CoP displacement. These facts are corroborated by the known precision of the sensory systems in the perception of velocity information, which respond to instantaneous velocity better than to absolute position [23, 24]. Few studies have applied the velocity-based concept in full, likely due to its relatively recent introduction. A longitudinal study [25] found the estimation of CoP mean velocity in the ML direction to be effective way in assessing the effects of ageing on postural stability. Another study [19] hypothesized that CoP velocity variables are relevant for assessing fall risk in elderly subjects. Based on this hypothesis, a comparative analysis of several quantitative methods for the estimation of various CoP variables (traditional parameters, wavelet transformation, analysis of time series regularity, and analysis of fractal properties) suggested that CoP velocity was a good descriptor to distinguish the nature of the postural task under investigation [17]. A recent study [26] proposed a method to assess the temporal variation in the structure of CoP position and velocity time series and showed that both short-range persistent and long-range anti-persistent behaviors are influenced (but not generated) by CoM movements. In addition, these authors suggested that the proposed method might improve the differentiation of postural adjustments in elderly persons and patients with neurodegenerative diseases.
HUMAN MOVEMENT F.M. Portela, E.C. Rodrigues, A. de Sá Ferreira, Position- and velocity-based postural control
Criticisms of the concept of velocity-based control of posture At present, few objections in the literature were found against this proposed concept, again likely due to its novelty, although many studies have emphasized the need for a more comprehensive research. An initial criticism was based on observation of persistent behavior for short-range CoP velocity time series and anti-persistent for long-range time series using DFA analysis [18]. Considering that the value of t (equations 3 and 4) for which the CoP signal behavior changes from persistent to antipersistent is denominated as crossover, this finding is in agreement with the position-based theory [4, 5] but not with the velocity-based concept [15], as the latter does not describe the crossover phenomenon in time series. Another criticism emerged from the discussion on intermittent versus continuous postural adjustments [22]. The intermittent strategy used for maintaining quasistatic upright posture is based on the assumption that small deviations are not detected by the controlling structures in the CNS but that corrective adjustments are gene rated when the position or velocity exceeds a given threshold, if any [27]. Nevertheless, this velocity-based concept is only a formalized approach based on statistical theories, and its plausibility has not been analyzed at other levels of analysis (e.g. neurological or biomechanical). Research perspectives on kinematic-based concepts in human movement science This debate between the position- and velocity-based concept is centered on the identification of a variable that presents crossover (transition from persistent to antipersistent correlations). Several issues were identified within this review that need consideration in future studies on human postural control. Regarding the position-based concept [4, 5], there is no quantitative method for estimating the spatial limit in the transition between open and closed control loops. Notice also that the actual threshold is the time interval t between successive CoP samples that corresponds with an abrupt change in quadratic displacement behavior. Since postural performance, as described by postural stability variables, is proportional to the CoP area within the BoS, it is necessary to develop methods that locate the spatial limits inside the BoS and can indicate the transition between open- and closed-loops. Regarding the velocity-based theory [7, 19], the more major aspects are related to empirical thresholds. First of all, these thresholds have been estimated for each postural task, but why there is a change in threshold due to changes in sensory information input remains unknown. One may suggest estimating such thresholds from ‘more stable’ postural tasks (e.g. wide BoS with full visual input) and extrapolating them to more challenging postural tasks (e.g. with no visual input, limited BoS, or reduced soma-
tosensory input) as a reference value. Second of all, these thresholds are calculated for CoP univariate time series (stabilogram) and it is not known if this reasoning applies to CoP bivariate time series (statokinesigram). Finally, another important debate concerns the nature of the variable of interest in the velocity-based concept; maximal velocity or velocity SD are related with the crossover theory, while average velocity involves a completely different approach. From this point of view, the problem is not “Is velocity the controlled variable?” but “How is velocity controlled?”. A combination of kinematic variables to understand postural control mechanisms has been proposed as an alternative approach to the usage of a single variable. Indeed, position–velocity analysis is hardly a new method in human movement science. For instance, a phase plane graph (i.e. velocity vs. position) was useful in studying the balance of healthy young adults and patients with bilateral vestibular hypofunction [28]. This phase plane graph also presented good test–retest reliability in several postural tasks (eyes open/closed and rigid surface/ foam) [29]. These studies reinforce the need for the development of quantitative methods that allow the simultaneous assessment of CoP position and velocity, as they appear to be more useful in clinical interpretation and have higher sensitivity and specificity to changes in postural control. In this context, simultaneous assessment implies developing a method that combines CoP position and velocity in the same plot structure and related quantitative/qualitative analysis as in the phase plane graph. Such a simultaneous assessment strongly differs from the current practice of computing several amplitude- and velocity-related parameters from the same CoP signal and interpreting them, since this simple yet useful practice cannot help answer new questions on postural control such as “Where in the BoS is it necessary to increase CoP velocity to prevent falling?” Even combined parameters such as a frequency measure (calculated as the ratio of CoP velocity/position) may not contribute to answering this question. This question is legitimized by speculation that velocity-based postural control occurs in the central region of the stabilogram, where CoP instantaneous velocity attains maximal absolute values [7]. Based on the present review, it is suggested that the joining of kinematic variables in a single method may be particularly useful. On the one hand, high CoP velocities should be avoided near the boundaries of the base of support since there may be no time for efficient postural adjustment at such a location [30]. On the other hand, high CoP velocities near the boundaries of the base of support may be necessary to quickly redirect the body’s CoM towards the egocentric reference of posture in more challenging conditions or after a fall is initiated. Therefore, as a ‘scientific exercise’, a graphical method for the simultaneous assessment of CoP position and velocity is depicted in Figure 3. This graphical method uses the 231
HUMAN MOVEMENT F.M. Portela, E.C. Rodrigues, A. de Sá Ferreira, Position- and velocity-based postural control
Figure 3. Schematic suggestion of a quantitative method for the simultaneous assessment of CoP position and velocity; stabilograms in the anteroposterior (y axis – AP) and mediolateral (x axis – ML) directions are used to ‘map’ the corresponding location of the sampled time series of CoP velocity into the statokinesigram
AP and ML coordinates of CoP to map the parameters derived from CoP instantaneous velocity in the instantaneous CoP position on the statokinesigram (e.g. mean or maximal velocity). The threshold for CoP velocity also may be used to map only those CoP coordinates that crossed the estimated threshold. Quantitative parameters could be derived for research on its diagnostic value in populations at a high risk of falling. In this way, the spatial distribution of CoP velocity might be studied as it relates to the CoP position inside the BoS. Although these two concepts are apparently mutually exclusive, they apply a common framework and rationale explaining their assumptions and respective quantitative methods for studying postural control, which include the 1) determination of the biomechanical relationships between CoM and CoP, 2) estimation of the variables from CoP time series as acquired from force platforms, and 3) delimitation of an empirical threshold. The large amount of information derived from stabilometric tests that could be particularly useful in clinical practice is contrasted with the enormous difficulty involved in the interpretation such data in both concepts. Therefore, the results of experimental and clinical studies using the above-cited must be interpreted considering the current understanding of their characteristics and limitations. Acknowledgments We would like to thank our reviewers for their helpful comments and suggestions.
References 1. Winter D.A., Human balance and posture control during standing and walking. Gait Posture, 1995, 3 (4), 193–214, doi: 10.1016/0966-6362(96)82849-9. 2. Juras G., Stomka K., Fredyk A., Sobota G., Bacik B., Evaluation of the limits of stability (LOS) balance test. J Hum Kinet, 2008, 19, 39–52, doi: 10.2478/v10078-008-0003-0. 232
3. Duarte M., Freitas S.M.S.F., Revision of posturography based on force plate for balance evaluation. Rev Bras Fisioter, 2010, 14 (3), 183–192, doi: 10.1590/S141335552010000300003. 4. Collins J.J., De Luca C.J., Open-loop and closed-loop control of posture: A random-walk analysis of center-ofpressure trajectories. Exp Brain Res, 1993, 95 (2), 308–318, doi: 10.1007/BF00229788. 5. Collins J.J., De Luca C.J., Random walking during quiet standing. Phys Rev Lett, 1994, 73 (5), 764–767, doi: 10.1103/ PhysRevLett.73.764. 6. Duarte M., Zatsiorsky V.M., Effects of body lean and visual information on the equilibrium maintenance during stance. Exp Brain Res, 2002, 146 (1), 60–69, doi: 10.1007/s00221002-1154-1. 7. Delignières D., Torre K., Bernard L.P., Transition from persistent to anti-persistent correlations in postural sway indicates velocity-based control. PLoS Comput Biol, 2011, 7 (2), e1001089, doi: 10.1371/journal.pcbi.1001089. 8. Baratto L., Morasso P.G., Re C., Spada G., A new look at posturographic analysis in the clinical context: sway-density versus other parameterization techniques. Motor Control, 2002, 6 (3), 246–270. 9. Rougier P., Influence of visual feedback on successive control mechanisms in upright quiet stance in humans assessed by fractional Brownian motion modeling. Neurosci Lett, 1999, 266 (3), 157–160, doi: 10.1016/ S0304-3940(99)00272-4. 10. Gatev P., Thomas S., Kepple T., Hallet M., Feedforward ankle strategy of balance during quiet stance in adults. J Physiol, 1999,514(3),915–928,doi:10.1111/j.1469-7793.1999.915ad.x. 11. Mello R.G.T., Oliveira L.F., Nadal J., Anticipation mechanism in body sway control and effect of muscle fatigue. J Electromyogr Kinesiol, 2007, 17 (6), 739–746, doi: 10.1016/j.jelekin.2006.08.011. 12. Norris J.A., Marsh A.P., Smith I.J., Kohut R.I., Miller M.E., Ability of static and statistical mechanics posturographic measures to distinguish between age and fall risk. J Biomech, 2005, 38 (6), 1263–1272, doi: 10.1016/j.jbiomech.2004.06.014. 13. van den Heuvel M.R.C., Balasubramaniam R., Daffertshofer A., Longtinc A., Beeka P.J., Delayed visual feedback
HUMAN MOVEMENT F.M. Portela, E.C. Rodrigues, A. de Sá Ferreira, Position- and velocity-based postural control
reveals distinct time scales in balance control. Neurosci Lett, 2009, 452 (1), 37–41, doi: 10.1016/j.neulet.2009.01.024. 14. Mitchell L.S., Collins J.J., De Luca C.J., Burrows A., Lipsitz L.A., Open-loop and closed-loop postural control mechanisms in Parkinson’s disease: increased mediolateral activity during quiet standing. Neurosci Lett, 1995, 197 (2), 133–136, doi: 10.1016/0304-3940(95)11924-L. 15. Delignières D., Deschamps T., Legros A., Caillou N., A methodological note on nonlinear time-series analysis: Is open- and closed-loop model of Collins and De Luca (1993) a statistical artifact? J Motor Behav, 2003, 35 (1), 86–96, doi: 10.1080/00222890309602124. 16. Kirchner M., Schubert P., Schmidtbleicher D., Haasb T.C., Evaluation of the temporal structure of postural sway fluctuations based on a comprehensive set of analysis tools. Physica A, 2012, 391 (20), 4692–4703, doi: 10.1016/j. physa.2012.05.034. 17. Rougier P.R., What insights can be gained when analysing the resultant centre of pressure trajectory? Clin Neurophysiol, 2008, 38 (6), 363–373, doi: 10.1016/j.neucli.2008.09.006. 18. Blázquez M.T., Anguiano M., Saavedra F.A., Lallena A.M., Carpena P., Study of the human postural control system during quiet standing using detrended fluctuation analysis. Physica A, 2009, 388 (9), 1857–1866, doi: 10.1016/j. physa.2009.01.001. 19. Delignières D., Torre K., Bernard L.P., Interest of velocity variability and maximal velocity for characterizing centerof-pressure fluctuations. Science Motricité, 2011, 74 (3), 31–37, doi: 10.1051/sm/2011107. 20. Jeka J., Oie K., Schöner G., Dijkstra T., Henson E., Position and velocity coupling of postural sway to somatosensory drive. J Neurophysiol, 1998, 79 (4), 1661–1674. 21. Kiemel T., Oie S.K., Jeka J.J., Multisensory fusion and the stochastic structure of postural sway. Biol Cybern, 2002, 87 (4), 262–277, doi: 10.1007/s00422-002-0333-2. 22. Paoletti P., Mahadevan L., Balancing on tightropes and slacklines. J R Soc Interface, 2012, 9 (74), 2097–2108, doi: 10.1098/rsif.2012.0077. 23. Masani K., Popovic M.R., Nakazawa K., Kouzaki M., Nozaki D., Importance of body sway velocity information in controlling ankle extensor activities during quiet stance. J Neurophysiol, 2003, 90 (6), 3774–3782, doi: 10.1152/ jn.00730.2002.
24. Jeka J., Kiemel T., Creath R., Horak F., Peterka R., Controlling human upright posture: velocity information is more accurate than position or acceleration. J Neurophysiol, 2004, 92 (4), 2368–2379, doi: 10.1152/jn.00983.2003. 25. Du Pasquier R.A., Blanc Y., Sinnreich M., Landis T., Burkhard P., Vingerhoets F.J.G., The effect of aging on postural stability: a cross sectional and longitudinal study. Clin Neurophysiol, 2003, 33 (5), 213–218, doi: 10.1016/j.neucli.2003.09.001. 26. Ihlen E.A.F., Skjæret N., Vereijken B., The influence of center-of-mass movements on the variation in the structure of human postural sway. J Biomech, 2012, 46 (3), 484–490, doi: 10.1016/j.jbiomech.2012.10.016. 27. Insperger T., Milton J., Stépán G., Acceleration feedback improves balancing against reflex delay. J R Soc Interface, 2013, 10 (79), 20120763, doi: 10.1098/rsif.2012.0763. 28. Riley P.O., Benda B.J., Gill-Body K.M., Krebs D.E., Phase plane analysis of stability in quiet standing. J Rehabil Res Dev, 1995, 32 (3), 227–235. 29. Moghadam M., Ashayeri H., Salavati M., Sarafzadeh J., Taghipoor K.D., Saeedi A. et al., Reliability of center of pressure measures of postural stability in healthy older adults: effects of postural task difficulty and cognitive load. Gait Posture, 2011, 33 (4), 651–655, doi: 10.1016/j. gaitpost.2011.02.016. 30. Riccio G.E., Information in movement variability about the qualitative dynamics of posture and orientation. In: Newell K.M., Corcos D.M. (eds.), Variability and Motor Control. Human Kinetics, Champaign 1993, 317–357.
Paper received by the Editor: August 5, 2013 Paper accepted for publication: November 7, 2014 Correspondence address Arthur de Sá Ferreira Postgraduate Program in Rehabilitation Science Augusto Motta University Center/UNISUAM Praça das Nações 34, 3o andar Bonsucesso CEP 21041-020, RJ – Brazil e-mail:
[email protected] [email protected]
233
HUMAN MOVEMENT 2014, vol. 15 (4), 234– 237
Sports massage therapy on the reduction of delayed onset muscle soreness of the quadriceps femoris doi: 10.1515/humo-2015-0017
Dariusz Boguszewski 1 *, Sylwia Szkoda 2 , Jakub Grzegorz Adamczyk 1, 3, Dariusz Białoszewski 1 1
Department of Rehabilitation, Physiotherapy Division, Medical University, Warsaw, Poland Students Scientific Society of Physiotherapy, Medical University, Warsaw, Poland 3 Department of Theory of Sport, Józef Piłsudski University of Physical Education, Warsaw, Poland 2
Abstract
Purpose. Massage therapy is one of most commonly applied treatments during athletic training. The aim of this study was to assess the effectiveness of sports massage therapy on reducing post-exercise quadriceps muscle soreness. Methods. A sample of 29 women aged 24–26 years was divided into an experimental group (n = 15) receiving classic sports massage therapy and a control group (n = 14) given no treatment. An exercise session consisting of five sets of deep squat jumps was administered after which lower limb power as assessed via the vertical jump test. Muscle soreness was assessed using the visual analogue scale (VAS) and exercise intensity with the Borg Rating of Perceived Exertion Scale. Subsequent measurements of lower limb power and muscle soreness were performed 24, 48, 72 and 96 h after the exercise session. Differences between the measurements were assessed by the Friedman and least significant difference tests while between-group comparisons involved the Mann–Whitney U test. Results. The largest decrease in lower limb power was observed between the first measurement after the exercise session and 24 h later (p < 0.01). The smallest decrease in power was observed in the massage group. The highest levels of muscle soreness were noted 24 h post-exercise in the massage group and 48 h post-exercise in the control group. The experimental group showed a decrease in muscle soreness in each subsequent measurement, with the results close to zero on the VAS 96 h postexercise. Conclusions. Massage therapy quickened recovery and improved muscle efficiency post-exercise and may serve as an effective treatment of muscle soreness. The analgesic effect of massage suggests it should be widely applied in sport, physical therapy and rehabilitation. Key words: massage, DOMS, quadriceps femoris muscle, recovery
Introduction Sports massage therapy is based on the classic Swedish massage and used in the rehabilitation of athletes, during the physical training process and to aid recovery. This massage is performed manually using techniques individually adapted to a given sport and dependent on the training phase [1]. One of the aims of sports massage therapy is to prevent the onset of pathologies resulting from overtraining, a common problem in competitive sport. It can be combined with other physiotherapy treatments including sauna, diadynamic currents, water and salt baths, paraffin compresses, and ultrasound and light therapies [1, 2]. Massage therapy produces numerous local and systemic effects. Locally, massaged tissue shows increased blood and lymph flow. Systemic effects are induced over time and benefit the circulatory, nervous and endocrine systems. Massage therapy, using suitable techniques, has been found to improve muscle and cutaneous tissue as well as the functioning of the excretory, respiratory and alimentary systems [3–6].
* Corresponding author. 234
One of the body’s responses to massage is a rise in the temperature of the massaged area by approximately 1.5–1.8°C. This effect is considered beneficial and used to help prepare athletes for optimal performance, such as by increasing muscular effort and starting efficiency before competition [7–9]. The centripetal, intracardiac direction of massage strokes accelerate the displacement of blood from venous and capillary vessels, allowing massaged tissue to quickly remove metabolic waste products and absorb nutrients more efficiently, mechanisms which are considered to be particular useful in post-exercise recovery [9–13]. However, the results of research on the effectiveness of massage are not univocal [14, 15]. Therefore, the aim of this study was to assess the effectiveness of sports massage in the reduction of delayed onset muscle soreness of the quadriceps femoris. Material and methods Twenty-nine women aged from 24 to 26 years were recruited. The sample was randomly divided into two groups: Group I (n = 15) received sports massage treatment after exercise. Group II (n = 14) was treated as the control and not subjected to any recovery treatment (Table 1). All participants provided their written informed consent.
HUMAN MOVEMENT D. Boguszewski, S. Szkoda, J.G. Adamczyk, D. Białoszewski, Sports massage in post-exercise recovery
Tabela 1. Characteristics of the participants (mean ± SD)
Group I (massage) Group II (control)
Participants (n)
Age (years)
Body mass (kg)
Body height (cm)
15 14
24.6 ± 1 24.8 ± 1.4
57.3 ± 5.0 57.0 ± 5.3
166.8 ± 0.6 165.8 ± 0.6
Massage effects on lower limb power were investigated by using the vertical jump test after a squat jump exercise session. A subjective assessment of the level of post-exercise pain (muscle soreness) was performed using the visual analogue scale (VAS) [16]. Additional measures included heart rate before (at rest) and after the exercise session and an evaluation of training intensity using the Borg Rating of Perceived Exertion Scale [14]. The study procedure involved Groups I and II performing five sets of deep squat jumps at 60–100% maximum ability. The first set was performed until exhaustion, sets 2–4 were performed at 60–80% of their repetition maximum from the first set and the fifth set was again performed again until exhaustion. Lower limb power was then assessed by the vertical jump test and soreness intensity was rated using the VAS (Measurement 1). The power values recorded in Measurement 1 were treated as 100%. The vertical jump test and VAS was then administered 24 h (Measurement 2), 48 h (Measurement 3), 72 h (Measurement 4) and 96 h (Measurement 5) after the initial squat jump exercise session. The experimental group received massage treatment approximately 2 h after each measurement. A sports massage involving manual therapy of the thigh muscles was performed by a physiotherapist. Treatment lasted approximately 20 min (10 min on each lower limb) while the participant lay on their back. Massage techniques included sliding, effleurage, rubbing, kneading and vibration [1]. Basic descriptive statistics (arithmetic mean and standard deviation) were calculated for all measures. Differences between vertical jump performance measurements were examined using the Friedman test with post-hoc testing via Fisher’s least significance difference. Between-group differences were assessed using the Mann–Whitney U test. Statistical significance was set for all statistical procedures at p 0.05. Results In both groups, the greatest statistically significant decrease in lower limb power was observed between Measurements 1 and 2. This trend was maintained up to 48 hours (Measurement 3) after the exercise session in the control group. The greatest improvement in power was noted between Measurements 3 and 4 in the massage group. Participants in this group also produced similar levels of power in the last measurement compared with the first (Figure 1). The level of muscle soreness was rated the highest in Measurement 2, or 24 h post-exercise, by the massage
102% Group I
100%
Group II
98% 96% 94% 92% 90% 88% 1
2
3 Measurement
4
5
Figure 1. Lower limb power output via vertical jump testing (the results of Measurement 1 were treated as 100%) 9 Group I Group II
8 7 6 [VAS]
Group
5 4 3 2 1 0 1
2
3 Measurement
4
5
Figure 2. Level of muscle soreness based on visiual analogue scale (VAS)
group. In turn, the control group rated soreness the highest in Measurement 3. A significant decrease in muscle pain was noted in the massage group in each subsequent day, where on the last day of testing (Measurement 5) the level of pain was close to zero. The control group declared higher levels of pain in all measurements (p < 0.001) compared with the experimental group except for the initial measurement (Figure 2). No significant between-group differences were observed for resting or post-exercise heart rate. Exercise intensity measured with the Borg Scale was rated similarly by all participants (15.87 by Group I vs. 15.43 by Group II). Discussion Massage has been practiced as a form of therapy since antiquity. Today, the effects of massage on the body are the subject of numerous studies, from exploring its physiological mechanisms to quantifying mental effects [9, 13, 17, 18]. Huang [15] studied the effects of short 10- and 235
HUMAN MOVEMENT D. Boguszewski, S. Szkoda, J.G. Adamczyk, D. Białoszewski, Sports massage in post-exercise recovery
30-s massage on thigh muscles (semimembranosus, semitendinosus and biceps femoris) and observed an improvement in hip joint range of motion, concluding that massage can serve as an alternative to static stretching. Wälchli et al. [5] demonstrated that rhythmical massage can produce a rise in surface temperature and increased heart rate variability and sympathetic stimulation. Long-term effects included an improvement in warmth distribution and stabilized resting heart rate. According to Goats [19], classic massage therapy should be applied in cases of prolonged inflammation, slowed healing or impeded lymphatic drainage. This author ascertained that a series of massage treatments can help with pain relief, restore muscle efficiency, and improve musculoskeletal system function. The effectiveness of massage on reducing muscle soreness was studied by Willems et al. [12], finding massaged limbs recover quicker and exhibit less pain. Similar conclusions were reached by Zainuddin et al. [13], who showed a reduction in swelling as a result of massage therapy. The results of the present study confirm the above observations. The results also give credence to the idea that the possible benefit of massage therapy is in based on the increase in tissue temperature. The results of an experiment conducted by Petrofsky et al. [20] demonstrated that both dry and moist heat were very effective in reducing pain and muscle damage after exercise. However, there are reports in the literature that do not confirm the health effects of post-exercise massage therapy. Robertson et al. [21] evaluated the effects of lower limb massage on recovery after intensive exercise on an ergometer. No measurable physiological effects were observed after massage therapy when compared with passive rest [21]. Another example was provided by Dawson et al. [22], who examined the influence of massage on lower limb power, swelling and pain after a half-marathon. No significant differences (p > 0.05) were found, although an improvement in over half of the examined subjective measures may indicate that massage instead provides a powerful psychological effect. In this regard, the mental benefits of massage have been confirmed in many studies. The reduction in anxiety as a result of massage has been explained by increased secretion of endorphins and loosening tense muscle groups [17, 18, 23]. The relaxing effect of massage has been hypothesized to be two-sided in that it affects both mind and body. By decreasing muscle tension and improving blood circulation, massage induces feelings of relaxation and reduces pain [12, 19]. Such an improved state of mind was found to increase pain tolerance and performance [3, 23, 24] and may explain the results obtained in the present investigation. Although the present results indicate that sports massage therapy helps reduce muscle soreness, the study has a number of limitations including the small sample size and the fact that muscle soreness was assessed subjectively. Accordingly, future research on the benefits of 236
massage should include larger and more diverse samples (including males) and apply more objective investigative tools. One method with promising results is the use of infrared imaging, as it can non-invasively monitor changes in body surface temperature [25]. Conclusions Massage therapy quickened recovery and improved muscle efficiency and may serve as an effective treatment of muscle soreness, especially during the competitive season when athletes must perform at maximum levels with limited rest. Massage therapy induced an accelerated reduction in soreness after supramaximal effort. One of the main advantages of massage appears to be its analgesic effect and suggests it should be widely applied in sport, physical therapy and rehabilitation. The results of the present study indicate the need for additional research including a larger sample and the utilization of more objective investigative tools. References 1. Benjamin P.J., Lamp S.P., Understanding Sports Massage. Human Kinetics, Champaign 2005. 2. Bompa T.O., Haff G.G., Periodization. Theory and methodology of training. Human Kinetics, Champaign 2009. 3. Arroyo-Morales M., Fernández-Lao C., Ariza-García A., Toro-Velasco C., Winters M., Díaz-Rodríguez L. et al., Psychophysiological effects of preperformance massage before isokinetic exercise. J Strength Cond Res, 2011, 25 (2), 481–488, doi: 10.1519/JSC.0b013e3181e83a47. 4. Walaszek R., Kasperczyk T., Nowak Ł., Influence of classic massage on blood pressure and pulse in 21–26 year olds. Physiotherapy, 2009, 17 (1), 11–19, doi: 10.2478/v10109009-0037-4. 5. Wälchli C., Saltzwedel G., Kruerke D., Kaufmann C., Schnorr B., Rist L. et al., Physiologic effects of rhythmical massage: a prospective exploratory cohort study. J Altern Complement Med, 2014, 20 (6), 507–515, doi:10.1089/ acm.2012.0833. 6. Zeitlin D., Keller S.E., Shiflett S.C., Schleifer S.J., Bartlett J.A., Immunological effect of massage therapy during academic stress. Psychosom Med, 2000, 62 (1), 83–84. 7. Beyleroglu M., Kolayis H., Ramazanoglu F., Hazar M., Cenk A., Bajorek W., Relation between warm-up with massage before competition and the result of the struggle and performance boxers. Arch Budo, 2009, 5, 25–27. 8. Boguszewski D., Kwapisz E., Sports massage and local cryotherapy as a way to reduce negative effects of rapid weight loss among kickboxing contestants. Arch Budo, 2010, 6 (1), 45–51. 9. Weerapong P., Hume P.A., Kolt G.S., The mechanisms of massage and effects on performance, muscle recovery and injury prevention. Sports Med, 2005, 35, 235–256, doi: 10.2165/00007256-200535030-00004. 10. Best T.M., Hunter R., Wilcox A., Haq F., Effectiveness of sports massage for recovery of skeletal muscle from strenuous exercise. Clin J Sport Med, 2008, 18 (5), 446–460, doi: 10.1097/JSM.0b013e31818837a1.
HUMAN MOVEMENT D. Boguszewski, S. Szkoda, J.G. Adamczyk, D. Białoszewski, Sports massage in post-exercise recovery
11. Hart J.M., Swanik B.C., Tierney R.T., Effects of sport massage on limb girth and discomfort associated with eccentric exercise. J Athl Train, 2005, 40 (3), 181–185. 12. Willems M.E.T., Hale T., Wilkinson C.S., Effects of manual massage on muscle specific soreness and single leg jump performance after downhill treadmill walking. Med Spor, 2009, 13 (2), 61–66, doi: 10.2478/v10036-009-0011-8. 13. Zainuddin Z., Newton M., Sacco P., Nosaka K., Effects of massage on delayed-onset muscle soreness, swelling and recovery of muscle function, J Athl Train, 2005, 40 (3), 174–180. 14. Carvalho V.O., Bocchi E.A., Guimarães G.V., The Borg scale as an important tool of self-monitoring and selfregulation of exerciseprescription in heart failure patients during hydrotherapy. A randomized blinded controlled trial. Circ J, 2009, 73 (10), 1871–1876, doi: 10.1253/circj. CJ-09-0333. 15. Huang S.Y., Di Sonato M., Wadden K.P., Cappa D.F., Alkanani T., Behm D.G., Short-duration massage at the hamstrings musculotendinous junction induces greater range of motion. J Strength Cond Res, 2010, 24 (7), 1917– 1924, doi: 10.1519/JSC.0b013e3181e06e0c. 16. Hawker G.A., Mian S., Kendzerska T., French M., Measures of adult pain: Visual Analog Scale for Pain (VAS Pain), Numeric Rating Scale for Pain (NRS Pain), McGill Pain Questionnaire (MPQ), Short-Form McGill Pain Questionnaire (SF-MPQ), Chronic Pain Grade Scale (CPGS), Short Form-36 Bodily Pain Scale (SF-36 BPS), and Measure of Intermittent and Constant Osteoarthritis Pain (ICOAP). Arthritis Care Res, 2011, 63 (Suppl. 11), 240–252, doi: 10.1002/acr.20543. 17. Boguszewski D., Boguszewska K., Kwapisz E., Adam czyk J.G., Urbańska N., Białoszewski D., The effect of sport massage on the mental disposition in kickboxing and judo competitors, reducing their body mass prior to competitions. J Combat Sports Martial Arts, 2012, 3 (2), 91–93, doi: 10.5604/20815735.1047654. 18. Hemmings B.J., Physiological, psychological and performance effects of massage therapy in sport: a review of the literature. Phys Ther Sport, 2001, 2 (4), 165–170, doi: 10.1054/ptsp.2001.0070.
19. Goats G.C., Massage – the scientific basis of an ancient art: Part 2. Physiological and therapeutic effects. Br J Sports Med, 1994, 28 (3), 153–156, doi: 10.1136/bjsm.28.3.153. 20. Petrofsky J.S., Berk L.S., Bains G., Khowailed I.A., Hui T., Granado M. et al., Moist heat or dry heat for delayed onset muscle soreness. J Clin Med Res, 2013, 5 (6), 416–425, doi: 10.4021/jocmr1521w. 21. Robertson A., Watt J.M., Galloway S.D.R., Effects of leg massage on recovery from high intensity cycling exercise. Br J Sports Med, 2004, 38 (2), 173–176, doi: 10.1136/ bjsm.2002.003186. 22. Dawson L.G., Dawson K.A., Tiidus P.M., Evaluating the influence of massage on leg strength, swelling, and pain following a half- marathon. J Sports Sci Med, 2004, 3 (YISI 1), 37–43. 23. Boguszewski D., Dąbek A., Korabiewska I., Białoszewski D., Relation between back massage and anxiety level. New Medicine, 2010, 13 (1), 18–21. 24. Arabaci R., Acute effects of pre-event lower limb massage on explosive and high speed motor capacities and flexibility. J Sports Sci Med, 2008, 7 (4), 549–555. 25. Al-Nakhli H.H., Petrofsky J.S., Laymon M.S., Berk L.S., The use of thermal infra-red imaging to detect delayed onset muscle soreness. J Vis Exp, 2012, 22 (59), e3551, doi: 10.3791/3551.
Paper received by the Editor: October 8, 2014 Paper accepted for publication: November 12, 2014 Correspondence address Dariusz Boguszewski Zakład Rehabilitacji Warszawski Uniwersytet Medyczny ul. Żwirki i Wigury 81 02-091 Warszawa, Poland e-mail:
[email protected]
237
HUMAN MOVEMENT 2014, vol. 15 (4), 238– 242
EVALUATION OF BAREFOOT RUNNING IN PREADOLESCENT ATHLETES
doi: 10.1515/humo-2015-0018
Theophilos Pilianidis *, Nikolaos Mantzouranis, Nikolaos Siachos School of Physical Education and Sport Science, Democritus University of Thrace, Greece
Abstract
Purpose. The literature shows few studies on shod and unshod running performance in athletes, with most limited to laboratory settings. The aim of this study was to evaluate preadolescent 1000 m running performance when barefoot and in running spikes or training shoes. Methods. A sample of 22 boys and 21 girls aged 10.6 ± 1.1 years was recruited. Anthropometric data and VO2max were recorded when completing the three study protocols in a counter balanced design. Student’s t tests were applied to compare mean 1000 m finish times while ANOVA was used to evaluate sex differences between the protocols. Pearson's correlation analysis measured interactions between the finish times, anthropometric variables, and VO2max. Results. Running performance with spikes (4.58 min) was significantly better than with training shoes (5.21 min) and barefoot (5.18 min). Male 1000 m times were overall better than the females. A substantial effect of VO2max and body fat on performance was found in all protocols. Conclusions. Preadolescent endurance performance was not significantly different between training shoes and barefoot; this may serve as an incentive for future research on the training of developmental age runners. Key words: efficiency, running events, adolescence, performance
Introduction Although humans have been running for millions of years, the concept of the modern running shoe did not take form until the 1970s. During the largest part of human evolutionary history, runners were either barefoot or wore minimal footwear such as sandals or moccasins with low heels and little cushioning [1]. In the last 40 years, sports scientists have focused on evaluating the running stride characteristics of athletes wearing training or competition shoes and barefoot [2]. Laboratory studies have shown that the energy cost of running is reduced by approximately 4% when the feet are not shod. In spite of these apparent benefits, barefoot running is rare in competition and there are no published controlled trials concerning the effects of running barefoot on simulated or real competitive performance. Some authors have stressed that the interaction between the shoe and surface is important, with this aspect now well accepted [3]. In running events, it was reported that training foot wear should be considered more as a protective device (from dangerous objects or painful impacts) than a corrective device, as their capacity for shock absorption and control of over-pronation is limited [4]. Modern running footwear is credited with generally reducing sensory feedback without diminishing injury-induced impact, leading to what has been described as a “perceptual illusion” of athletic footwear safety [5]. Other studies on oxygen consumption found that running at 12 km/h in shoes weighing * Corresponding author. 238
700 g showed 4.7% higher values than in bare feet. While an increase in oxygen consumption of ~4% is of little importance to the recreational runner, the competitive athlete would notice a major effect on running speed [6]. In the majority of endurance athletes who train with shoes, foot strike occurs with the heel whereas during barefoot running the foot first makes contact with the ball of the foot and ends with the heel [7]. Barefoot running may induce an adaptation that transfers impacts to the yielding musculature, thus sparing the fascia and accounting for the low incidence of plantar fasciitis in barefoot runners [8]. When running barefoot on hard surfaces, one study found runners compensate for the lack of cushioning underfoot by plantar flexing the foot at contact, thus providing a softer landing [9]. Barefoot runners may also land midfoot, increasing the work of the foot’s soft tissue support structures and thereby increasing their strength and possibly reducing the risk of injury [10]. A great part of foot wear manufacturers’ technology is devoted to designing preadolescent and adolescent training and competitive shoes [11]. Contemporary athletic shoes appear to attenuate loading since long-axis tibial acceleration was found to be reduced during shod running in children [12]. In addition, in preadolescent and adolescent athletes, those running shod were recorded with an increase in the prevalence of a rear foot strike pattern from 62% when barefoot to 97% when wearing training shoes [13]. Furthermore, it was recently presented that slimmer and more flexible children’s shoes do not change foot motion as much as conventional shoes and could therefore be generally recommended for children [14].
HUMAN MOVEMENT T. Pilianidis, N. Mantzouranis, N. Siachos, Evaluation of barefoot running
Interestingly, the majority of today’s world-class middle- and long-distance runners who originated from East Africa were trained barefoot during their developmental age. However, very limited studies have evaluated shod and unshod running performance in preadolescent runners and those available were implemented only in laboratory conditions [15, 16]. Due to the fact that training with spikes is also widely used in running events, the aim of the present study was to evaluate 1000 m running times in a sample of preadolescent boys and girls while wearing training shoes, running shoes with spikes, and while barefoot. Material and methods A total of 43 preadolescents aged 10.6 ± 1.1 years were recruited from three local athletics clubs. The sample consisted of 22 boys and 21 girls with 1.5 ± 1 years of athletics experience, exercising at least four times per week. None of the participants had any previous barefoot running experience. Written informed consent was obtained after the experimental protocol was fully explained to each participant although the true purpose of the study was not revealed. Parents or guardians were also informed about the study and provided their written informed consent. The study was performed according to the guidelines of the Ethics Committee of the Democritus University of Thrace in Greece. Upon reporting to the laboratory, the participants received verbal information as to the testing procedures. Age, training experience, body mass and height, body fat, thigh and calf circumferences, and foot length were recorded and VO2max was estimated. Participants were required to complete three trials of running 1000 m wearing training shoes, spikes, and barefoot. The task order was counterbalanced and each trial was separated with 72 hours rest. Participants were instructed to complete the 1000 m runs as fast as they could. Testing was conducted during the competitive season on the same 400 m synthetic surface (16 mm thick rubber) track the participants practiced on. Testing protocols were completed at the same time of day in identical testing conditions with ambient temperatures ranging from 22° to 25°C. Prior to the 1000 m runs, the athletes performed a standardized warm-up which included 20 min of jogging, stretching and dynamic exercises for the lower limbs, and 6 × 50–100 m runs. Running times were recorded electronically with a Performance Pack (model 63520, Lafayette, USA) with the use of two pairs of 63501 Rinfrared photocell switches of the same manufacturer placed at the starting line and at the 1000m finish line. Time was measured according to the current procedures for international competitions. VO2max was estimated with the Multistage 20 m ShuttleRun Aerobic Test (MSRAT20m) and involved a portable CD player, a CD supplied with a booklet, measuring tape, and marker cones [17, 18]. Subcutaneous fat was
measured with a Harpenden Skin fold caliper (Baty International, UK), on the right side of the body. Body fat was determined from the sum of two skin fold thicknesses to the nearest 1 mm. Body mass was measured to the nearest 100 g on a calibrated floor scale (model 770, Seca, Germany) while standing shoeless with arms relaxed and wearing only light sportswear. Height was measured while barefoot with a stadiometer (model 240, Seca, Germany) to the nearest 0.1 cm with the head in Frankfort horizontal plane. Basic descriptive statistics were calculated for all variables. Scatter plots were used to determine whether a linear model was suitable for analyzing running performance in the three protocol conditions. One-sample Student’s t tests were applied to compare mean finish 1000 m times when running with training shoes, spikes, and barefoot. One-way analysis of variance in a 2 × 3 design with post-hoc Bonferroni corrections was employed to evaluate the differences among 1000 m finish times in all study protocols depending on sex. In addition, Receiver Operating Characteristic (ROC) curves were utilized in order to illustrate the discrimination between 1000 m times with training shoes, spikes, and barefoot relative to sex. Pearson’s correlation coefficients were calculated to measure the linearity of the interactions between the variables: finish time, anthropometry (height, body mass, body fat, lower limb circumferences, foot length), and VO2max. All statistical analyses were performed with PASW Statistics 18 (SPSS, USA). Statistical significance was defined at 5% (p < 0.05). Results The physical and physiological characteristics of the sample are presented in Table 1. Student’s t tests showed that the preadolescent runners showed significantly better finish times in the 1000 m with the running spikes (4.58 ± 0.7 min) than with training shoes (5.21 ± 0.7 min) and barefoot (5.18 ± 0.8 min); t(1.42) = 44.51, p = 0.001. ANOVA showed no significant differences for sex among all study protocols. In spite of the fact that the males’ mean performance with spikes (4.46 ± 0.4 min) was better than with training shoes (5.15 ± 0.3 min) and barefoot (5.05 ± 0.5 min), ANOVA did not confirm any statistically significant differences; F(1.21) = 1.19, p = 0.28. Similarly, the females showed no significant differences between training shoe (5.29 min), spike (5.09 min), and barefoot (5.30 min) finish times; F(1.22) = 1.25, p = 0.27. Post-hoc Bonferroni comparisons showed that only the finish time of males with spikes (4.46 min) was significantly better than the female group’s times with training shoes (5.29 min) and barefoot (5.30 min). ROC curves classifying the parameters of the three study protocols in the male group showed that they did not coincide with the reference no-discrimination line, precluding selection bias. The area under the curve (AUC) showed more true positives running with training shoes 239
HUMAN MOVEMENT T. Pilianidis, N. Mantzouranis, N. Siachos, Evaluation of barefoot running
Table 1. Mean (95% CI) physical and physiological characteristics of study participants Variables Age (years) Body mass (kg) Height (cm) Body fat (%) Thigh circumference (cm) Calf circumference (cm) Foot length (cm) VO2max (ml/kg/min)
Males
Females
10.6 (10.1–11.1) 36.7 (32.7–40.7) 144 (139–149) 15.5 (13.4–17.7) 39.2 (37.7–40.8) 28.7 (27.7–29.8) 21.6 (20.7–22.4) 36.8 (34.4–39.3)
10.7 (10.2–11.1) 41 (36–45.9) 148 (143–153) 21.4 (18.3–24) 42.8 (40.3–45.4) 30.8 (29.2–32.3) 22 (21.4–22.7) 34.5 (32.9–3.2)
Training shoes Spikes Barefoot Reference line
True positive rate
True positive rate
Training shoes Spikes Barefoot Reference line
False positive rate
False positive rate
Figure 1. ROC curve intercept for boys 1000 m running performance with training shoes, spikes and barefoot
Figure 2. ROC curve intercept for girls 1000 m running performance with training shoes, spikes and barefoot
(0.46, p = 0.69) than when barefoot (0.45, p = 0.60) or with spikes (0.44, p = 0.48). Similar to the above, binary classifier analysis illustrated that the testing protocols in females did not coincide with the discrimination threshold, also indicating a lack of bias. The AUC indicated stronger evidence for an actual positive state in females’ running performance with spikes (0.56, p = 0.48) compared with barefoot (0.54, p =0.61) or training shoes (0.53, p = 0.69). Evaluation of the testing protocols by applying ROC analysis for sex is illustrated in Figures 1 and 2. Pearson’s correlation analysis showed significant intercorrelations only among finish time, VO2max, and body fat in all study protocols. The correlation between running performance with training shoes and VO2max was as high as 0.73 (p < 0.001), while the correlation between running performance with training shoes and body fat percentage was found to be average (0.45, p < 0.05). Furthermore, Pearson’s r values between barefoot performance and VO2max were found to be high (–0.63, p < 0.001), while the correlation between body fat percentage and barefoot performance was average (0.46, p < 0.05). Similarly, the obtained values in-
dicated significant correlations between running performance with spikes and lean body mass (0.45, p < 0.05) as well as between VO2max and running performance with spikes (–0.65, p < 0.05). The correlation coefficients for the shod and unshod conditions and between the physical and physiological parameters are presented in Table 2.
240
Discussion For modern humans who have grown up wearing shoes, barefoot locomotion is difficult to become accustomed to. Currently, no field studies are available evaluating competitive barefoot running performance in children and adolescents. The present study revealed that barefoot performance in the 1000 m was marginally better than finish times recorded with training shoes, which are widely used by preadolescents for running. In addition, an improvement in running performance was recorded in both males and females when they ran barefoot when comparing the times recorded with training shoes (5.18 min vs. 5.20 min). This finding is in accordance with recent studies indicating that shod
HUMAN MOVEMENT T. Pilianidis, N. Mantzouranis, N. Siachos, Evaluation of barefoot running
Table 2. Linearity evaluation (Pearson’s correlation coefficients) of 1000 m running performances with training shoes, spikes and barefoot with physical and physiological parameters Variables
r
p
Training shoes performance Body mass Body height Body fat Thigh circumference Calf circumference Foot length VO2max
0.03 –0.30 0.45 0.17 0.06 –0.30 –0.73
0.87 0.06 0.03* 0.28 0.72 0.06 0.001**
Barefoot performance Body mass Body height Body fat Thigh circumference Calf circumference Foot length VO2max
0.17 –0.18 0.46 –0.23 0.16 0.20 –0.63
0.29 0.26 0.002* 0.15 0.32 0.21 0.001**
Spikes performance Body mass Body height Body fat Thigh circumference Calf circumference Foot length VO2max
be considerably less [10]. One obvious explanation for the increased energy cost of running with training shoes is the continual acceleration and deceleration of foot wear in each stride [22]. Another possibility for the above finding is that the external work in compressing, flexing and rotating the sole against the ground accounts for a maximum 13% of the work done in running [23]. Among the runners who participated in the present study, the females were reported with greater height, body mass, body fat, and thigh and calf girth values than the males. In contrast, male VO2max was slightly better than among the females. Regardless of gender, higher VO2max and greater lean body mass strongly correlated with 1000 m running performance in all study protocols. Thus, males with higher VO2max and lower body fat performed better than the females not only with training shoes (5.15 min vs. 5.29 min) but also when comparing barefoot running (5.05 min vs. 5.30 min) and when wearing spikes (4.46 min vs. 5.09 min). The results of the present study confirm that high aerobic capacity and low body fat percentage positively affect endurance running performance in preadolescents [24, 25]. Conclusions
0.08 –0.28 0.45 0.17 0.12 –0.30 –0.65
0.63 0.08 0.05* 0.27 0.52 0.06 0.001**
* p < 0.05, ** p < 0.001
and unshod performance do not significantly differing preadolescent runners [7, 19]. Moreover, regarding running speed in the 1000 m, the present preadolescents performed better when they wore running spikes (3.33 m/s) that in the other conditions of barefoot (3.16 m/s) and training shoes (3.12 m/s). A possible explanation for improved running speed may be due to modified foot mechanics during the landing phase. Thus, instead of landing on the heel as is usual in training shoes during a running stride, the participants improved running pace by contacting the track with the ball of the foot, activating the calf and foot muscles [20, 21]. Furthermore, the findings of this study were similar to those reported in the literature, where running performance in training shoes was worse than when barefoot. One possible reason may be due to the energy cost associated with shod running. Oxygen consumption at 12 km/h is 4.7% higher when wearing training shoes weighing 700 g [6]. Training footwear is also believed to compromise the ability of the lower limb to act like a spring. With bare feet, the limb returns ~70% of stored energy stored but with shoes the return was found to
In summary, the present results lead to the conclusion that barefoot running performance in the 1000 m was marginally better than with training shoes, which are widely used by preadolescents for running purposes. As there is a lack of scientific evidence supporting barefoot running, this study’s findings can be valuable for coaches designing longitudinal training plans. Due to the nature of running events, future research is needed to further evaluate if barefoot training during the developmental age could offer a significant competitive advantage in future world-class endurance runners. References 1. Bramble D.M., Lieberman D.E., Endurance running and the evolution of Homo. Nature, 2004, 432 (7015), 245–352, doi: 10.1038/nature03052. 2. Hasegawa H., Yamauchi T., Kraemer W.J., Foot strike patterns of runners at 15 km point during an elite-level half marathon. J Strength Cond Res, 2007, 21 (3), 888–893. 3. Henning M.E., Valiant A.G., Liu Q., Biomechanical variables and the perception of cushioning for running in various types of footwear. J Appl Biomech, 1996, 12 (2), 143–150. 4. Anthony R.J., The functional anatomy of the running training shoe. Chiropodist, 1987, 42, 451–459. 5. Robbins S.E., Gouw G.J., Athletic footwear: unsafe due to perceptual illusions. Med Sci Sports Exerc, 1991, 23 (2), 217–224. 6. Flaherty R.F., Running economy and kinematic differences among running with the foot shod, with the foot bare, and with the bare foot equated for weight. Microform Publications, International Institute for Sport and Human Performance, University of Oregon, Eugene, Oregon, USA 1994. 241
HUMAN MOVEMENT T. Pilianidis, N. Mantzouranis, N. Siachos, Evaluation of barefoot running
7. Lieberman D.E., Venkadesan M., Werbel W.A., Daoud A.I., D’Andrea S., Davis I.S. et al., Foot strike patterns and collision forces in habitually barefoot versus shod runners. Nature, 2010, 463 (7280), 531–535, doi: 10.1038/ nature08723. 8. Robbins S.E., Hanna A.M. Running-related injury prevention through barefoot adaptations. Med Sci Sports Exerc, 1987, 19 (2), 148–156. 9. Frederick E.C., Kinematically mediated effects of sports shoe design: A review. J Sports Sci, 1986, 4 (3), 169–184, doi: 10.1080/02640418608732116. 10. Yessis M., Explosive running. Contemporary Books, Illinois 2000. 11. Logan S., Hunter I., Hopkins J.T., Feland B.J., Parcell C.A., Ground reaction force differences between running shoes, racing flats and distance spikes in runners. J Sports Sci Med, 2010, 9 (1), 147–153. 12. Thomson R.D., Birkbeck A.E., Tan W.L., McCafferty L.F., Grant S., Wilson J., The modeling and performance of training shoe cushioning systems. Sports Eng, 1999, 2, 109–120. 13. Clarke T.E., Frederick E.C., Cooper L.B., Effects of shoe cushioning upon ground reaction forces in running. Int JSportsMed,1983,4(4),247–251,doi:10.1055/s-2008-1026043. 14. Wolf S., Simon J., Patikas D., Schuster W., Armbrust P., Doderlein L., Foot motion in children shoes – A comparison of barefoot walking with shod walking in conventional and flexible shoes. Gait Posture, 2008, 27 (1), 51–59, doi: 10.1016/j.gaitpost.2007.01.005. 15. Wegener C., Hunt A.E., Vanwanseele B., Burns J., Smith R.M., Effect of children’s shoes on gait: a systematic review and meta-analysis. J Foot Ankle Res, 2011, 4 (3), 1–13, doi: 10.1186/1757-1146-4-3. 16. Perl D.P., Daoud I.A., Lieberman D.E., Effects of footwear and strike type on running economy. Med Sci Sport Exerc, 2012,44(7),1335–1343,doi:10.1249/MSS.0b013e318247989e. 17. EUROFIT. European test of physical fitness. Council of Europe, Committee for the Development of Sport, Rome 1988. 18. Sports Coach UK. Multistage Fitness Test (Bleep Test) CD Version. 1998.
242
19. Moreno-Hernandez A., Rodriguez-Reyes G., QuinonesUriostegui I., Nunez-Carrera L., Perez-SanPablo A.I., Temporal and spatial gait parameters analysis in non-pathological Mexican children. Gait Posture, 2010, 32 (1), 78–81, doi: 10.1016/j.gaitpost.2010.03.010. 20. Alcantara E., Perez A., Lozano L., Garcia A.C., Generation and transmission of heel strike impacts in children running, footwear and gender influence. In: Abrantes J.M.C.S. (ed.), Proceedings of the XIV Symposium on Biomechanics in Sports. International Society of Biomechanics in SportsFHM, Funchal-Madeira 1996, 297–300. 21. Kristen K.H., Kastner J., Holzreiter S., Wagner P., Engel A., Biomechanics of children shoes using gait analyses in saddlers. Z Orthop Unfall, 1998, 136 (5), 457–462, doi: 10.1055/s-2008-1053684. 22. Stefanyshyn D.J. Nigg B.M., Influence of midsole bending stiffness on joint energy and jump height performance. Med Sci Sports Exerc, 2000, 32 (2), 471–476. 23. Webb P., Saris W.H.M., Schoffelen P.F.M., Van Ingen Schenau G.J., Hoor F.T., The work of walking: A calorimetric study. Med Sci Sports Exerc, 1988, 20 (4), 331–337. 24. Hausdorff M.J., Zemany L., Peng C.K., Goldberger A.L., Maturation of gait dynamics: stride-to-stride variability and its temporal organization in children. J Appl Physiol, 1999, 86 (3), 1040–1047. 25. Onywera V.O., Scott R.A., Boit M.K., Pitsiladis Y.P., Demographic characteristics of elite Kenyan endurance runners. J Sports Sci, 2006, 24 (4), 415–422, doi: 10.1080/02640410500189033.
Paper received by the Editor: February 24, 2013 Paper accepted for publication: October 31, 2014 Correspondence address Theophilos Pilianidis Department of Physical Education & Sport Science Democritus University of Thrace University Campus 69100, Komotini, Greece e-mail:
[email protected]
HUMAN MOVEMENT
conferences
SCIENTIFIC CONFERENCE UNDER THE HONORARY PATRONAGE OF Professor Mirosław J. Wysocki NATIONAL CONSULTANT ON PUBLIC HEALTH
3RD NATIONAL SCIENTIFIC CONFERENCE NUTRITION, PHYSICAL ACTIVITY AND HEALTH PROMOTION IN PREVENTING DISEASES OF AFFLUENCE Biała Podlaska, 25–26 September 2015 CONFERENCE TOPICS 1. Human nutrition 2. Physical activity 3. Health promotion
SCIENTIFIC COMMITTEE OF THE CONFERENCE prof. Jadwiga Charzewska (Warszawa) prof. Adam Czaplicki (Biała Podlaska) Jolanta Czarnocimska PhD (Poznań) Ewa Czeczelewska PhD (Siedlce) prof. Jan Czeczelewski (Biała Podlaska) prof. Jan Gawęcki (Poznań) Paweł Goryński PhD (Siedlce) prof. Krystyna Górniak (Biała Podlaska) Jadwiga Hamułka PhD (Warszawa) prof. Marzena Jeżewska-Zychowicz (Warszawa) prof. Jerzy Jurkiewicz (Siedlce) prof. Jan K. Karczewski (Białystok) Henryk Komoń PhD (Siedlce)
Dominik Krzyżanowski PhD (Wrocław) prof. Longin Marianowski (Siedlce) Barbara Pietruszka PhD (Warszawa) prof. Helena Popławska (Biała Podlaska) Jacek Putz PhD (Siedlce) prof. Barbara Raczyńska (Biała Podlaska) prof. Jerzy Sadowski (Biała Podlaska) Małgorzata A. Słowińska PhD (Olsztyn) prof. Mieczysław Szostek (Siedlce) prof. Andrzej Szpak (Białystok) prof. Lidia Wądołowska (Olsztyn) prof. Andrzej Wojtczak (Siedlce) prof. Joanna Wyka (Wrocław)
ORGANISERS Department of Biology and Anatomy The Faculty of Health Sciences Collegium MAZOVIA Innovative Higher School The Faculty of Physical Education and Sport in Siedlce The Branch of Warsaw University of Physical Education in Biała Podlaska Mazowiecki Regional Hospital in Siedlce INFORMATION CONCERNING THE CONFERENCE IS AVAILABLE ON THE FOLLOWING WEBSITES: http://www.awf-bp.edu.pl – “Konferencje” http://www.mazovia.edu.pl – “Badania naukowe” “Konferencje” http://www.szpital.siedlce.pl – “Aktualności” Additional information: prof. J. Czeczelewski tel. 538 357 880 e-mail:
[email protected] Conference registration deadline – 15 March 2015 Conference fee and abstract submission deadline – 1 April 2015
243
HUMAN MOVEMENT
PUBLISHING GUIDELINES – Regulamin publikowania prac
1. Human Movement (abb.: HM) is a peer-reviewed quarterly journal published by the University School of Physical Education (abb.: AWF). 2. The Editorial Office accepts for publication original empirical papers and review ones on various aspects of human movement, e.g. sports medicine, exercise physiology, biomechanics, motor control, psychology. Letters to the Editor, reports from scientific meetings and book reviews are also welcome. Publication of articles in Human Movement is free of charge. 3. Papers are accepted for publication after being reviewed favorably by at least two independent reviewers nominated by the Editor and who are not affiliated in the same research unit as the author of the reviewed manuscript. Authors can suggest reviewers, but the Editor reserves the right to final selection. 4. Review procedures are set forth in accordance with the guidelines of the Polish Ministry of Science and Higher Education which are consultable on website: https://pbn.nauka.gov.pl/ static/doc/wytyczne_dotyczace_procedury_recenzowania.pdf 5. Reviews are written by completing a paper review form (available on the HM website) where reviewers have to expli citly express whether the manuscript is accepted for publication or rejected. 6. The review process is double-blind. Otherwise reviewers are obliged to sign a conflict of interest declaration (conflict of interest occurs when there are close personal relationships between the author and the reviewer, professional superiorsubordinate relationships, direct research cooperation for the two years prior to the manuscript reviewing. 7. Names of the reviewers are not revealed. Once a year the Editor provides a general list of the cooperating reviewers. 8. After the article is accepted for publication, the author transfers copyright to AWF by signing the Creative Commons license, and consequently giving his or her consent to publish the article in printed, magnetic and digital form, and to make it accessible on the Internet (the appropriate form is available online). If the article is an output of cooperation of more authors, the principal author is entitled by the other co-authors to sign the license on their behalf and is also obliged to inform the co-authors of the license terms and the journal submission requirements. Papers accepted for publication become the property of AWF and cannot be published elsewhere without AWF’s written permission. Publication is subject to copyright due to the Berne Convention and the Universal Copyright Convention, with few exceptions admitted by the local law. No part of the paper (except for the abstract) may be reproduced by readers, stored and transmitted in any form and by any means without the copyright holder’s permission. 9. Authors retain copyright of their papers, are allowed to store, propagate it according to the legally permitted private use and can use the paper’s content in their future works only if the complete bibliography source information is provided. 244
1. Kwartalnik Human Movement (dalej: HM) jest recenzowanym czasopismem naukowym Akademii Wychowania Fizycznego we Wrocławiu (dalej: AWF). 2. Redakcja przyjmuje do publikacji oryginalne prace empiryczne oraz przeglądowe dotyczące ruchu człowieka z zakresu medycyny sportu, fizjologii wysiłku fizycznego, biomechaniki, antropomotoryki, psychologii. Przyjmowane są również listy do Redakcji, sprawozdania z konferencji naukowych i recenzje książek. Publikowanie prac w Human Movement jest bezpłatne. 3. Do druku zatwierdzane są tylko prace, które uzyskają pozytywną opinię co najmniej dwóch, powołanych przez Redakcję, niezależnych recenzentów spoza jednostki naukowej afiliowanej przez autora publikacji. Autor może zaproponować recenzentów, lecz Redakcja zastrzega sobie prawo ich doboru. 4. Procedury recenzowania są zgodne z wytycznymi Ministerstwa Nauki i Szkolnictwa Wyższego, umieszczonymi na stronie: https://pbn.nauka.gov.pl/static/doc/wytyczne_dotyczace_procedury_recenzowania.pdf 5. Recenzje mają formę pisemną i są sporządzane na arkuszu recenzenckim (dostępny na stronie internetowej czasopisma), zobowiązującym recenzenta do sformułowania jednoznacznego wniosku o dopuszczeniu pracy do publikacji lub jej odrzuceniu. 6. Autor i recenzent pozostają względem siebie anonimowi (double-blind review process). W pozostałych przypadkach recenzent jest zobowiązany do podpisania deklaracji o niewystępowaniu konfliktu interesów (za konflikt interesów uznaje się zachodzące między recenzentem a autorem: bezpośrednie relacje osobiste – pokrewieństwo, związki prawne, relacje podległości zawodowej, bezpośrednia współpraca naukowa w ciągu ostatnich dwóch lat poprzedzających przygotowanie recenzji. 7. Nazwiska recenzentów nie są ujawniane. Raz w roku Redakcja podaje do publicznej wiadomości listę recenzentów współpracujących. 8. Po akceptacji artykułu do druku autor przekazuje prawa autorskie na rzecz AWF, podpisując licencję Creative Commons, tym samym zgadzając się na druk artykułu w postaci drukowanej, na nośnikach magnetycznych, cyfrowych i upowszechnie nia w internecie (formularz do pobrania ze strony internetowej). Jeśli artykuł powstał we współpracy z innymi autorami, główny autor jest upoważniony przez wszystkich współautorów do podpisania licencji w ich imieniu i zobowiązuje się do poinformowania współautorów o warunkach zawartych w licencji oraz Regulaminie czasopisma. Przyjęty artykuł staje się własnością AWF i nie może się ukazać w innym wydawnictwie bez jej pisemnej zgody. Publikacja podlega prawu autorskiemu wynikającemu z Konwencji Berneńskiej i z Międzynarodowej Konwencji Praw Autorskich, poza wyjątkami dopuszczanymi przez prawo krajowe. Żadna część publikacji (z wyjątkiem abstraktu) nie może być reprodukowana przez czytelników, archiwizowana ani przekazywana w jakiejkolwiek formie ani żadnymi środkami bez pozwolenia właściciela praw autorskich. 9. Autor zachowuje prawa autorskie dotyczące artykułu, ma prawo go archiwizować, rozpowszechniać zgodnie z prawem dozwolonego użytku prywatnego oraz może wykorzystywać treści tego artykułu w przyszłych swoich pracach pod warunkiem podania pełnego adresu bibliograficznego.
HUMAN MOVEMENT Publishing guidelines – Regulamin publikowania prac
10. The Editor reserves the right to introduce corrections in the paper and prevent its publication in case of confirmed plagiarism. The submitted articles which are not conform to the requirements will be returned to authors for corrections. 11. The author (authors) receives no royalty for publication. The author for correspondence receives through e-mail a PDF file with the article and full volume in which it was published. 12. Authors of research papers are obliged to protect personal data of the research participants. If the information included in the paper makes it possible to identify the subjects, authors have to obtain their written consent for publication of the research outcomes, photographs included (the appropriate form can be downloaded from the Internet) before submitting papers to the Editor. 13. The editor does not accept papers that make use of ghostwriting and guest authorship. If detected, such practices will be disclosed. The Editor requires the principal author of joint publications to complete a declaration which specifies the contribution of each co-author in the research paper. 14. In order to initiate the publishing procedures of the paper, the author has to submit its electronic version to the email address
[email protected]. The paper has to be prepared according to the submission requirements enclosed to the Guide for Authors, accompanied by the signed license, the principal author’s declaration (if it is a joint paper) as well as the consents of the photographer and the photographed persons (if there are any). 15. The moment authors submit papers to the Editor, they agree to accept the procedures of article qualification for publication employed in HM Editorial Office. 16. After the corrections are introduced by the reviewers, authors are obliged to send the paper back within 3 weeks. 17. Authors are obliged to cooperate with the editorial staff: native speaker, HM editor and proofreaders (language and statistical data) in order to eliminate ambiguities and errors. In case of no response to the editorial observations within a week, the author’s consent for introduction of the suggested changes is taken for granted. 18. Authors should list all the people or institutions that contributed to the article preparation factually, financially or technically. 19. The Editor accepts advertisements that can be placed in an advertising inserts next to the cover pages. Prices of advertising are negotiated individually. 20. The original version of the journal is its paper issue.
10. Redakcja zastrzega sobie prawo do wprowadzenia poprawek w artykule oraz niedopuszczenia do jego publikacji w razie stwierdzenia plagiatu. Artykuł przygotowany niezgodnie z regulaminem będzie odsyłany autorowi do poprawy. 11. Za artykuł opublikowany w HM autor (autorzy) nie otrzymuje honorarium. Autor do korespondencji otrzymuje za pośrednictwem poczty e-mail plik PDF z opublikowanym artykułem i tomem, w którym został opublikowany artykuł. 12. Autor pracy naukowej ma obowiązek ochraniać dane osobowe badanych osób. Jeżeli zawarte w artykule informacje umożliwiają w jakikolwiek sposób ustalenie tożsamości badanych osób, autor musi uzyskać ich pisemną zgodę na opublikowanie wyników, w tym zdjęć fotograficznych (formularz do pobrania ze strony internetowej), przed wysłaniem artykułu do Redakcji. 13. Redakcja nie przyjmie artykułu, w którym występują zjawiska „ghostwriting” i „guest authorship”, a wszelkie nieprawidłowości będzie ujawniać. Od głównego autora pracy zbiorowej Redakcja wymaga wypełnienia stosownego oświadczenia, pozwalającego określić wkład współautorów w powstanie artykułu. 14. Warunkiem rozpoczęcia prac redakcyjnych nad artykułem jest dostarczenie na adres
[email protected] wersji elektronicznej, przygotowanej zgodnie z wytycznymi zawartymi w załączniku niniejszego Regulaminu, podpisanej licencji, oświadczenia głównego autora (w wypadku pracy zbiorowej) oraz zgody autora fotografii i osoby fotografowanej (w wypadku załączonego materiału ilustracyjnego). 15. Autor, składając artykuł do czasopisma, tym samym zgadza się na obowiązujące w Redakcji HM procedury kwalifikowania pracy do publikacji. 16. Po naniesieniu poprawek po recenzji autor zobowiązuje się odesłać poprawiony artykuł w ciągu 3 tygodni. 17. Autor jest zobowiązany współpracować z native spea ker, redaktorem wydawniczym i korektorami (językowym i statystycznym) w celu wyjaśnienia wszelkich niejasności lub uzupełnienia braków w tekście. Brak odpowiedzi na uwagi redakcyjne w ciągu tygodnia będzie oznaczać zgodę na wprowadzenie proponowanych poprawek. 18. Autor powinien wymienić osoby lub instytucje, które pomogły mu w przygotowaniu pracy, udzieliły konsultacji bądź wsparły go finansowo lub technicznie. 19. Redakcja przyjmuje zamówienia na reklamy, które mogą być umieszczane na dodatkowych kartach sąsiadujących z okładką. Ceny reklam będą negocjowane indywidualnie. 20. Wersją pierwotną czasopisma jest wersja papierowa.
Detailed guidelines for submitting articles to Human Movement
Szczegółowe zasady przygotowania artykułu do Human Movement
1. The article should be written in English. 2. Empirical research articles, together with their summary and any tables, figures or graphs, should not exceed 20 pages in length; comparative articles are limited to 30 pages. Page format is A4 (about 1800 characters with spaces per page). Pages should be numbered. 3. Articles should be written using Microsoft Word with the following formats: – Font: Times New Roman, 12 point – Line spacing: 1.5 – Text alignment: Justified – Title: Bold typeface, centered
1. Redakcja przyjmuje prace w języku angielskim, z wyjątkiem prac autorów z afiliacją AWF Wrocław lub AWF Kraków, które mogą być napisane w języku polskim. Artykuły te po uzyskaniu pozytywnej recenzji są tłumaczone przez Redakcję na język angielski. 2. Tekst prac empirycznych wraz ze streszczeniem, rycinami i tabelami nie powinien przekraczać 20, a prac przeglądowych – 30 stron znormalizowanych formatu A4 (ok. 1800 znaków ze spacjami na stronie). Strony powinny być ponumerowane. 3. Artykuł należy przygotować w edytorze tekstu Microsoft Word według następujących zasad: 245
HUMAN MOVEMENT Publishing guidelines – Regulamin publikowania prac
4. The main title page should contain the following: – The article’s title – A shortened title of the article (up to 40 characters in length including spaces), which will be placed in the running head – The name and surname of the author(s) with their affiliations written in the following way: the name of the university, city name, country name. For example: The University of Physical Education, Wrocław, Poland – Address for correspondence (author’s name, address, e-mail address and phone number) 5. The second page should contain: – The title of the article – An abstract of approximately 200 words divided into the following sections: Purpose, Methods, Results, Con clusions – Three to six keywords to be used as MeSH descriptors (terms) 6. The third page should contain: – The title of the article – The main text 7. The main body of text in empirical research articles should be divided into the following sections: Introduction The introduction prefaces the reader on the article’s subject, describes its purpose, states a hypothesis, and mentions any existing research (literature review) Material and methods This section is to clearly describe the research material (if human subjects took part in the experiment, include their number, age, gender and other necessary information), discuss the conditions, time and methods of the research as well identifying any equipment used (providing the manufacturer’s name and address). Measurements and procedures need to be provided in sufficient detail in order to allow for their reproducibility. If a method is being used for the first time, it needs to be described in detail to show its validity and reliability (reproducibility). If modifying existing methods, describe what was changed as well as justify the need for the modifications. All experiments using human subjects must obtain the approval of an appropriate ethnical committee by the author in any undertaken research (the manuscript must include a copy of the approval document). Statistical methods should be described in such a way that they can be easily determined if they are correct. Authors of comparative research articles should also include their methods for finding materials, selection methods, etc. Results The results should be presented both logically and consistently, as well as be closely tied with the data found in tables and figures. Discussion Here the author should create a discussion of the obtained results, referring to the results found in other literature (besides those mentioned in the introduction), as well as emphasizing new and important aspects of their work. 246
– – – –
krój pisma: Times New Roman, 12 pkt; interlinia: 1,5; tekst wyjustowany; tytuł zapisany pogrubionym krojem pisma, wyśrodkowany. 4. Strona tytułowa powinna zawierać: – tytuł pracy w języku angielskim; – skrócony tytuł artykułu w języku angielskim (do 40 znaków ze spacjami), który zostanie umieszczony w żywej paginie; – imię i nazwisko autora (autorów) z afiliacją zapisaną według następującego schematu: • nazwa uczelni, nazwa miejscowości, nazwa kraju, np. Akademia Wychowania Fizycznego, Wrocław, Polska; – adres do korespondencji (imię i nazwisko autora, jego adres, e-mail oraz numer telefonu). 5. Następna strona powinna zawierać: – tytuł artykułu; – streszczenie w języku angielskim (około 200 wyrazów) składające się z następujących części: Purpose, Methods, Results, Conclusions; – słowa kluczowe w języku angielskim (3–6) – ze słownika i w stylu MeSH. 6. Trzecia strona powinna zawierać: – tytuł artykułu; – tekst główny. 7. Tekst główny pracy empirycznej należy podzielić na następujące części: Wstęp We wstępie należy wprowadzić czytelnika w tematykę artykułu, opisać cel pracy oraz podać hipotezy, stan badań (przegląd literatury). Materiał i metody W tej części należy dokładnie przedstawić materiał badawczy (jeśli w eksperymencie biorą udział ludzie, należy podać ich liczbę, wiek, płeć oraz inne charakterystyczne cechy), omówić warunki, czas i metody prowadzenia badań oraz opisać wykorzystaną aparaturę (z podaniem nazwy wytwórni i jej adresu). Sposób wykonywania pomiarów musi być przedstawiony na tyle dokładnie, aby inne osoby mogły je powtórzyć. Jeżeli metoda jest zastosowana pierwszy raz, należy ją opisać szczególnie precyzyjnie, przedstawiając jej trafność i rzetelność (powtarzalność). Modyfikując uznane już metody, trzeba omówić, na czym polegają zmiany, oraz uzasadnić konieczność ich wprowadzenia. Gdy w eksperymencie biorą udział ludzie, konieczne jest uzyskanie zgody komisji etycznej na wykorzystanie w nim zaproponowanych przez autora metod (do maszynopisu należy dołączyć kopię odpowiedniego dokumentu). Metody statystyczne powinny być tak opisane, aby można było bez problemu stwierdzić, czy są one poprawne. Autor pracy przeglądowej powinien również podać metody poszukiwania materiałów, metody selekcji itp. Wyniki Przedstawienie wyników powinno być logiczne i spójne oraz ściśle powiązane z danymi zamieszczonymi w tabelach i na rycinach. Dyskusja W tym punkcie, stanowiącym omówienie wyników, autor powinien odnieść uzyskane wyniki do danych z literatury
HUMAN MOVEMENT Publishing guidelines – Regulamin publikowania prac
Conclusions In presenting any conclusions, it is important to remember the original purpose of the research and the stated hypotheses, and avoid any vague statements or those not based on the results of their research. If new hypotheses are put forward, they must be clearly stated. Acknowledgements The author may mention any people or institutions that helped the author in preparing the manuscript, or that provided support through financial or technical means. Bibliography The bibliography should be composed of the article’s citations and be arranged and numbered in the order in which they appear in the text, not alphabetically. Referenced sources from literature should indicate the page number and enclose it in square brackets, e.g., Bouchard et al. [23]. The total number of bibliographic references (those found only in research databases such as SPORTDiscus, Medline) should not exceed 30 for empirical research papers (citing a maximum of two books); there is no limit for comparative research papers. There are no restrictions in referencing unpublished work. Citing journal articles Bibliographic citations of journal articles should include: the author’s (or authors’) surname, first name initial, article title, abbreviated journal title, year, volume or number, page number, doi, for example: Tchórzewski D., Jaworski J., Bujas P., Influence of long-lasting balancing on unstable surface on changes in balance. Hum Mov, 2010, 11 (2), 144–152, doi: 10.2478/v10038-010- 0022-2.
If there are six or less authors, all the names should be mentioned; if there are seven or more, give the first six and then use the abbreviation “et al.” If the title of the article is in a language other than English, the author should translate the title into English, and then in square brackets indicate the original language; the journal title should be left in its native name, for example: Jaskólska A., Bogucka M., Świstak R., Jaskólski A., Mechanisms, symptoms and after-effects of delayed muscle soreness (DOMS) [in Polish]. Med Sport, 2002, 4, 189–201.
The author’s research should only take into consideration articles published in English. Citing books Bibliographic citations of books should include: the author (or authors’) or editor’s (or editors’) surname, first name initial, book title translated into English, publisher, place and year of publication, for example: Osiński W., Anthropomotoric [in Polish]. AWF, Poznań 2001. Heinemann K. (ed.), Sport clubs in various European countries. Karl Hofmann, Schorndorf 1999.
(innych niż omówione we wstępie), podkreślając nowe i znaczące aspekty swojej pracy. Wnioski Przedstawiając wnioski, należy pamiętać o celu pracy oraz postawionych hipotezach, a także unikać stwierdzeń ogólnikowych i niepopartych wynikami własnych badań. Stawiając nowe hipotezy, trzeba to wyraźnie zaznaczyć. Podziękowania Należy wymienić osoby lub instytucje, które pomogły autorowi w przygotowaniu pracy, udzieliły konsultacji bądź wsparły go finansowo lub technicznie. Bibliografia Bibliografię należy uporządkować i ponumerować według kolejności cytowania publikacji w tekście, a nie alfabetycznie. Odwołania do piśmiennictwa należy oznaczać w tekście numerem i ująć go w nawias kwadratowy, np. Bouchard et al. [23]. Bibliografia (powołania zawarte tylko w bazach danych, np. SPORTDiscus, Medline) powinna się składać najwyżej z 30 pozycji (dopuszcza się powołanie na 2 publikacje książkowe), z wyjątkiem prac przeglądowych. Niewskazane jest cytowanie prac nieopublikowanych. Opis bibliograficzny artykułu z czasopisma Opis bibliograficzny artykułu powinien zawierać: nazwisko autora (autorów), inicjał imienia, tytuł artykułu, tytuł czasopisma w przyjętym skrócie, rok wydania, tom lub numer, strony, numer doi, np. Tchórzewski D., Jaworski J., Bujas P., Influence of long-lasting balancing on unstable surface on changes in balance. Hum Mov, 2010, 11 (2), 144–152, doi: 10.2478/v10038-010-0022-2.
Gdy autorami artykułu jest sześć lub mniej osób, należy wymienić wszystkie nazwiska, jeżeli jest ich siedem i więcej, należy podać sześć pierwszych, a następnie zastosować skrót „et al.”; Tytuł artykułu w języku innym niż angielski autor powinien przetłumaczyć na język angielski, a w nawiasie kwadratowym podać język oryginału, tytuł czasopisma należy zostawić w oryginalnym brzmieniu, np. Jaskólska A., Bogucka M., Świstak R., Jaskólski A., Mechanisms, symptoms and after-effects of delayed muscle soreness (DOMS) [in Polish]. Med Sportiva, 2002, 4, 189–201.
W pracy powinny być uwzględnianie tylko artykuły publikowane ze streszczeniem angielskim. Opis bibliograficzny książki Opis bibliograficzny książki powinien zawierać: nazwisko autora (autorów) lub redaktora (redaktorów), inicjał imienia, tytuł pracy przetłumaczony na język angielski, wydawcę, miejsce i rok wydania, np. Osiński W., Anthropomotoric [in Polish]. AWF, Poznań 2001. Heinemann K. (ed.), Sport clubs in various European countries. Karl Hofmann, Schorndorf 1999.
Bibliographic citations of an article within a book should include: the author’s (or authors’) surname, first name initial, article title, book author (or authors’) or editor’s (or editors’) surname, first name initial, book title, publisher, place and year of publication, paga number, for example:
Opis bibliograficzny rozdziału w książce powinien zawierać: nazwisko autora (autorów), inicjał imienia, tytuł rozdziału, nazwisko autora (autorów) lub redaktora (redaktorów), tytuł pracy, wydawcę, miejsce i rok wydania, strony, np.
McKirnan M.D., Froelicher V.F., General principles of exercise testing. In: Skinner J.S. (ed.), Exercise testing and exercise prescription for special cases. Lea & Febiger, Philadelphia 1993, 3–28.
McKirnan M.D., Froelicher V.F., General principles of exercise testing. In: Skinner J.S. (ed.), Exercise testing and exercise prescription for special cases. Lea & Febiger, Philadelphia 1993, 3–28.
247
HUMAN MOVEMENT Publishing guidelines – Regulamin publikowania prac
Citing conference materials Citing conference materials (found only in international research databases such as SPORTDiscus) should include: the author’s (or authors’) surname, first name initial, article title, conference author’s (or authors’) or editor’s (or editor’s) surname, first name initial, conference title, publisher, place and year of publication, page number, for example:
Opis bibliograficzny materiałów zjazdowych Opis bibliograficzny materiałów zjazdowych (umieszczanych tylko w międzynarodowych bazach danych, np. SPORTDiscus) powinien zawierać: nazwisko autora (autorów), inicjał imienia, tytuł, nazwisko autora (autorów) lub redaktora (redaktorów), tytuł pracy, wydawcę, miejsce i rok wydania, strony, np.
Rodriguez F.A., Moreno D., Keskinen K.L., Validity of a twodistance simplified testing method for determining critical swimming velocity. In: Chatard J.C. (ed.), Biomechanics and Medicine in Swimming IX, Proceedings of the IXth World Symposium on Biomechanics and Medicine in Swimming. Université de St. Etienne, St. Etienne 2003, 385–390.
Rodriguez F.A., Moreno D., Keskinen K.L., Validity of a twodistance simplified testing method for determining critical swimming velocity. In: Chatard J.C. (ed.), Biomechanics and Medicine in Swimming IX, Proceedings of the IXth World Symposium on Biomechanics and Medicine in Swimming. Université de St. Etienne, St. Etienne 2003, 385–390.
Citing articles in electronic format Citing articles in electronic format should include: author’s (or authors’) surname, first name initial, article title, abbreviated journal title, year of publication, journal volume and number, website address where it is available, doi number, for example:
Opis bibliograficzny artykułu w formie elektronicznej Opis bibliograficzny artykułu w formie elektronicznej powinien zawierać: nazwisko autora (autorów), inicjał imienia, tytuł artykułu, tytuł czasopisma w przyjętym skrócie, tom lub numer, rok wydania, adres strony, na której jest dostępny, numer doi, np.
Donsmark M., Langfort J., Ploug T., Holm C., Enevoldsen L.H., Stallknech B. et al., Hormone-sensitive lipase (HSL) expression and regulation by epinephrine and exercise in skeletal muscle. Eur J Sport Sci, 2002, 2 (6). Available from: URL: http://www.humankinetics.com/ejss/bissues. cfm/, doi: 10.1080/17461391.2002.10142575.
Donsmark M., Langfort J., Ploug T., Holm C., Enevoldsen L.H., Stallknech B. et al., Hormone-sensitive lipase (HSL) expression and regulation by epinephrine and exercise in skeletal muscle. Eur J Sport Sci, 2 (6), 2002. Available from: URL: http://www.humankinetics.com/ejss/bissues. cfm/, doi: 10.1080/17461391.2002.10142575.
8. The main text of any other articles submitted for consideration should maintain a logical continuity and that the titles assigned to any sections must reflect the issues discussed within. 9. Footnotes/Endnotes (explanatory or supplementary to the text). Footnotes should be numbered consecutively throughout the work and placed at the end of the main text. 10. Tables, figures and photographs – Must be numbered consecutively in the order in which they appear in the text and provide captions – Should be placed within the text – Additionally, figures or photographs must be attached as separate files in .jpg or .pdf format (minimum resolution of 300 dpi) – May not include the same information/data in tables and also figures – Illustrative materials should be prepared in black and white or in shades of gray (Human Movement is published in such a fashion and cannot accept color) – Symbols such as arrows, stars, or abbreviations used in tables or figures should be clearly defined using a legend.
8. Tekst główny w pracach innego typu powinien zachować logiczną ciągłość, a tytuły poszczególnych części muszą odzwierciedlać omawiane w nich zagadnienia. 9. Przypisy (objaśniające lub uzupełniające tekst) – powinny być numerowane z zachowaniem ciągłości w całej pracy i umieszczone na końcu tekstu głównego. 10. Tabele, ryciny i fotografie – należy opatrzyć numerami i podpisami; – należy umieścić w tekście artykułu; – dodatkowo ryciny i fotografie trzeba dołączyć w postaci osobnych plików zapisanych w formacie *.jpg lub *.pdf (gęstość co najmniej 300 dpi); – nie można powtarzać tych samych wyników w tabelach i na rycinach; – materiał ilustracyjny powinien zostać przygotowany w wersji czarno-białej lub w odcieniach szarości (w taki sposób jest drukowane czasopismo Human Movement); – symbole, np. strzałki, gwiazdki, lub skróty użyte w tabelach czy na rycinach należy dokładnie objaśnić, tak by były czytelne i zrozumiałe niezależnie od tekstu pracy.
Prior to printing, the author will receive their article in .pdf format. It is the author’s responsibility to immediately inform the Editorial Office if they accept the article for publication. At such a point in time, only minor corrections can be accepted from the author.
Przed drukiem autor otrzyma swój artykuł do akceptacji w formie pliku pdf. Obowiązkiem autora jest niezwłoczne przesłanie do Redakcji Human Movement informacji o akceptacji artykułu do druku. Na tym etapie będą przyjmowane tylko drobne poprawki autorskie.
248
SUBSCRIBING to THE HUMAN MOVEMENT JOURNAL ZASADY PRENUMERATY CZASOPISMA HUMAN MOVEMENT The price of annual subscription (four issues) for individual subscribers is PLN 54 and PLN 110 for institutions. All subscriptions are payable in advance. Subscribers are requested to send payment with their order whenever possible. The orders should be sent to the Editorial Office: e-mail:
[email protected] or Human Movement Editorial Office University School of Physical Education al. I.J. Paderewskiego 35 51-612 Wrocław, Poland
Cena rocznej prenumeraty (cztery numery) dla odbiorców indyw idualnych w kraju wynosi 54 zł brutto, dla instytucji 110 zł brutto. Zamówienie wraz z potwierdzeniem dokonania wpłaty należy przesłać na adres mailowy:
[email protected] lub
The issues of the journal are sent by post after receiving the appropriate transfer to the account:
Numery czasopisma wysyłamy pocztą po otrzymaniu od pow iedniej wpłaty na konto:
BPH PBK S.A. O/Wrocław 42 1060 0076 0000 3210 0014 7743 Akademia Wychowania Fizycznego al. Paderewskiego 35, 51-612 Wrocław, Poland with the note: Human Movement subscription.
BPH PBK S.A. O/Wrocław 42 1060 0076 0000 3210 0014 7743 Akademia Wychowania Fizycznego al. Paderewskiego 35, 51-612 Wrocław z dopiskiem: Prenumerata Human Movement.
We ask the subscribers to give correct and clearly written addresses to which the journal is to be sent.
Prosimy zamawiających o bardzo wyraźne podawanie adresów, pod które należy wysyłać zamawiane egzemplarze czasopisma. Pojedyncze egzemplarze można zamówić w ten sam sposób, wpłacając 16 zł brutto (odbiorca indywidualny) i 30 zł brutto (instytucja) na podane konto.
Single copies can be ordered in the same way, by transferring PLN 16 (individual subscribers) and PLN 30 (institutions) to the above mentioned account.
Redakcja czasopisma Human Movement Akademia Wychowania Fizycznego al. I.J. Paderewskiego 35 51-612 Wrocław