Hindawi Publishing Corporation International Journal of Distributed Sensor Networks Volume 2013, Article ID 510917, 10 pages http://dx.doi.org/10.1155/2013/510917
Research Article Human Moving Pattern Recognition toward Channel Number Reduction Based on Multipressure Sensor Network Zhaoqin Peng,1 Chun Cao,1 Jiaoying Huang,2 and Wentao Pan1 1 2
School of Automation Science and Electrical Engineering, Beihang University, No. 37 Xueyuan Road, Haidian District, Beijing, China Science & Technology on Reliability & Environmental Engineering Laboratory, Beihang University, No. 37 Xueyuan Road, Haidian District, Beijing, China
Correspondence should be addressed to Jiaoying Huang;
[email protected] Received 7 August 2013; Accepted 21 September 2013 Academic Editor: Su-Qun Cao Copyright © 2013 Zhaoqin Peng et al. This is an open access article distributed under the Creative Commons Attribution License, which permits unrestricted use, distribution, and reproduction in any medium, provided the original work is properly cited. A pair of sensing shoes for measuring foot pressure was developed. This system aims at recognizing human movement in unlimited environments. The multipressure sensor network of seven sensors on one insole was set up. Analysis for discriminating the user’s movements from foot pressure distribution was carried out, considering the movements of standing, walking, going upstairs, and going downstairs. These actions were discriminated using characteristics extracted from the data of sensors. The classifier based on SVM showed highly accurate movement recognition. Specifically, to improve the classification performance, PCA based dimensionality reduction and channel reduction based data fusion were introduced. Experimental outcomes verified the testing speed of the classification function which was improved without affecting the accuracy rate. The results confirmed that this discriminant analysis can be employed for automatically recognizing human moving pattern based on foot pressure signal.
1. Introduction Wearable robots, which can acquire physiological state and movement information, provide people with opportunities to wear sensors and intelligent devices in the daily life. This system is in the form of a mechanical structure that is combined with the exterior of a human body to enhance the power of the wearer in various environments [1]. In the field of healthcare, one major goal is to monitor activities of freeliving subjects. Daily activities can provide information for doctors to accurately diagnose chronic diseases and design care plan of patients [2–5]. On the other hand, for military use, wearable robots can successfully maneuver heavy loads over unstructured terrain like forests, jungles, and deserts [6]. The first energetically autonomous lower extremity exoskeleton for soldiers, disaster relief workers, and wildfire fighters, as well as other emergency personnel to carry major loads, like food, rescue equipment, first-aid supplies, communications gear, and weaponry has been demonstrated at U.C. Berkeley [7]. Considerable kinds of sensors are employed
to obtain human motion. Currently, a number of wearable robots are different in the selection of sensors, the position where sensors distribute, and the analysis of sensor data. Present researches tend to focus on daily worn wristwatch, glasses and shoes where sensors can be embedded into. With embedded sensors, noninvasive detection is available for providing action assistant. However, researchers never give up the intention to recognize users’ condition to give appropriate action support. The acquisition of users’ motion signal for controlling strategy of wearable robots still remains to be the key point. Owing to the importance of data collection, various measuring techniques have already been developed to cater to the development of human-robot interaction. In many robotic systems, sensors are installed at toe or heel to recognize movements by thresholds [8, 9]. However, this method lacks of accuracy especially in identifying different moving stages [10]. Taking the advantage of multisensor technology has been a focus of interest within the last few years. Adopting the methodology of information cognition from multisensor
2
International Journal of Distributed Sensor Networks
Pressure sensing module
Signal conditioning circuit
Wireless transmitter
Microcontroller
Sensor
Desktop
USB adapter
Wireless receiver
Figure 1: Overview of foot pressure sensing system.
was regarded not only efficient but also reliable [11–14]. Multisensor networks have already been deployed in a considerable number of detecting and monitoring tasks, such as aircraft structural performance detection [15], mobile health biomonitoring [16], alcohol continuous measuring within interstitial fluid [17], and forest fire alarming [18]. Studies emerged has paved a way for further researches on the distinctiveness of sensor networks in wearable robots. For example, the EMG based multisensor system is generally employed to measure muscular activity signals [19], whereas, this sensor has to be directly attached to the skin, which requires high sampling frequencies for signal collection and is difficult to quantify the signals [20]. According to the aforementioned issues, aiming at releasing physical and mental burdens on users, this paper preliminarily concentrates on developing a pair of foot pressure sensing shoes for users’ movement identification. Foot pressure signal is both viable and effective for identifying behavior, for human movement and posture are well reflected in foot pressure distribution. To the best of our knowledge, plenty of researches are about foot pressure detecting system, but few studies have deeply discussed the effects of sensor distribution [21–23]. And the minority researches about the sensor positioning depend merely on foundational theoretical derivation. Therefore, in the present study, a sensor network based automatic motion signal acquisition system was analyzed to demonstrate the essential impact of sensor positioning. The relationship between recognition effect and sensor distribution was discussed to guide the design of the controlling strategy of wearable robots. This reminder of this paper is arranged in the following order. Section 2 presented the setup of the foot pressure sensing shoes. Section 3 illustrates the development of the proposed sensor network scheme and feature representation for different motions. In Section 4, the feature selection method is depicted. Section 5 describes data fusion based movement
1
7
2 6 3 5 4
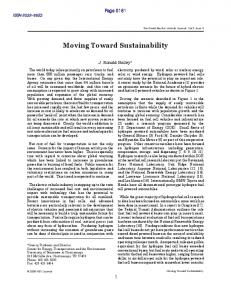
Figure 2: Measurement position.
identification algorithm. Section 6 reports the experimental results. We draw the conclusion in Section 7.
2. System Description The primary feature of foot pressure sensing shoes is its convenience of wearability. The wearable nature of shoes allows it to collect user’s motion signal freely. The schematic of the pressure sensing system is presented in Figure 1. Each insole of the shoe was equipped with seven pressure sensing elements respectively. The pressure sensors we employed in this system are FSR402, which are force-sensitive resistor sensor. FSR402 sensor is kind of flexible printed circuit with a thickness of 0.5 mm. It is obvious that the more sensors placed, the higher precision of plantar pressure distribution can be measured. However, we are aiming at optimizing the number of measurement points, because the number of sensors affects the amount of data processing, and power consumption. The seven sensors were installed on the insole as shown in Figure 2 and the appearance of
International Journal of Distributed Sensor Networks
Figure 3: Appearance of insole sensors.
Table 1: Name of sensing positions. Position number 1 2 3 4 5 6 7
Name Great toe Little ball Lateral border Heel Posterior metatarsal Anterior metatarsal Great ball
the insole for measuring movements is shown in Figure 3. The seven sensors are listed in Table 1. Pressure signal was translated into voltage through an op-amp circuit whose output can be set at 0–5 V according to the pressure on the sensor. A microcontroller (STM32F107VET6) was employed for analog-digital conversion, data processing and control of data transmission. The wireless transmission module CC2530 based on Zigbee communication was for digital data sending and receiving. All these modules were driven by two 3.3 V lithium batteries. Hence, this sensing system based on the distinction of foot pressure distribution pattern can be attached to and removed from shoes whenever required.
3. Feature Extraction Based on PCA The block diagram of foot pressure signal processing and analysis is exhibited in Figure 4, which consists of a feature abstracting module, a sensor network based data fusion part, and a classification module. These units are integrated in one system for moving pattern identification. Initially, raw pressure signals collected from the acquisition system had to be prepared for analysis. The purpose of data decomposition was to segment signal into subvectors. The normalized sample sets were applied to the feature extraction algorithm, which extract a series of feature elements from the inputs. Further, through the statistical feature transformation step, the data would be simplified into optimal form. For the purpose of optimizing the processing procedure, we applied multisensor based data fusion to reduce the number of detecting channels. With the construction of classifier, processed data were to be sent into the model for training and testing. Through this step, the recognition results were listed respectively. Consequently, the foot pressure pattern could be classified according to the
3 utilizing demand. We preliminarily aim at holding that simple classifiers can achieve high accuracy as long as the feature is robust and representative, which is important in practical application. Feature extraction is a major process of obtaining signal characteristics from time series data. Aiming at discriminating the reference class from other classes, feature selection can be considered as a data-compression process which removes irrelevant information and preserves relevant information from the raw data [24]. Typically, feature extraction approach applied to raw signals precedes the classification procedure. Principal component analysis (PCA) is the most commonly technique applied to data reduction in pattern recognition and classification [25]. The basic idea of PCA is to project the data onto a lower dimensional space, where most of the information is retained. It uses an orthogonal transformation to convert a set of observations of possibly correlated variables into a set of values of uncorrelated variables called principal components (PCs). The number of PCs should be less than or equal to that of original variables. This transformation is defined in such a way that the first PC has as high variance as possible, which accounts for as much of the variability in the data as possible. Each succeeding component has the highest variance possible under the constraint that it be orthogonal to preceding components. Assuming that we have a set of centered input vectors of foot pressure 𝑥𝑡 (𝑡 = 1, . . . , 𝑙 and ∑𝑙𝑡=1 𝑥𝑡 = 0) measured by sensor system, each of which is of 𝑚 dimension 𝑥𝑡 = (𝑥𝑡 (1), 𝑥𝑡 (2), . . . 𝑥𝑡 (𝑚))𝑇 , PCA linearly transforms each vector 𝑥𝑡 into a new one 𝑠𝑡 : 𝑠𝑡 = 𝑈𝑇 𝑥𝑡 ,
(1)
where 𝑈 is the 𝑚 ⋅ 𝑚 orthogonal matrix whose 𝑖th column 𝑢𝑖 is the 𝑖th eigenvector of the sample covariance matrix 𝐶 = (1/𝑙) ∑𝑙𝑡=1 𝑥𝑡 𝑥𝑡 𝑇 . Hence, eigenvalues of 𝐶 were obtained and 𝑢𝑖 is the corresponding eigenvector: 𝜆 𝑖 𝑢𝑖 = 𝐶𝑢𝑖 ,
𝑖 = 1, . . . , 𝑚.
(2)
Based on the estimated 𝑢𝑖 , the components of 𝑠𝑡 were therefore calculated as the orthogonal transformations of 𝑥𝑡 : 𝑠𝑡 (𝑖) = 𝑢𝑖𝑇 𝑥𝑖 ,
𝑖 = 1, . . . , 𝑚.
(3)
Thus, in PCA, the directions of the calculated PCs are uncorrelated with each other and computed by maximal variance. The new components we got are within a new dimensional space. By employing only a finite set of eigenvectors in the descending order of eigenvalues, the number of principal components in 𝑠𝑡 will be reduced. Therefore, the cumulative contribution rate of the first several components would be expressed as (1/𝑡) ∑𝑚 𝑖=1 𝑠𝑡 (𝑖). Usually the contribution rate value is over 95% to characterize the original data.
4. Pattern Recognition with SVM During the recognition phase, the features from the foot pressure signals have been extracted by combined methods.
4
International Journal of Distributed Sensor Networks
Foot pressure data
Signal denoising
Internal feature extraction
Signal decomposition Feature selection Statistical feature transformation Multisensor data fusion
Multisensor based feature fusion
Channel reduction
Classifier constructing
Machine learning model moving pattern classification
Classification model training Moving pattern recognition
Identification result
Figure 4: Process of moving pattern identification.
And they were fed into a classifier. Within this research, we took support vector machine to find the matching output by using these features. Support vector machine (SVM), which represents a major development in machine learning algorithms, is based on the foundation of statistical learning theory [26]. This algorithm is characterized by the ability to resolve problems of high-dimensional data and to represent the decision-making boundary in the form of training subsets, which is the general meaning of support vector [27, 28]. SVM has been widely applied to plenty of fields, such as pattern identification, regression analysis, and function approximating, and so forth [29, 30]. The results give the evidence that this technique cannot only satisfy from the theoretical perspective, but also can lead to high accuracy in practical applications. In this test, foot pressure detection is formulated as a classification problem, wherein the classifier is used to decide the moving pattern. Accordingly, the goal is to separate the moving pattern classes by a function which is induced from available examples. The basic SVM is to classify a series of points into two different classes of data (Figure 5). The SVM attempts to place a linear boundary represented by a solid line between the two different classes and tries to orient the boundary in such a fashion that the distance between the boundary and the nearest data point in each class is maximal. Given the training
H : {x|(w · x) + b = 0}
Margin
−b |w|
Figure 5: An example of classification of two classes by SVM.
vectors 𝑥𝑖 ∈ 𝑅𝑛 , 𝑖 = 1, . . . , 𝑁, in two classes, and an indicator 𝑦𝑖 ∈ {−1, +1}, SVM constructs a linear function: 𝑓 (𝑥) = 𝑤𝑇 𝑥 + 𝑏.
(4)
International Journal of Distributed Sensor Networks
5
(a)
(b)
Figure 6: Subject going up- and downstairs with instrumented shoes.
The parameters 𝑤 and 𝑏 are defined according to a primal optimization problem: 𝑙
1 min 𝐽 (𝑤, 𝜉) = min ( 𝑤𝑇 𝑤 + 𝐶 ∑ 𝜉𝑖 ) , 2 𝑖=1
(5)
(𝑦𝑖 (𝑤𝑇 Φ (𝑥𝑖 ) + 𝑏) ≥ 1 − 𝜉𝑖 , 𝜉𝑖 ≥ 0, 𝑖 = 1, . . . , 𝑁) , where 𝐶 is for controlling the trade-off between the model complexity and empirical risk [31]. We set another parameter for the classifier 𝐺 representing the kernel function for modeling. In this case, we utilize the kernel function into map input vector 𝑥𝑖 to a higher-dimensional space through a nonlinear mapping Φ(𝑥𝑖 ); the kernel concept can be written as: 𝐾 (𝑥𝑖 , 𝑥𝑗 ) = Φ𝑇 (𝑥𝑖 ) Φ (𝑥𝑗 ) .
(6)
Due to the possible high dimensionality of the vector variable 𝜔, we introduced Lagrange multipliers 𝛼𝑖 ≥ 0, 𝑖 = 1, 2, . . . , 𝑁, one for each of the constraints in (1), and we get the following Lagrangian: 𝑁 𝑁 1 𝐿 (𝑤, 𝑏, 𝛼) = ‖𝑤‖2 − ∑ 𝑦𝑖 𝛼𝑖 𝐾 (𝑤𝑥𝑖 − 𝑏) + ∑ 𝛼𝑖 . 2 𝑖=1 𝑖=1
(7)
Then the task is to minimize (7) with respect to 𝑤 and 𝑏 and to maximize it with 𝛼𝑖 . At the very optimal point, we have 𝑁
𝑤 = ∑ 𝑦𝑖 𝛼𝑖 𝑥𝑖 , 𝑖=1
𝑁
∑ 𝛼𝑖 𝑦𝑖 = 0.
(8)
𝑖=1
It is shown that 𝑤 is contained in the subspace spanned by 𝑥𝑖 in (8). By substituting (8) into (7), the decision function of SVM model can be derived as 𝑁
𝑓 (𝑥) = sign (∑ 𝛼𝑖 𝑦𝑖 (𝑥𝑖 , 𝑥) + 𝑏) .
(9)
𝑖=1
The formula above results in an optimization problem with convex constrains, which is readily to be solved by the interior point method. For the moving pattern recognition issue, we preliminarily took the foot pressure signals of the seven points in Figure 2 as input vectors. Thus the SVM classifier was enabled to identify different kinds of movements.
5. Channel Reduction During testing, the sensors transmit information about a common movement and the objective is to obtain an accurate identification of the moving pattern in the sensor field. Generally speaking, with more signal acquisition channels we can get more information. However, increasing the number of channel will definitely increase the complexity of computation and analysis that may lead to slow discrimination response. To overcome this limitation, we tend to find a way of using a reduced number of sensitive elements without compromising classification accuracy. On the other hand, the priority should be given to explore the relationship between the number of foot pressure sensors and the classification errors, respectively. Sensors on each insole can be regarded as a sensor network, which has independent power supply, regulator as well as signal conditioning module. For pilot phase, the information from data sets would be fused and for recognition. Data fusion of sensor network refers to the acquisition, processing, and synergistic combination of information gathered by various sensors to provide a better understanding of the phenomenon under consideration [32]. Therefore, the cooperative nature of the sensors can be exploited to improve the efficiency of resource utilization and the sensing performance [33]. Particularly, we focus on the number and distribution of pressure sensors in the sensor network. By analyzing the data fusion outcomes of sensors on different positions, the feasibility of channel reduction would be carried out. Due to the laboratory deployment, channel number of each foot would be reduced from 7 to 4 with a decrement step of 1. All possible combinations for a reduced number of channels were to be evaluated by classification accuracy for different movement classes. Consequently, the sensor distribution that produced the lowest classification error for each number of channels would be considered as the optimal channel configurations.
6. Experimental Results and Analysis The experiment was conducted to develop an automatic measuring system for revealing the relations between human motions and cumulative foot pressure characteristics. The experimental devices attached to the tester are shown in Figure 6. Our tests were carried out using a 24-year-old
16 14 12 10 8 6 4
0
2
1
3 Time (ms) Standing, right
4
2
4
3
5
5
0
0.25
0.25
0.5
0.5
14 12 10 8 6 4
Walking, left
0
1
0
1
2
3 Time (ms) Walking, right
2
3
Time (ms)
Time (ms)
(a)
(b)
Upstairs, left
0
Pressure level
1
Pressure level
0
20 15 10 5 0
0.75 Time (ms) Upstairs, right
1
0.75 Time (ms)
1
1.25
1.25
1.5
1.5
(c)
Pressure level
20 15 10 5 0
Standing, left
20 15 10 5 0
Pressure level
20 15 10 5 0
Pressure level
20 15 10 5 0
Pressure level
Pressure level
International Journal of Distributed Sensor Networks
Pressure level
6
16 14 12 10 8 6 4
4
5
4
5
Downstairs, left
0
0.25
0.5
0.75 Time (ms)
1
1.25
1.5
1
1.25
1.5
Downstairs, right
0
0.25
0.5
0.75 Time (ms) (d)
Figure 7: (a) Foot pressure distribution of standing still, (b) foot pressure distribution of walking, (c) foot pressure distribution of going upstairs, and (d) foot pressure distribution of going downstairs.
female wearer, 1.66 m tall. With the power supplied, foot pressure signals were gathered by FSR402 sensors every 40 ms and transmitted virtually through the data processing board to the computer wirelessly. The waveforms of each sensor on both feet were exhibited on the desktop simultaneously for monitoring. The signal processing procedure was implemented by Matlab 2010a, running on a PC with 2 G, 2 GHZ CPU. To evaluate the effectiveness of proposed methods in recognition, we choose four kinds of basic movements, which are standing still, walking, going upstairs, and going downstairs. Raw data on foot pressure distributions for each moving pattern were acquired with the developed foot pressure sensing shoes. Variation of foot pressure for each kind of movement was displayed in Figure 7. Pressure level represents the output value of digital information into which voltage is converted. According to the figure, when not moving, the values of foot pressure basically stay constant. For walking, it is clear that the patterns change in shape and the ratio of the time, which depend on pressurization to depressurization in each step, in agreement with the way we use our feet. In case of going upstairs and downstairs, a higher peak value within each step can be observed; however the wave patterns are different for each. Therein, we are aiming at identifying these movements based on the corresponding foot pressure.
6.1. Feature and Feature Selection. In this study, five internal time-domain parameters were picked up as eigenvalue, which are average value, standard deviation, maximum value, and minimum value as well as difference deviation. Features that represented the pressure signal were memorized in matrix and sent to the classifier. We picked up 630 sets of data samples of each moving pattern: the former 420 are for classifier training and the latter for testing. The training data and training label are used to form the whole training set. For the training part, we got an optimal 𝐶 of 724 and 𝐺 of 8 by cross-validation. The optimization of these two parameters is for obtaining a high recognition rate based on current training samples. The radial basis function (RBF) kernel is employed. Due to the use of SVM classifier in this study, foot pressure and corresponding moving states were classified into the four categories, respectively. The cross validation result (contour map and 3D view) of parameter selection is shown in Figure 8. The classification model was applied to predict the output category for testing samples identification. According to Figure 9, we summarize the classification performance results achieved by this SVM classifier. The average accuracy with all seven sensors is at 92.9% for all four kinds of movements and the diagnosis accuracy for each moving pattern is in Table 2. The running time calculated by Matlab is 0.46 seconds. Compared with the preset inputs, we sent the input matrix
7
SVC parameter selection results (3D view) [grid search method] Best C = 724.0773, G = 8, and CV accuracy = 91.9643 %
Accuracy (%)
SVC parameter selection results (contour map) [grid search method] Best C = 724.0773, G = 8, and CV accuracy = 91.9643 % 5 91 4.5 9 0. 5 4 91 .5 3.5 91 90.5 90.5 3 91.5 90.5 2.5 90.91 90.5 5 2 1.5 9 1 0 0.5 89.5 9 0. 5 0 5 5.5 6 6.5 7 7.5 8 8.5 9 9.5 10 log 2C 90
log 2G
International Journal of Distributed Sensor Networks
100 90 80 70 60 50 40 30 5
4
3 log 2G 2
1
0
(a)
10 8.5 9 9.5 7 7.5 8 6.5 6 5 5.5 log 2C (b)
Figure 8: (a) Contour map of parameter selection results and (b) 3D view of parameter selection results.
4 3 2.5
log 2G
Class label
3.5
2 1.5 1
0
100
200
300
400
500
600
700
800
900
Testing samples
Actual category Predict category
SVC parameter selection results (contour map) [grid search method] Best C = 1024, G = 32, and CV accuracy = 92.2619% 5 88.5 4.5 4 88 88.5 88.5 88 88.5 3.5 87.5 88 87.5 3 87 87 87.5 87 2.5 87 87 87 87 87 2 86.5 86.5 86 86.5 1.5 86 86 1 85.5 5 85. 85.5 85.5 0.5 85.5 86 0 86 10 10.1 10.2 10.3 10.4 10.5 10.6 10.7 10.8 10.9 11 log 2C (a)
SVC parameter selection results (3D view) [grid search method] Best C = 1024, G = 32, and CV accuracy = 92.2619%
Table 2: Accuracy of different movements with seven sensors. Moving pattern Training accuracy (%) Standing still 100 Walking 91.2 Going upstairs 93.1 Going downstairs 90.0
Testing accuracy (%) 100 91.0 93.7 86.7
Accuracy (%)
Figure 9: Actual and testing patterns of testing samples. 100 90 80 70 60 50 40 30 5
4
3 2 log 2G
1
0 10
10.2
10.4 10.6 log 2C
10.8
11
(b)
Figure 10: (a) Contour map of parameter selection results and (b) 3D view of parameter selection results.
to PCA processing algorithm for dimensionality reduction beforehand. Due to the aforementioned cumulative component rate in paragraph 3, we took the first three columns of PCs which occupied over 95% information of original data. A few numbers of new input eigenvectors provided sufficient information for foot pressure coding and movement recognition. The accuracy rate can be obtained when 𝐶 = 1024 and 𝐺 = 32, it reaches as high as 88.7% (Figure 10). The outcome of inputting the new eigenvectors in classifier is shown in Table 3. It could be noted that if a SVM classifier is used, declining recognition rate of moving patterns would be caused by PCA. Whereas, the classification time with proposed PCA algorithm did have a higher recognition speed, which was only 0.21 seconds. It decreased 0.25 seconds compared to the former classification.
Table 3: Accuracy of different movements with PCA. Moving pattern Training accuracy (%) Standing still 99.8 Walking 89.3 Going upstairs 90.8 Going downstairs 89.8
Testing accuracy (%) 100 80.5 88.6 86.2
6.2. Channel Reduction Outcome. Dimensionality reduction algorithm based on PCA recorded the variation of recognition accuracy and speed but does not show the influence of sensor distribution on the insole. In this study, the impact of acquisition channels on the recognition rate and recognition
8
International Journal of Distributed Sensor Networks Table 4: Accuracy of different movements (four sensors).
Moving pattern Training accuracy (%) Standing still 100 Walking 78.8 Going upstairs 88.3 Going downstairs 88.3
Testing accuracy (%) 91.5 76.5 85.0 84.5
Table 6: Accuracy of different movements (optimal set). Moving pattern Training accuracy (%) Standing still 100 Walking 88.8 Going upstairs 92.5 Going downstairs 92.3
Table 5: Average accuracy and response time of different sensors. Sensor distribution FSR1, 2, 4, 7 + FSR3 FSR1, 2, 4, 7 + FSR5 FSR1, 2, 4, 7 + FSR6 FSR1, 2, 4, 7 + FSR3 + FSR5 FSR1, 2, 4, 7 + FSR3 + FSR6 FSR1, 2, 4, 7 + FSR5 + FSR6
Average testing accuracy (%)
Running time (ms)
89.5 89.1 90.0
68 46 64
89.9
63
91.1
60
89.8
61
time will be tested. In previous researches, sensors were generally placed at toe, little ball, great ball, and toe heel on human physiological characteristics, which are position 1, 2, 7, and 4 in Figure 2, respectively [34, 35]. We took the data of FSR1, FSR2, FSR4, and FSR7 for data fusion. And then the testing result for combing the four sensors was obtained. Using sensors of different positions could produce similar intraposition classification performance, but distinct classification accuracy. The average recognition accuracy rate is 84.4% (Table 4), which was significantly different from that of 92.9% (seven sensors). However, the classification only took 0.13 s. With the same procedure, the number of multisensor decreasing from 6 to 4 was analyzed. The four basic sensors were FSR1, FSR2, FSR4, and FSR7 as mentioned before. Totally, the average classification accuracy across all positions is shown in Table 5. With the increase of sensor number, the multisensor network seems to be more sensitive to different moving patterns. The SVM classifier was trained and tested using data multiple positions. For the sake of comparison, the average accuracy rate was changed with distinguished sensor data fused. When the foot pressure data from positions 1, 2, 3, 4, 6, and 7 were involved in the training set, the average classification accuracy reached a maximum value of 91.1% (Table 6). It is also noteworthy that this data set led to a shortest running time, which is only 60 ms. Therefore, using six optimally selected channels produced 91.1% average classification accuracy and 60 ms response time over four motions, compared with 92.9% and 460 ms of seven sensors. The optimal arrangement of foot pressure sensor distribution is shown in Figure 11. The recognition error could be explained due to the finite measured data in that it was impossible to have an identical collection environment. Yet we cannot have a 100% accurate
Testing accuracy (%) 100 83.0 91.5 87.0
1
6
2 5 3
4
Figure 11: Rearrangement of measurement position.
rate. Hence, this method can be encapsulated and embedded into one single program for simplifying operation, with different sorts of foot pressure signals. So we dare to say, with the ability of the SVM classifier, the detecting system applied has got more reliable results, whose service performance and effectiveness can cater to the need of monitoring in commercial use.
7. Conclusion In this paper we suggested a laboratory setup for human moving pattern recognition based on foot pressure sensing. Pressure sensors, signal-conditioning module, microcontroller, as well as wireless transmitting devices, and so forth were integrated for signal acquisition and PCA, and data fusion of channel reduction and SVM were used to conduct the classification of several kinds of moving patterns. This laboratory setup has finished the following issues. (1) With the design of insole equipped with pressure sensors, foot pressure was obtained exactly and freely. (2) Specifically, to study the potential connections between moving patterns and foot pressure, we established an SVM based classifier. PCA algorithm was for feature dimension descending and multisensor data fusion for channel reduction. (3) We compared the outcome between PCA dimensionality reduction and channel in order to address a better identification way. (4) Data fusion technique can find an optimal number of sensors. This recognition can be better than that of PCA method for feature extraction. And the optimized SVM can improve the classification accuracy because of the best parameters.
International Journal of Distributed Sensor Networks The recognition accuracy of our optimal classification is as higher as 90.13%, which does have a fast time response at the same time. However, we have to point out that there still exists some deficiency. With the application of an advanced processor, that is, DSP, higher acquisition rate and conversion accuracy will be available, thus leading to a better classification performance. It should be noted that the testing of this study was only carried on one tester. In actual monitoring, other wearers’ movement should also be trained and classified. Owing to the existing problems, further steps will be taken to focus on gait transaction, which is more applicable for the controlling strategy of wearable robots. In spite of these limitations, this study did put forward its significance. And these issues will be discussed in further studies.
9
[9]
[10]
[11]
[12]
Conflict of Interests The authors declare that there is no conflict of interests regarding the publication of this paper.
[13]
Acknowledgments
[14]
This research is a general project (61305131) supported by the Natural Science Foundation of China. Special appreciation should be given to the Research Centre of Fluid Power Transmission and Control, Beihang University, for the sake of their selfless help.
[15]
[16]
References [1] C.-J. Yang, J.-F. Zhang, Y. Chen, Y.-M. Dong, and Y. Zhang, “A review of exoskeleton-type systems and their key technologies,” Proceedings of the Institution of Mechanical Engineers C, vol. 222, no. 8, pp. 1599–1612, 2008. [2] Z. Wang, M. Jiang, Y. Hu, and H. Li, “An incremental learning method based on probabilistic neural networks and adjustable fuzzy clustering for human activity recognition by using wearable sensors,” IEEE Transactions on Information Technology in Biomedicine, vol. 16, no. 4, pp. 691–699, 2012. [3] K. Y. Chen and D. R. Bassett Jr., “The technology of accelerometry-based activity monitors: current and future,” Medicine and Science in Sports and Exercise, vol. 37, no. 11, supplemet, pp. S490–S500, 2005. [4] C. N. Scanaill, S. Carew, P. Barralon, N. Noury, D. Lyons, and G. M. Lyons, “A review of approaches to mobility telemonitoring of the elderly in their living environment,” Annals of Biomedical Engineering, vol. 34, no. 4, pp. 547–563, 2006. [5] F. Pitta, M. Y. Takaki, N. H. D. Oliveira et al., “Relationship between pulmonary function and physical activity in daily life in patients with COPD,” Respiratory Medicine, vol. 102, no. 8, pp. 1203–1207, 2008. [6] P. Neuhaus and H. Kazerooni, “Industrial-strength humanassisted walking robots,” IEEE Robotics and Automation Magazine, vol. 8, no. 4, pp. 18–25, 2001. [7] A. Zoss, H. Kazerooni, and A. Chu, “On the mechanical design of the Berkeley Lower Extremity Exoskeleton (BLEEX),” in Proceedings of the International Conference on Intelligent Robots and Systems, pp. 3465–3472, 2005. [8] P. H. Veltink, C. Liedtke, E. Droog, and H. van Der Kooij, “Ambulatory measurement of ground reaction forces,” IEEE
[17]
[18]
[19]
[20]
[21]
[22]
[23]
[24]
Transactions on Neural Systems and Rehabilitation Engineering, vol. 13, no. 3, pp. 423–427, 2005. C. Liedtke, S. A. W. Fokkenrood, J. T. Menger, H. van der Kooij, and P. H. Veltink, “Evaluation of instrumented shoes for ambulatory assessment of ground reaction forces,” Gait and Posture, vol. 26, no. 1, pp. 39–47, 2007. E. S. Sazonov, T. Bumpus, S. Zeigler, and S. Marocco, “Classification of plantar pressure and heel acceleration patterns using neural networks,” in Proceedings of the IEEE International Joint Conference on Neural Networks (IJCNN ’05), vol. 5, pp. 3007– 3010, 2005. T. Becker, M. Kluge, J. Schalk et al., “Autonomous sensor nodes for aircraft structural health monitoring,” IEEE Sensors Journal, vol. 9, no. 11, pp. 1589–1595, 2009. C. J. Stam, M. Breakspear, A.-M. van Cappellen van Walsum, and B. W. van Dijk, “Nonlinear synchronization in EEG and whole-head MEG recordings of healthy subjects,” Human Brain Mapping, vol. 19, no. 2, pp. 63–78, 2003. S. L. Bressler and J. A. S. Kelso, “Cortical coordination dynamics and cognition,” Trends in Cognitive Sciences, vol. 5, no. 1, pp. 26– 36, 2001. R. C. Luo, C.-C. Yih, and K. L. Su, “Multisensor fusion and integration: approaches, applications, and future research directions,” IEEE Sensors Journal, vol. 2, no. 2, pp. 107–119, 2002. K. Sampigethaya, R. Poovendran, L. Bushnell, M. Li, R. Robinson, and S. Lintelman, “Secure wireless collection and distribution of commercial airplane health data,” IEEE Aerospace and Electronic Systems Magazine, vol. 24, no. 7, pp. 14–20, 2009. F. Hu, Y. Xiao, and Q. Hao, “Congestion-aware, loss-resilient bio-monitoring sensor networking for mobile health applications,” IEEE Journal on Selected Areas in Communications, vol. 27, no. 4, pp. 450–465, 2009. M. Venugopal, K. E. Feuvrel, D. Mongin et al., “Clinical evaluation of a novel interstitial fluid sensor system for remote continuous alcohol monitoring,” IEEE Sensors Journal, vol. 8, no. 1, pp. 71–80, 2008. B. C. Arrue, A. Ollero, and J. R. Martinez de Dios, “An intelligent system for false alarm reduction in infrared forestfire detection,” IEEE Intelligent Systems and Their Applications, vol. 15, no. 3, pp. 64–73, 2000. J. Rosen and J. C. Perry, “Upper limb powered exoskeleton,” International Journal of Humanoid Robotics, vol. 4, no. 3, pp. 529–548, 2007. H. Lee, W. Kim, J. Han, and C. Han, “The technical trend of the exoskeleton robot system for human power assistance,” International Journal of Precision Engineering and Manufacturing, vol. 13, no. 8, pp. 1491–1497, 2012. R. M. Queen, A. N. Abbey, J. I. Wiegerinck, J. C. Yoder, and J. A. Nunley, “Effect of shoe type on plantar pressure: a gender comparison,” Gait and Posture, vol. 31, no. 1, pp. 18–22, 2010. M. J. Hessert, M. Vyas, J. Leach, K. Hu, L. A. Lipsitz, and V. Novak, “Foot pressure distribution during walking in young and old adults,” BMC Geriatrics, vol. 5, article 8, 2005. M. M. Rodgers, “Dynamic foot biomechanics,” Journal of Orthopaedic and Sports Physical Therapy, vol. 21, no. 6, pp. 306– 316, 1995. D. Tao, X. Li, X. Wu, and S. J. Maybank, “General tensor discriminant analysis and Gabor features for gait recognition,” IEEE Transactions on Pattern Analysis and Machine Intelligence, vol. 29, no. 10, pp. 1700–1715, 2007.
10 [25] R. Polikar, “Pattern recognition in bioengineering,” in Wiley Encyclopedia of Biomedical Engineering, M. Akay, Ed., vol. 4, pp. 2695–2716, New York, NY, USA, Wiley Interscience, 2006. [26] O. Ivanciuc, “Applications of support vector machines in chemistry,” Reviews in Computational Chemistry, vol. 23, pp. 291–400, 2007. [27] C. H. Huang, “A reduced support vector machine approach for interval regression analysis,” Information Sciences, vol. 217, pp. 56–64, 2012. [28] X. Peng and D. Xu, “Twin Mahalanobis distance-based support vector machines for pattern recognition,” Information Sciences, vol. 200, pp. 22–37, 2012. [29] C. J. C. Burges, “A tutorial on support vector machines for pattern recognition,” Data Mining and Knowledge Discovery, vol. 2, no. 2, pp. 121–167, 1998. [30] Y.-X. Lai, C.-F. Lai, Y.-M. Huang, and H.-C. Chao, “Multiappliance recognition system with hybrid SVM/GMM classifier in ubiquitous smart home,” Information Sciences, vol. 230, pp. 39–55, 2013. [31] I. El-Naqa, Y. Yang, M. N. Wernick, N. P. Galatsanos, and R. M. Nishikawa, “A support vector machine approach for detection of microcalcifications,” IEEE Transactions on Medical Imaging, vol. 21, no. 12, pp. 1552–1563, 2002. [32] P. K. Varshney, “Multisensor data fusion,” Electronics and Communication Engineering Journal, vol. 9, no. 6, pp. 245–253, 1997. [33] Y.-W. P. Hong, K.-U. Lei, and C.-Y. Chi, “Channel-aware random access control for distributed estimation in sensor networks,” IEEE Transactions on Signal Processing, vol. 56, no. 7, pp. 2967–2980, 2008. [34] C. M. Senanayake and S. M. N. A. Senanayake, “Computational intelligent gait-phase detection system to identify pathological gait,” IEEE Transactions on Information Technology in Biomedicine, vol. 14, no. 5, pp. 1173–1179, 2010. [35] E. Parikesit, T. L. R. Mengko, and H. Zakaria, “Wearable gait measurement system based on accelerometer and pressure sensor,” in Proceedings of the International Conference on Instrumentation, Communication, Information Technology and Biomedical Engineering (ICICI-BME ’11), pp. 395–398, Bandung, Indonesia, November 2011.
International Journal of Distributed Sensor Networks
International Journal of
Rotating Machinery
Engineering Journal of
Hindawi Publishing Corporation http://www.hindawi.com
Volume 2014
The Scientific World Journal Hindawi Publishing Corporation http://www.hindawi.com
Volume 2014
International Journal of
Distributed Sensor Networks
Journal of
Sensors Hindawi Publishing Corporation http://www.hindawi.com
Volume 2014
Hindawi Publishing Corporation http://www.hindawi.com
Volume 2014
Hindawi Publishing Corporation http://www.hindawi.com
Volume 2014
Journal of
Control Science and Engineering
Advances in
Civil Engineering Hindawi Publishing Corporation http://www.hindawi.com
Hindawi Publishing Corporation http://www.hindawi.com
Volume 2014
Volume 2014
Submit your manuscripts at http://www.hindawi.com Journal of
Journal of
Electrical and Computer Engineering
Robotics Hindawi Publishing Corporation http://www.hindawi.com
Hindawi Publishing Corporation http://www.hindawi.com
Volume 2014
Volume 2014
VLSI Design Advances in OptoElectronics
International Journal of
Navigation and Observation Hindawi Publishing Corporation http://www.hindawi.com
Volume 2014
Hindawi Publishing Corporation http://www.hindawi.com
Hindawi Publishing Corporation http://www.hindawi.com
Chemical Engineering Hindawi Publishing Corporation http://www.hindawi.com
Volume 2014
Volume 2014
Active and Passive Electronic Components
Antennas and Propagation Hindawi Publishing Corporation http://www.hindawi.com
Aerospace Engineering
Hindawi Publishing Corporation http://www.hindawi.com
Volume 2014
Hindawi Publishing Corporation http://www.hindawi.com
Volume 2014
Volume 2014
International Journal of
International Journal of
International Journal of
Modelling & Simulation in Engineering
Volume 2014
Hindawi Publishing Corporation http://www.hindawi.com
Volume 2014
Shock and Vibration Hindawi Publishing Corporation http://www.hindawi.com
Volume 2014
Advances in
Acoustics and Vibration Hindawi Publishing Corporation http://www.hindawi.com
Volume 2014