Human Nutrition and Metabolism
Absorption, Distribution and Excretion of Selenium from Beef and Rice in Healthy North American Men1,2 Wayne Chris Hawkes,3 Fulya Zeynep Alkan and Lynn Oehler U.S. Department of Agriculture, Agricultural Research Service, Western Human Nutrition Research Center and Department of Nutrition, University of California at Davis, Davis, CA
KEY WORDS: ● selenium absorption skeletal muscle
●
selenium balance
●
selenium excretion
●
food selenium
●
Selenium is an essential trace nutrient for humans, animals and bacteria. Klaus Schwartz and colleagues at the National Institutes of Health discovered selenium’s nutritional essentiality in rats in 1957 (1), and similar findings were reported in chicks that same year (2). Selenium’s role as a component of glutathione peroxidase was discovered in 1973 (3), and the form of selenium at the active site was found to be selenocysteine in 1978 (4). Protein-bound selenocysteine is the predominant form of selenium in rats fed sodium selenite (5,6), and- many selenocysteine-containing proteins have been re-
ported, including several novel genes identified in silico that also seem to code for selenocysteine proteins (7). The U.S. recommended dietary allowance (RDA) for selenium is 55 g/d (697 nmol/d) for adult men (8), and the minimum requirement for men has been estimated at 21 g/d (266 nmol/d) (9). The U.S. Environmental Protection Agency established an “oral reference dose” of 5 g (63 nmol)/(kg body weight 䡠 d) (10) and the National Academy of Sciences has set the maximum safe dietary intake at 400 g/d (5.07 mol/d) (8). The vast majority of nutritional research on selenium has been conducted in rats and mice and usually with sodium selenite, purified selenoamino acids or other small-molecular-weight selenium compounds. Most of the human studies reported in the literature also used these small selenium compounds, rather than selenium in foods. Smallmolecular-weight selenium compounds, selenoamino acids and food selenium all have different bioavailabilities and different spectra of biological activities (11,12); different plant foods also seem to have different distributions of selenium compounds (13). Although animals, and presumably humans, are able to efficiently utilize nutritionally adequate levels of selenium from all of these different forms and sources to support selenoprotein synthesis, it is clear that the potencies and biological activities are dependent, sometimes to a very large degree, on the source and chemical form of the selenium administered (11,14 –17).
1 Portions of this material were previously presented at the First International Bio-Minerals Symposium, April 2001, Salt Lake City, UT [Hawkes, W.C. (2001) The biological effects of dietary selenium: can selenium supplementation decrease risk of chronic diseases? In: First International Bio-Minerals Symposium: Trace Elements in Nutrition, Health and Disease (Schrauzer, G. N., ed.) pp. 32– 42. Institut Rosell Lallemand and International Association of Bioinorganic Scientists] and in an oral presentation by Hawkes, W. C. at the Sixth International Symposium on Selenium in Biology and Medicine, August 18 –22, 1996 in Beijing, China. 2 U.S. Department of Agriculture Agricultural Research Service Project 5306 – 51530-010 – 00D supported this research. Mention of trade name, proprietary product, or specific equipment does not constitute a guarantee or warranty by the U.S. Department of Agriculture, nor does it imply approval to the exclusion of other products that may be suitable. The opinions expressed herein represent those of the authors and do not necessarily represent those of the U.S. Department of Agriculture. 3 To whom correspondence should be addressed. E-mail:
[email protected].
0022-3166/03 $3.00 © 2003 American Society for Nutritional Sciences. Manuscript received 23 May 2003. Initial review completed 7 July 2003. Revision accepted 21 August 2003. 3434
Downloaded from jn.nutrition.org at USDA, National Agricultural Library on December 28, 2007
ABSTRACT Previous metabolic studies of selenium used pure selenium compounds with pharmacologic activities unrelated to selenium nutrition. Healthy men were fed foods naturally high or low in selenium while confined to a metabolic research unit. Selenium intake was 47 g/d (595 nmol/d) for 21 d while energy intakes and body weights were stabilized and selenium excretion and intake came into metabolic balance. On d 22, selenium intake was changed to either 14 g/d (177 nmol/d, low selenium) or 297 g/d (3.8 mol, high selenium) for the remaining 99 d. The absorption, distribution and excretion of selenium in food were similar to selenomethionine, and distinctly different from sodium selenite. Daily urinary selenium excretion and selenium concentrations in plasma and RBC showed the largest responses to selenium intake relative to interindividual variation. Urinary selenium and plasma selenium responded most rapidly to changes in selenium intake, whereas RBC reflected longer-term selenium intake. Given the difficulty of 24-h urine collections outside a metabolic research unit, RBC and plasma selenium seem to be the most useful indicators of selenium intake. During the intervention period, the high selenium group retained 15 mg (190 mol) of selenium, with ⬃5 mg (63 mol) going into skeletal muscle. The low selenium group lost only 0.9 mg (11 mol) of whole-body selenium but lost 3.3 mg (42 mol) from muscle, indicating that selenium was redistributed from muscle to tissues that have a higher metabolic priority for selenium such as testes. Fecal excretion decreased by half, representing an important but previously underappreciated adaptation to selenium restriction. J. Nutr. 133: 3434 –3442, 2003.
SELENIUM METABOLISM AND STATUS
3435
TABLE 1 Initial characteristics of men consuming low selenium and high selenium diets1
Age, y Height, cm Weight, d 21, kg BMI, d 21, kg/m2 Blood plasma [Se],2 prestudy, g/L Energy intake, initial value, MJ/d
Low selenium diet
High selenium diet
31 ⫾ 9 (26–45) 181 ⫾ 4.2 (174–185) 74.9 ⫾ 9.8 (66–90) 22.8 ⫾ 3.3 (19–27) 132 ⫾ 17 (115–165) 11.4 ⫾ 0.57 (10.9–12.1)
35 ⫾ 7 (20–44) 178 ⫾ 5.8 (170–184) 73.5 ⫾ 12.6 (60–94) 23.3 ⫾ 4.4 (18–29) 122 ⫾ 18 (107–154) 10.9 ⫾ 1.0 (10.0–12.5)
1 Values are means ⫾ SD (range); n ⫽ 6 (low Se) and 5 (high Se). 2 1 g Se ⫽ 12.7 nmol.
SUBJECTS AND METHODS Subjects. Healthy male volunteers (n ⫽ 12) were recruited for this study from a pool of 148 candidates who passed an initial telephone screening. Exclusion criteria were as follows: weight for height ⬎ 125% of ideal (23); use of selenium supplements or selenium-containing shampoos; abnormal electrocardiogram, blood cell counts, clinical chemistries or semen analysis; HIV infection; use of illegal drugs; habitual use of tobacco or alcohol; chronic use of medications; history of psychiatric illness; and history of thyroid or heart disease, syphilis, hepatitis, diabetes, hypertension or hyperlipidemia. It was subsequently determined that one subject in the high selenium group had been a user of selenium-containing shampoo before entering the study; his blood selenium and glutathione peroxidase activities were normal and his hair selenium returned to normal by wk 9, allowing inclusion of his data. One subject in the high selenium group withdrew from the study after 60 d for personal reasons unrelated to the study, and his data are not included. The initial characteristics of the 11 subjects who completed the study are shown in Table 1. There were no significant differences between the groups in these characteristics. The subjects were confined in a metabolic research unit for 120 d under 24-h supervision by staff members. Subjects participated in two required 3.22-km walks per day, and were always escorted by staff members when out of the metabolic research unit. No other forms of exercise were permitted. The Human Subjects Review Committees of the University of California at Davis and the USDA approved the study protocol. The protocol was reviewed with the study volunteers and their informed consent was obtained in writing before the study, in accordance with the Common Federal Policy for Protection of Human Research Subjects. Experimental diets and treatments. Study subjects were fed a diet composed of conventional foods, based on beef and rice as staples, with nonfat milk powder as a protein supplement. To ensure an adequate intake of micronutrients, one multivitamin, multimineral supplement tablet, free of selenium (“Unicap M,” Upjohn,
Kalamazoo, MI), was administered to each subject each day. The total diet (food plus supplements) contained at least 100% of the RDA for all nutrients except magnesium, calcium and selenium (Table 2). The diet was fed in three daily meals and an evening snack, in a repeating cycle of 8 daily menus, using the same quantities of rice, beef and powdered milk every day (Table 3). Foods for each meal were weighed individually to the nearest gram. All meals were consumed completely under the direct observation of staff members. Plates were cleaned with rubber spatulas, cups and glasses were rinsed with distilled water and the residues were consumed. High selenium beef was obtained from a 2-y-old heifer selected from a South Dakota ranch for high hair selenium concentration. Low selenium beef was obtained from New Zealand as frozen ground bull meat. The ground beef was mixed with buffalo fat to give 20
TABLE 2 Composition of low selenium and high selenium diets fed to men1 Daily intake
RDA
Method reference
unit/11.7 MJ Protein, g (% of energy) 68.5 (10.6) 6 Carbohydrate, g (% of energy) 357 (55) NA Fat, g (% of energy) 99.2 (34.4) NA Saturated,2 g 32.0 NA Monounsaturated,2 g 35.7 NA Polyunsaturated,2 g 25.8 NA Fiber,2 g 6.1 NA 253 NA Cholesterol,2 mg Se (stabilization),3 g 47 55 Se (low), g 14 55 Se (high), g 297 55 Iodine,2 g 280 150 Calcium, mg 572 10004 Iron, mg 28.3 8 Magnesium, mg 195 420 Phosphorus, mg 1013 700 Zinc, mg 28.4 11 Copper, mg 2.93 0.9 Manganese, mg 3.68 2.35 Potassium, mg 2645 1875–56256
(24) (69) (24)
(31) (31) (31) (70) (27) (27) (27) (27) (27) (27) (27) (27)
1 Unless otherwise indicated, values are means from duplicate analyses of composites of foods from each experimental diet prepared on two different occasions. Contributions from the daily multivitamin, multimineral supplement are included. RDA, recommended dietary allowance; NA, not available. 2 Dietary component estimated from food composition tables (69). 3 1 g Se ⫽ 12.7 nmol). 4 Adequate Intake (65). 5 Adequate Intake (71). 6 Estimated Safe and Adequate Daily Dietary Intake (72).
Downloaded from jn.nutrition.org at USDA, National Agricultural Library on December 28, 2007
The chemical forms of selenium in the human diet have not been well characterized. Much of the selenium in plants is in small selenoamino acid compounds, with 64 –73% of the selenium in wheat and yeast recoverable in the “methylselenium” fraction derived from selenomethionine and methylated selenocysteine derivatives (18). Animal-derived food products seem to contain selenium mainly as selenocysteine and selenomethionine in proteins; roughly half of the U.S. selenium intake comes from animal sources and about half from plant sources (19). There have been only a few small metabolic studies of selenium reported in humans, one feeding wheat or meat for 9 wk (20), another feeding sodium selenite for 7 wk (21), and one feeding wheat and tuna for 7 wk (22). We report here our observations on selenium metabolism in healthy men continuously fed conventional foods naturally low or high in selenium for 17 wk while confined in a metabolic research unit.
HAWKES ET AL.
3436
TABLE 3 Representative daily menus of low selenium and high selenium diets fed to men1 Day
1
2
3
4
Beef sausage, 91 g Low protein bread, 32 g Jelly, 28 g Banana, 50 g Flavored milk drink: powdered milk, 32 g sugar, 12 g instant decaf coffee, 2 g corn oil, 23 g
Sweetened rice: white rice, 200 g syrup, 36 g canned apricots, 193 g Flavored milk drink: powdered milk, 32 g sugar, 12 g instant decaf coffee, 2 g corn oil, 23 g
Lunch
Stir-fry: white rice, 200 g cabbage, 50 g teriyaki sauce, 20 g corn oil, 11 g Green salad: lettuce, 44 g tomato, 60 g Italian dressing, 28 g Stuffed bell peppers: green pepper, 60 g white rice, 200 g tomato sauce, 50 g ground beef, 91 g Canned peaches, 250 g
“Pasta” salad: white rice, 200 g ground beef, 82 g celery, 50 g carrots, 50 g Italian dressing, 56 g
Spaghetti w/meat sauce: low protein pasta, 124 g ground beef, 100 g tomato sauce, 70 g corn oil, 20 g Apple sauce, 140 g
Sweetened rice: white rice, 150 g orange marmalade, 56 g butter, 7 g Flavored milk drink: powdered milk, 32 g sugar, 12 g instant decaf coffee, 2 g corn oil, 23 g Apple, 170 g Curried rice salad: white rice, 250 g ground beef, 82 g tomato, 90 g green pepper, 33 g lard, 19 g onion, 6 g curry powder, 1 g Canned peaches, 170 g Ground beef patty, 100 g Pasta: low protein pasta, 100 g corn oil, 14 g Mixed vegetables, 88 g w/butter, 7 g
Low protein cookies, 30 g Canned pears, 250 g Coca-Cola (sugared), 247 g Apple juice, 362 g
Canned pineapple, 200 g
Canned pears, 172 g
Low protein cookie, 30 g
7-UP (sugared), 337 g Grapefruit juice, 144 g
Orange soda (sugared), 305 g Pineapple juice, 167 g
Coca-Cola (sugared), 512 g Grape juice, 322 g
Dinner
Evening snack All day
Corn flakes, 25 g w/powdered milk, 10 g Canned pears, 300 g Flavored milk drink: powdered milk, 32 g sugar, 12 g instant decaf coffee, 2 g corn oil, 23 g Casserole: ground beef, 182 g rice, 100 g lard, 14 g barbecue sauce, 35 g Broccoli, 42 g w/butter, 7 g Fruit cocktail, 136 g Fried rice: white rice, 300 g green pepper, 33 g water chestnuts, 30 g corn oil, 17 g soy sauce, 18 g onion, 6 g
1 Amounts of foods correspond to an energy intake of 11.7 MJ/d. Minor condiments and seasonings (⬍1 g) are not shown. Ground beef, rice, pasta, and cabbage are shown as cooked weights.
g/100 g fat. The final selenium concentrations were 0.55 g/g (6.97 nmol/g) and 0.023 g/g (0.29 nmol/g) wet weight in the high selenium and low selenium beef, respectively. High selenium long-grain white rice was obtained from Enshi county, Hubei province in China; its selenium concentration was 2.9 g/g (37 nmol/g) dry weight. Low selenium long-grain white rice was obtained from Mianning county, Sichuan province in China, and the selenium concentration was 0.004 g/g (0.05 nmol/g) dry weight. The diet design was constrained by a requirement that half of the selenium come from animal sources and half from plant sources, which is typical of human diets (19). The low selenium diet was designed to provide the lowest achievable selenium intake subject to the above constraint, while providing adequate protein. The high selenium diet was intended to provide the oral reference dose of 350 g/d (4.4 mol/d) (10), but was limited by the above constraint and by the selenium concentration in the beef. The nutrient composition of the experimental diets (Table 2) was analyzed in composite samples representative of the three diets. For each of the three diets, each of the 8 daily menus was prepared for a mock subject on two separate occasions during the study, and that day’s food was homogenized and freeze-dried. Portions of the 16 freeze-dried samples representing each experimental diet were then combined to yield three grand composites, one each for the stabilization diet, the low selenium diet and the high selenium diet. These three grand composite samples were subsequently analyzed for nutrient contents at a commercial laboratory (Corning-Hazelton, Madison, WI) using standard methods (24). Because chemical analysis of the three experimental diets revealed no differences greater than the imprecision of the methods in the amounts of protein, fat, carbohydrate, energy, cystine, methionine, mercury, cadmium, calcium, copper, iron, magnesium, manganese, molybdenum, nickel, phosphorus, potassium, sodium or zinc, only the mean values for all three diets are shown in Table 2. Although iodine was determined in the diet
composites, the results in all three diets were below the method’s detection limit; thus Table 2 shows the value calculated from food composition tables, plus the daily supplement. The concentrations of mercury (25,26), cadmium (27), molybdenum (27), nickel (27) and arsenic (28,29) were also below the limits of detection of their respective methods (data not shown). The selenium contents of the three diets were analyzed in-house, as described below. For the first 21 d (stabilization period), all subjects were fed a diet that provided 47 ⫾ 4 g/d (595 ⫾ 51 nmol/d) of selenium at the mean energy intake of 11.7 MJ/d to adapt the subjects to the experimental diet and stabilize their body weights. The initial energy requirement of each subject was estimated from the Harris-Benedict equation (30); then the energy intake of each subject was adjusted as needed to maintain a constant body weight. When energy intakes were changed, all components of the diet were changed proportionally such that the relative composition of the diet was constant. Six adjustments were made to subjects’ intake, for a net increase of 0.07– 0.08 MJ/d in both groups, similar to the day-to-day SD in diet preparation of ⫾ 0.075 MJ/d (0.6% CV). On d 22, after blocking into six pairs matched for blood selenium concentrations, the subjects were randomly assigned to receive either 14 ⫾ 2.6 g/d (177 ⫾ 33 nmol/d, low selenium diet) or 297 ⫾ 26 g/d (3.8 ⫾ 0.3 mol/d, high selenium diet) for the remaining 99 d (intervention period), based on an average energy intake of 11.7 MJ/d. The only difference between the experimental diets was the geographic origin of the rice and beef, which were obtained from regions with either very high or very low soil selenium; all other components of the three diets were identical. Subjects and analysts had no knowledge of the diet assignments. An oral dose of sodium selenite was given on d 110. On this day only, all subjects were fed the low selenium diet and were administered an oral dose of Na274SeO3 with the morning meal as follows: 10
Downloaded from jn.nutrition.org at USDA, National Agricultural Library on December 28, 2007
Breakfast
SELENIUM METABOLISM AND STATUS
to protein ratio (g selenium/g protein). The biopsy samples were homogenized thoroughly in 1 mL of 50 mmol/L Tris-HCl, 0.1% Triton-X100, pH 7.5, with a micro rotor-stator grinder (0.7 cm diameter). Protein concentration was determined in a 50-L aliquot of the homogenate, using the bicinchoninic acid method (36). The entire remainder of each homogenized biopsy sample was analyzed for selenium as described above. However, because the selenium content was near the limit of detection, the cyclohexane extracts were analyzed by HPLC in triplicate. The mean of the triplicate selenium estimates in each sample was divided by the estimated protein content of that sample, and the change in selenium/protein ratio was calculated for each subject. Statistical analysis. Effects of dietary selenium were examined using repeated-measures ANOVA, controlling for each subject’s baseline value, or by a t test of the within-subject changes when only a baseline and final measurement were made. The ANOVA calculations were performed with BMDP 7.0 program 2V, Analysis of Variance and Covariance with Repeated Measures (Los Angeles, CA). The ANOVA included a complete model: Selenium, Time, Covariate (baseline value), and Selenium ⫻ Time. A two-tailed probability ⱕ 0.05 was considered significant. Effects due to dietary selenium were detected as significant Selenium main effects or as significant Selenium ⫻ Time interactions, and the Student-Newman-Keuls multiple comparison test was used to identify significant differences between the groups at individual time points. The estimates of data variability are SD, unless otherwise noted.
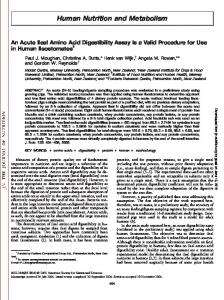
RESULTS The two treatment groups were well balanced with respect to gross anthropometric characteristics and initial selenium status (Table 1). The mean initial plasma selenium concentration was slightly higher than the mean of 124.5 g/L (1.58 mol/L) observed in 17,630 National Health and Nutrition Examination Survey III participants (8) and higher than the mean of 114 g/L (1.44 mol/L) in the Nutritional Prevention of Cancer trial (37). By the end of the 21-d baseline period, the mean plasma selenium concentration in our subjects had decreased to 113 g/L (1.43 mol/L). During the first 21 d, energy intakes were adjusted until body weights were stabilized and body weights subsequently changed ⬍1% (data not shown). Plasma selenium concentration was noticeably elevated within 3 d of starting the high selenium diet (Fig. 1) and ended 85% higher than at baseline (Table 4). Plasma sele-
FIGURE 1 Plasma selenium concentration in men consuming the high selenium diet or the low selenium diet. Points represent the group means ⫾ SEM (1 g Se ⫽ 12.7 nmol). *Significantly different from the low selenium group at that time point, P ⬍ 0.05.
Downloaded from jn.nutrition.org at USDA, National Agricultural Library on December 28, 2007
g selenium (127 nmol) for the low selenium group and 300 g selenium (3.8 mol) for the high selenium group. This may have affected the selenium balance at the end of the study. All of the stable isotope samples were lost in the 1997 flood of Grand Forks, ND and were not analyzed. Specimen collection and laboratory measurements. Blood samples for selenium and glutathione peroxidase determinations were collected into evacuated 15-mL EDTA tubes at 0700 h after an overnight fast of 12 h and kept on ice. Blood was centrifuged for 10 min at 190 ⫻ g at 5°C. The platelet-rich plasma was removed and saved for platelet isolation. The “buffy coat” containing white blood cells was removed and discarded. RBC were washed three times with chilled normal saline and stored at ⫺70°C until analyzed. The platelet-rich plasma was centrifuged for 10 min at 950 ⫻ g at 5°C. The overlaying plasma was removed and stored at ⫺70°C. The pelleted platelets were gently resuspended in 1.5 mL chilled HBSS and centrifuged again for 10 min at 950 ⫻ g at 5°C. After removal of the overlaying solution, the final platelet pellet was resuspended vigorously in 50 mmol/L Tris-HCl, 0.1% Triton-X100, pH 7.5, and frozen at ⫺70°C until analysis. Blood samples for clinical chemistries were clotted, and the serum was separated by centrifugation and refrigerated until analyzed each night at a reference laboratory (“Chemzyme Plus,” Smith-Kline Beecham, Santa Cruz, CA). Complete collections of urine and feces were obtained throughout the first 42 d of the study, and then twice more for 10 d beginning on day 72 (72– 81) and day 110 (110 –119). Samples from the first 42 d were collected in 14 ⫻ 3-d pools for each subject; the subsequent samples were collected in 4 ⫻ 5-d pools. Urine was collected for 24 h in 2.5 L plastic jugs and kept at 4°C until pooled (within 3 d). Aliquots for selenium and nitrogen analyses were acidified by addition of 5 g/L concentrated HCl and stored at –20°C until analyzed. Feces was collected into 15-cm plastic buckets and kept at 4°C, and then stored at –20°C until processed. Frozen daily fecal samples were thawed and quantitatively transferred to a preweighed 2-L stainless steel blender jar using distilled water. After thorough homogenization of the pooled fecal sample to a thin slurry, the blender jar and contents were weighed and the total homogenate weight was calculated. Between 80 and 250 g of homogenized feces was transferred into preweighed plastic jars, weighed and then freeze-dried for subsequent analyses. The rest of the fecal homogenates were discarded. The wet-weight/dry-weight ratio was used to calculate the total dry weight of each fecal pool. This total dry weight was used to calculate total fecal pool contents of selenium and nitrogen from the respective concentrations measured in the freeze-dried specimens. Selenium was measured by fluorescence-derivatization HPLC (31). Selenium-dependent glutathione peroxidase activity with cumene hydroperoxide and total protein were determined by automated colorimetric methods (32,33). Glutathione peroxidase units were expressed as moles of NADPH oxidized per second by comparison to standards of bovine erythrocyte glutathione peroxidase (Product No. G-6137, Sigma, St. Louis, MO). Nitrogen was analyzed by the dry combustion method (34) on an automated nitrogen analyzer (Model 428, LECO, St. Joseph, MI). Urine creatinine was measured in unacidified urine by a kinetic modification of the Jaffe method (35) on a centrifugal analyzer (Cobas-Fara, Roche Diagnostics, Basel, Switzerland). Muscle biopsies. Biopsies were obtained by a licensed physician from the vastus lateralis muscle ⬃15 cm above the patella under local anesthesia with 1% topical lidocaine. After disinfecting the site, a small scalpel incision was made through the skin and deep fascia. The 11-gauge outer cannula of the needle set with a side opening was inserted into the muscle tissue to a depth of 1–2 cm. The sides of the incision were compressed and the inner (sharpened) needle was inserted to cut off the biopsy sample. The biopsy tissue was recovered by washing the needle with saline solution. The incision was closed with a butterfly suture and the subjects’ daily walks were canceled for the next 2 d to minimize discomfort. The baseline biopsy samples were obtained on d 19 of the study, and the repeat biopsy samples were taken at the end of the study on d 117 from the opposite leg. Between 2 and 18 mg of tissue were obtained at each sampling. Because the biopsies were a heterogeneous mixture of muscle fibers, fascia and fatty tissues, whereas selenium is associated primarily with protein, we based the selenium measurements on the selenium
3437
HAWKES ET AL.
3438
TABLE 4 Effects of low selenium and high selenium diets on indicators of selenium nutritional status in men1 Low Se diet
Plasma Se,4 g/L Plasma glutathione peroxidase, nkat/L RBC Se, g/L RBC glutathione peroxidase, nkat/g protein Platelet glutathione peroxidase, nkat/g protein Muscle Se, g/g protein Hair Se, g/g Urinary Se excretion, g/d Fecal Se excretion, g/d
Baseline3
Final
Baseline
Final
Se
Time
Se ⫻ Time
118 ⫾ 8 36 ⫾ 3.7 158 ⫾ 11 212 ⫾ 52 650 ⫾ 250 1.93 ⫾ 0.59 0.56 ⫾ 0.14 33 ⫾ 9.0 17.5 ⫾ 4.7
78 ⫾ 12 32 ⫾ 3.5 116 ⫾ 11 197 ⫾ 47 530 ⫾ 270 1.56 ⫾ 0.39 0.32 ⫾ 0.02 14.9 ⫾ 4.9 8.9 ⫾ 1.5
107 ⫾ 19 32 ⫾ 3.0 168 ⫾ 24 252 ⫾ 100 700 ⫾ 67 1.51 ⫾ 0.37 0.79 ⫾ 0.466 28 ⫾ 7.9 18.7 ⫾ 3.3
204 ⫾ 19 33 ⫾ 3.3 274 ⫾ 18 265 ⫾ 98 800 ⫾ 200 2.08 ⫾ 0.28 0.90 ⫾ 0.126 114 ⫾ 11 73 ⫾ 20
0.001 — — — — — — 0.001 0.001
0.001 — 0.05 0.001 — — — 0.001 0.001
0.001 0.01 0.01 — 0.001 0.0015 0.001 0.001 0.001
Values are means ⫾ SD; n ⫽ 6 (low Se) and 5 (high Se). Values are P-values from repeated measures ANOVA controlling for baseline values, BMDP Program 2V. Values at end of the 21-d stabilization period. 1 g Se ⫽ 12.7 nmol. Unpaired t test of within-subject changes. Excludes one subject using a selenium-containing antidandruff shampoo.
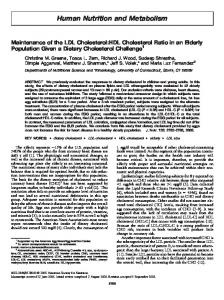
nium took ⬃9 d to decrease noticeably in the low selenium group and ended 34% lower than at baseline. Selenium concentrations in RBC changed more gradually than in plasma, with increases becoming noticeable 17 d after changing the diet and decreases delayed until 65 d after changing the diet (Fig. 2). By the end of the study, RBC selenium had increased by 66% in the high selenium group and decreased by 26% in the low selenium group. Assuming a total blood volume of 6 L, these changes in blood selenium concentrations correspond to an ⬃0.6 mg (7.6 mol) increase in whole-body selenium in the high selenium group and a 0.25 mg (3.2 mol) decrease in the low selenium group. Blood glutathione peroxidase activities were less affected by dietary selenium. Plasma glutathione peroxidase activity decreased by 11% in the low selenium group (Table 4). Glutathione peroxidase activity in platelets responded more to dietary selenium, with a clear separation between groups becoming apparent by 3 wk after the diet change, and ending with an 18% decrease in the low selenium group and a 14% increase in the high selenium group (Table 4).
FIGURE 2 RBC selenium concentration in men consuming the high selenium diet or the low selenium diet. Points represent the group means ⫾ SEM (1 g Se ⫽ 12.7 nmol). *Significantly different from the low selenium group at that time point, P ⬍ 0.05.
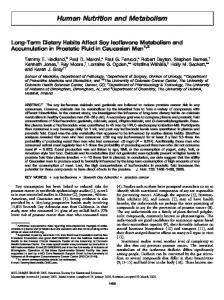
Selenium levels in skeletal muscle were less affected than in blood. The low selenium diet caused a 19% decline in muscle selenium and the high selenium diet increased it by 38% (Table 4). Assuming that skeletal muscle accounted for 39.5% of the subjects’ body mass (38) and was composed of 12% protein (39), these changes in muscle selenium correspond to a gain of ⬃5 mg (63 mol) muscle selenium in the high selenium group and a loss of ⬃3.3 mg (42 mol) muscle selenium in the low selenium group. After a delay of 3–5 wk, hair selenium concentration began to change (Fig. 3). In the high selenium group, hair selenium rose rapidly to a plateau, but in the low selenium group hair selenium continued to decline gradually throughout the study. By the end of the study hair selenium concentration in the high selenium group was about 2.5 times the concentration in the low selenium group (Table 4). One subject in the high selenium group (#5) had unusually elevated hair selenium
FIGURE 3 Hair selenium concentration in men consuming the high selenium diet or the low selenium diet. Points represent the group means ⫾ SEM (1 g Se ⫽ 12.7 nmol). One subject in the high selenium group (subject #5) was discovered to have used selenium-containing shampoo before joining the study, and his data are shown separately (triangles). *Significantly different from the low selenium group at that time point, P ⬍ 0.05.
Downloaded from jn.nutrition.org at USDA, National Agricultural Library on December 28, 2007
1 2 3 4 5 6
Statistical analysis2
High Se diet
SELENIUM METABOLISM AND STATUS
3439
TABLE 5 Selenium balance in men consuming the high selenium diet1 Selenium,2 g/d
Baseline Experimental
Intake
Urine
Feces
Retention
Apparent absorption,3 %
1–3 4–6 7–9 10–12 13–15 16–18 19–21 22–24 25–27 28–30 31–33 34–36 37–39 40–42 70–79 110–119
46 ⫾ 2.7 47 ⫾ 4.5 47 ⫾ 4.5 47 ⫾ 4.5 47 ⫾ 4.5 47 ⫾ 4.5 47 ⫾ 4.5 299 ⫾ 28 299 ⫾ 28 299 ⫾ 28 299 ⫾ 28 299 ⫾ 28 299 ⫾ 28 299 ⫾ 28 297 ⫾ 31 303 ⫾ 26
39 ⫾ 18 41 ⫾ 8.4 32 ⫾ 11 31 ⫾ 11 28 ⫾ 7.2 29 ⫾ 8.5 28 ⫾ 7.9 50 ⫾ 13 55 ⫾ 7.3 80 ⫾ 13 82 ⫾ 17 90 ⫾ 13 61 ⫾ 17 74 ⫾ 35 81 ⫾ 27 94 ⫾ 12
17 ⫾ 22 23 ⫾ 12 16 ⫾ 4.0 23 ⫾ 14 23 ⫾ 9.6 15 ⫾ 5.0 19 ⫾ 3.0 35 ⫾ 13 66 ⫾ 13 69 ⫾ 5.1 64 ⫾ 25 75 ⫾ 31 62 ⫾ 20 —4 70 ⫾ 13 70 ⫾ 9
⫺19 ⫾ 37 ⫺17 ⫾ 16 ⫺0.2 ⫾ 11 ⫺6.3 ⫾ 16 ⫺3.1 ⫾ 17 3.3 ⫾ 10 0.1 ⫾ 14 214 ⫾ 34 178 ⫾ 12 150 ⫾ 24 153 ⫾ 28 135 ⫾ 40 177 ⫾ 44 —4 146 ⫾ 44 138 ⫾ 12
59 ⫾ 52 51 ⫾ 23 66 ⫾ 10 51 ⫾ 32 52 ⫾ 20 70 ⫾ 8 70 ⫾ 7 88 ⫾ 4 78 ⫾ 3 77 ⫾ 2 79 ⫾ 7 75 ⫾ 12 79 ⫾ 7 —4 76 ⫾ 4 77 ⫾ 2
Values are means ⫾ SD, n ⫽ 5. 1 g Se ⫽ 12.7 nmol. Apparent absorption (%) ⫽ [(intake ⫺ fecal excretion)/intake] ⫻ 100. Fecal sample unavailable.
concentration at the start of the study, presumably due to prestudy use of selenium-containing antidandruff shampoo. His hair selenium became indistinguishable from the rest of the high selenium group by d 63. Subject #5’s hair selenium data were excluded from Table 4 and his time course is shown separately in Figure 3. Urinary selenium excretion increased within 3 d of starting the high selenium diet and continued to increase gradually (Table 5). However, decreases were not evident in the low selenium group until 18 d after the diet change and then seemed to reach a plateau by d 70 –79 (Table 6). Increased fecal excretion of selenium was observable within 3 d of the
diet change (Table 5), and decreases were obvious within 6 d (Table 6). Fecal selenium excretion seemed to reach a plateau ⬃9 d after the diet change in the high selenium group, but continued to decrease to about half the baseline level in the low selenium group. Selenium retention (intake minus excretion) reflected the changes in urinary and fecal selenium excretion (Tables 5 and 6). Both groups of subjects started the study with negative selenium retention, but approached metabolic balance by the end of the 21-d baseline period, apparently adapting to the decrease from their estimated prestudy selenium intakes of 48 –242 g/d (608 nmol/d-3.06 mol/d) to the stabilization
TABLE 6 Selenium balance in men consuming the low selenium diet1 Selenium,2 g/d
Baseline Experimental
Pool period, d
Intake
Urine
Feces
Retention
Apparent absorption,3 %
1–3 4–6 7–9 10–12 13–15 16–18 19–21 22–24 25–27 28–30 31–33 34–36 37–39 40–42 70–79 110–119
49 ⫾ 2.2 49 ⫾ 2.5 49 ⫾ 2.5 49 ⫾ 2.5 50 ⫾ 3.5 50 ⫾ 4.2 50 ⫾ 4.2 14 ⫾ 1.4 14 ⫾ 1.8 14 ⫾ 1.8 14 ⫾ 1.8 14 ⫾ 1.8 14 ⫾ 1.8 15 ⫾ 1.8 15 ⫾ 2.0 16 ⫾ 2.3
44 ⫾ 9.0 48 ⫾ 16 32 ⫾ 17 30 ⫾ 8.8 32 ⫾ 9.5 34 ⫾ 8.6 33 ⫾ 9.0 28 ⫾ 9.3 18 ⫾ 7.4 25 ⫾ 4.0 24 ⫾ 8.0 20 ⫾ 3.8 14 ⫾ 7.0 15 ⫾ 5.0 13 ⫾ 1.8 13 ⫾ 1.5
21 ⫾ 5.7 26 ⫾ 6.3 18 ⫾ 5.5 19 ⫾ 2.6 16 ⫾ 3.4 20 ⫾ 2.8 18 ⫾ 4.7 16 ⫾ 2.8 11 ⫾ 3.4 12 ⫾ 1.9 11 ⫾ 1.8 10 ⫾ 3.8 12 ⫾ 2.7 9.4 ⫾ 2.9 8.6 ⫾ 1.6 8.5 ⫾ 1.1
⫺20 ⫾ 9.9 ⫺24 ⫾ 16 ⫺0.5 ⫾ 18 0.3 ⫾ 11 1.4 ⫾ 9.9 ⫺3.1 ⫾ 5.5 ⫺1.1 ⫾ 7.7 ⫺30 ⫾ 9.1 ⫺14 ⫾ 8.4 ⫺23 ⫾ 4.4 ⫺20 ⫾ 8.7 ⫺16 ⫾ 6.1 ⫺11 ⫾ 4.8 ⫺10 ⫾ 6.2 ⫺7.5 ⫾ 2.7 ⫺6.2 ⫾ 2.1
54 ⫾ 12 48 ⫾ 11 65 ⫾ 10 62 ⫾ 6 68 ⫾ 5 61 ⫾ 6 65 ⫾ 9 ⫺14 ⫾ 18 24 ⫾ 22 19 ⫾ 12 25 ⫾ 10 28 ⫾ 21 12 ⫾ 15 39 ⫾ 8 40 ⫾ 13 45 ⫾ 6.5
1 Values are means ⫾ SD, n ⫽ 6. 2 1 g Se ⫽ 12.7 nmol. 3 Apparent absorption (%) ⫽ [(intake ⫺ fecal excretion)/intake] ⫻ 100.
Downloaded from jn.nutrition.org at USDA, National Agricultural Library on December 28, 2007
1 2 3 4
Pool period, d
HAWKES ET AL.
3440
DISCUSSION The absorption and excretion of selenium from beef and rice were generally similar to previous human metabolic studies (20 –22,40,41), but with some important differences related to the forms of selenium fed. The present study differed in that all of the selenium was in foods naturally high or low in selenium provided in a diet composed entirely of conventional foods, and the changes in selenium intake were larger in magnitude and longer in duration. Although both urinary and fecal excretion underwent homeostatic changes, these were insufficient to restore selenium balance in either group within the 99-d intervention period. Because the selenium intake of the low selenium group (14 –16 g/d or 177–203 nmol/d) was below the estimated 17 g/d (215 nmol/d) minimal adult requirement (42) and comparable to intakes in the Keshan disease-endemic areas of China, complete adaptation to the low selenium diet may not have been possible. On the other hand, many populations in high selenium areas have chronic selenium intakes greater than that of the high selenium group without signs of selenosis (42,43), suggesting that successful adaptation to an intake of 300 g/d (3.8 mol/d) can be achieved. Urinary excretion increased rapidly in the high selenium group, but decreased only slowly with selenium restriction. Such slow adaptation to selenium was observed previously in New Zealand, where from 6 to 12 mo are required for blood selenium levels to adjust in persons traveling to or from this low selenium area (44). This adaptation was attributed to slow changes in the renal metabolism of selenium (45,46) and has led to the concept of life-long selenium exposure to explain the differences in selenium metabolism between populations in high and low selenium areas (21,47). Our novel observation that fecal excretion decreased by half in the low selenium group indicates that it may have an underappreciated role in the metabolic adaptation to low selenium intake. The slow adaptation of selenium excretion is consistent with the slow turnover of selenium in muscle. Semilogarithmic plots of muscle selenium concentration increases and decreases vs. time showed an apparent biological half-life of 255 ⫾ 39 d.
This is close to the apparent biological half-life of 233 ⫾ 58 d estimated from the terminal portion of the plasma selenium vs. time curve of the low selenium group. These estimates are also similar to the whole-body half-life of 245–252 d measured for selenium from selenomethionine (48,49). Much of the selenium in foods is present as selenomethionine; thus, it is not surprising that the kinetics of selenium in food are similar. Because about half of the body’s selenium is in skeletal muscle (50), complete adaptation to a large change in selenium intake may take years, supporting the concept of life-long selenium exposure. The whole-body half-life of selenium from sodium selenite is much shorter, with estimates ranging from 105 to 153 d (21,41,51,52), and selenite exchanges with only 20 – 40% of the whole-body selenium (53), making results from metabolic studies using selenite difficult to extrapolate to foods. Metabolic balance was seemingly reached by the end of the 21-d baseline period, suggesting that the newly revised RDA for selenium of 55 g/d (697 nmol/d) (8) is sufficient to maintain typical body stores in North American men. Selenium losses in blood, hair, sweat, breath, nails, exfoliated skin, semen and saliva were not included in the selenium retention figures in Tables 5 and 6, and these omissions inflate cumulative balance estimates (54). The selenium in sampled blood accounted for a loss of ⬃120 g (1.5 mol) in the high selenium group and a loss of 69 g (874 nmol) in the low selenium group. The high selenium group lost ⬃19.5 g (247 nmol) in scalp hair, whereas the low selenium group lost ⬃9.5 g (120 nmol), assuming a typical rate of human hair growth of 0.24 g/d (55). Total integumental losses (scalp hair, body hair, skin and nails) were estimated as 30 g (380 nmol) in the high selenium group and 15 g (190 nmol) in the low selenium group (55). Selenium losses in semen were estimated as 1.9 g (24 nmol) in the high selenium group and 1.4 g (18 nmol) in the low selenium group. The estimated losses of selenium by these unaccounted routes (152 g or 1.9 mol and 85 g or 1.1 mol in the high selenium and low selenium groups, respectively) were too small to affect the trends in selenium retention shown in Tables 5 and 6. Excretion of selenium as dimethyl selenide in rat breath is a significant route only at toxic levels of selenium intake (56,57) and has been observed in humans only in response to acute oral doses of selenium (58). The cumulative retention of selenium between d 22 and 110 in the high selenium group was 15 mg (190 mol), approximately doubling the whole-body selenium (53). Of the selenium retained by the high selenium group, ⬃5 mg (63 mol) appeared to be incorporated into muscle. Selenium in rats was also deposited preferentially in skeletal muscle at high selenium intakes (59), which is consistent with the storage role proposed for skeletal muscle selenium. Studies in human cadavers (60) and rats (61) suggest that some of the retained selenium was also deposited in liver, kidney, testes, brain and adrenal glands. The low selenium group lost only ⬃0.9 mg (11 mol) of whole-body selenium, even though skeletal muscle lost 3.3 mg (42 mol) of selenium, suggesting that selenium was redistributed from muscle to other tissues. The rapid decrease and redistribution of muscle selenium during depletion is further evidence for a storage role. Selenium lost from muscle during depletion was probably deposited in testes or other tissues with a higher metabolic priority for selenium. Selenium is preferentially retained in testes, brain and endocrine organs (62), and testes becomes the largest tissue pool in deficient rats (63). Sperm selenium was unchanged in the low selenium group
Downloaded from jn.nutrition.org at USDA, National Agricultural Library on December 28, 2007
diet intake of 46 –50 g/d (583– 633 nmol/d). After dropping sharply at the diet change, selenium retention in the low selenium group continued to increase throughout the study (r ⫽ 0.61, P ⬍ 0.001), but was still distinctly negative at the end. Selenium retention rose sharply in the high selenium group and then decreased continuously throughout the study (r ⫽ 0.32, P ⬍ 0.03), but never approached metabolic balance. The gradual adaptation toward metabolic balance in both groups indicates ongoing homeostatic responses to both selenium excess and selenium deprivation. The failure of either group to return fully to metabolic balance indicates that these homeostatic adaptations are slow and possibly of limited capacity. Urinary nitrogen excretion decreased in both groups during the stabilization period, from ⬃10 g/d (714 mmol/d) to ⬃6 g/d (426 mmol/d), where it remained for the rest of the study (data not shown). The initial drop reflected the relatively low 10.6% protein content of the experimental diets, which nevertheless contained adequate amounts of all the essential amino acids. Creatinine excretion did not change or differ between groups (data not shown), indicating that the changes in nitrogen excretion were not due to changes in muscle mass. Furthermore, the clinical chemistry profile of blood serum was normal, showing no signs of muscle catabolism, and all values were within normal ranges (data not shown).
SELENIUM METABOLISM AND STATUS
ACKNOWLEDGMENTS The authors gratefully acknowledge the excellent technical assistance of Mark Kutnink and Denise Gretz. We thank the recruiting, metabolic kitchen, nursing and administrative staff of Bionetics Corporation and the Bioanalytical Support Laboratory staff of WHNRC for their assistance with the conduct of this study. We are especially thankful to Yiming Xia of the Chinese Academy of Preventive Medicine for her assistance obtaining high and low selenium rice from China.
LITERATURE CITED 1. Schwarz, K. & Foltz, C. M. (1957) Selenium as an integral part of Factor 3 against dietary necrotic liver degeneration. J. Am. Chem. Soc. 79: 3292–3293. 2. Patterson, E. L., Milstrey, R. & Stokstad, E.L.R. (1957) Effect of selenium in preventing exudative diathesis in chicks. Proc. Soc. Exp. Biol. Med. 95: 617– 620. 3. Rotruck, J. T., Pope, A. L., Ganther, H. E., Swanson, A. B., Hafeman, D. G. & Hoekstra, W. G. (1973) Selenium: biochemical role as a component of glutathione peroxidase. Science (Washington, DC) 179: 588 –590. 4. Forstrom, J. W., Zakowski, J. J. & Tappel, A. L. (1978) Identification of the catalytic site of rat liver glutathione peroxidase as selenocysteine. Biochemistry 17: 2639 –2644. 5. Hawkes, W. C., Wilhelmsen, E. C. & Tappel, A. L. (1985) Abundance and tissue distribution of selenocysteine-containing proteins in the rat. J. Inorg. Biochem. 23: 77–92. 6. Hawkes, W. C., Wilhelmsen, E. C. & Tappel, A. L. (1985) Subcellular distribution of selenium-containing proteins in the rat. J. Inorg. Biochem. 25: 1–17. 7. Behne, D. & Kyriakopoulos, A. (2001) Mammalian selenium-containing proteins. Annu. Rev. Nutr. 21: 453– 473. 8. Food and Nutrition Board, Institute of Medicine (2000) Dietary Reference Intakes for Vitamin C, Vitamin E, Selenium, and Carotenoids. National Academy Press, Washington, DC. 9. Levander, O. A. (1997) Selenium requirements as discussed in the 1996 joint FAO/IAEA/WHO expert consultation on trace elements in human nutrition. Biomed. Environ. Sci. 10: 214 –219. 10. Poirier, K. A. (1994) Summary of the derivation of the reference dose for selenium. In: Risk Assessment of Essential Elements (Mertz, W., Abernathy, C. O. & Olin, S. S., eds.). ILSI Press, Washington, DC. 11. Christensen, M. J., Janghorbani, M., Steinke, F. H., Istfan, N. & Young, V. R. (1983) Simultaneous determination of absorption of selenium from poultry meat and selenite in young men: application of a triple stable-isotope method. Br. J. Nutr. 50: 43–50. 12. Finley, J. W. & Davis, C. D. (2001) Selenium (Se) from high-selenium broccoli is utilized differently than selenite, selenate and selenomethionine, but is more effective in inhibiting colon carcinogenesis. Biofactors 14: 191–196. 13. Whanger, P. D., Ip, C., Polan, C. E., Uden, P. C. & Welbaum, G. (2000) Tumorigenesis, metabolism, speciation, bioavailability, and tissue deposition of selenium in selenium-enriched ramps (Allium tricoccum). J. Agric. Food Chem. 48: 5723–5730. 14. Meltzer, H. M., Norheim, G., Bibow, K., Myhre, K. & Holm, H. (1990) The form of selenium determines the response to supplementation in a selenium replete population. Eur. J. Clin. Nutr. 44: 435– 446. 15. Johansson, E. & Westermarck, T. (1993) Studies of selenium supplementation with inorganic and combined inorganic-organic Se in humans. J. Trace Elem. Electrolytes Health Dis. 7: 113–114. 16. Whanger, P., Xia, V. & Thomson, C. (1993) Metabolism of different forms of selenium in humans. J. Trace Elem. Electrolytes Health Dis. 7: 121. 17. Thomson, C. D., Robinson, M. F., Butler, J. A. & Whanger, P. D. (1993) Long-term supplementation with selenate and selenomethionine-selenium and glutathione peroxidase (EC 1.11.1.9) in blood components of New-Zealand women. Br. J. Nutr. 69: 577–588. 18. Wolf, W. R. & Zainal, H. (2002) Methylseleno-amino acid content of food materials by stable isotope dilution mass spectrometry. Food Nutr. Bull. 23: 120 –123. 19. Combs, G. F., Jr. & Combs, S. B. (1986) The Role of Selenium in Nutrition. Academic Press, San Diego, California. 20. van der Torre, H. W., Van Dokkum, W., Schaafsma, G., Wedel, M. & Ockhuizen, T. (1991) Effect of various levels of selenium in wheat and meat on blood selenium status indices and on selenium balance in Dutch men. Br. J. Nutr. 65: 69 – 80. 21. Kasper, L. J., Young, V. R. & Janghorbani, M. (1984) Short-term dietary selenium restriction in young adults: quantitative studies with the stable . Br. J. Nutr. 52: 443– 455. isotope 74SeO(2⫺) 3 22. Levander, O. A., Sutherland, B., Morris, V. C. & King, J. C. (1981) Selenium balance in young men during selenium depletion and repletion. Am. J. Clin. Nutr. 34: 2662–2669. 23. Metropolitan Life Insurance Company (1980) New height and weight tables. 1979 Build Study. Society of Actuaries and Association of Life Insurance Medical Directors of America, Chicago, IL. 24. Association of Official Analytical Chemists (1990) Official Methods of Analysis, 15th ed. AOAC, Arlington, VA. 25. Joint Mercury Residues Panel (1961) The determination of mercury residues in apples and tomatoes [report]. Analyst 86: 608. 26. Hatch, W. & Ott, W. (1968) Determination of sub-microgram quantities of mercury by atomic absorption spectrometry. Anal. Chem. 40: 2085–2087. 27. Dahlquist, R. L. & Knoll, J. W. (1978) Inductively coupled plasmaatomic emission spectrometry: analysis of biological materials and soils for major trace, and ultra-trace elements. Appl. Spectrosc. 32: 1–30. 28. Analytical Methods Committee (1960) Methods of destruction of organic matter. Analyst 85: 643– 656. 29. Perkin Elmer (1981) Analytical Methods using the MHS Mercury/ Hydride System. Perkin Elmer Corporation, Norwalk, CT. 30. Harris, J. A. & Benedict, F. G. (1919) Biometric Studies of Basal
Downloaded from jn.nutrition.org at USDA, National Agricultural Library on December 28, 2007
(64), indicating that testes selenium stores were preserved during depletion. At metabolic balance, apparent absorption was 65–70%, similar to that reported for men in California (22) and North Dakota (40), and was consistently greater from the high selenium diet as previously observed (40). Urinary excretion of selenium stabilized about 18 d after beginning the low selenium diet, slightly longer than reported by Levander et al. (22), but consistent with our lower dietary intake of 14 –16 g/d (177–203 nmol/d) vs. 34 g/d (431 nmol/d). Urinary excretion of selenium took ⬃12 d to stabilize in the high selenium group, about the same time reported for adaptation to repletion with 200 g/d (2.5 mol/d) fed in a formula diet (22). The dietary intakes of calcium and magnesium were below recommended levels, and subjects may have been in negative balance. However, lower intakes of these minerals may be adequate for many individuals (65), and it is unlikely that low intake of calcium or magnesium affected the absorption, distribution or excretion of selenium in this study. Nutritional interactions between calcium and selenium have not been reported, and a metabolic unit study in adolescent girls found no effects of calcium supplementation on selenium absorption, retention or status (66). The subjects and the diets were not subject to known stressors of calcium nutriture such as extreme exercise or high fiber intakes, and serum calcium and alkaline phosphatase activity remained in the normal range, suggesting that calcium metabolism was normal. Nutritional interactions between selenium and magnesium have similarly not been reported, and we found one study of magnesium deficiency in rats that reported no effect on selenium (67). The dietary ratio of phosphorus to calcium was higher than normal, but serum phosphorus remained in the normal range. To compare the various selenium parameters for their potential as status indicators, we calculated the t statistics for a comparison of the final parameter values between groups as a measure of selenium response size relative to interindividual variation. Daily urinary selenium excretion was the most discriminating indicator of selenium intake by this criterion (t ⫽ 20), but RBC selenium (t ⫽ 18) and plasma selenium (t ⫽ 13.4) were also quite sensitive, with the practical advantage of requiring only spot blood collections vs. 24-h urine collections. Daily fecal selenium excretion (t ⫽ 7.9) was the next most sensitive indicator of selenium intake, followed by muscle selenium (t ⫽ 2.5), platelet glutathione peroxidase and hair selenium (t ⫽ 1.8), RBC glutathione peroxidase (t ⫽ 1.5) and plasma glutathione peroxidase (t ⫽ 0.8). The relative responses of these parameters were similar to the responses of selenium status indicators in long-tailed macaques exposed to high levels of L-selenomethionine (68). Plasma selenium initially responds rapidly to changes in selenium intake and subsequently changes at a similar rate to whole-body selenium; it is a simple specimen to collect and analyze, and the response to selenium intake is large compared with the interindividual variation, making it well-suited for assessment of human selenium status.
3441
3442
HAWKES ET AL. 51. Stewart, R. D. H., Griffiths, N. M., Thomson, C. D. & Robinson, M. F. (1978) Quantitative selenium metabolism in normal New Zealand women. Br. J. Nutr. 40: 45–54. 52. Patterson, B. H., Levander, O. A., Helzlsouer, K., Mcadam, P. A., Lewis, S. A., Taylo, R. P. R., Veillon, C. & Zech, L. A. (1989) Human selenite metabolism: a kinetic model. Am. J. Physiol. 257: R556 –R567. 53. Schroeder, H. A., Frost, D. V. & Balassa, J. J. (1970) Essential trace metals in man: selenium. J. Chronic Dis. 23: 227–243. 54. Kopple, J. D. (1987) Uses and limitations of the balance technique. J. Parenter. Enteral Nutr. 11: 79S– 85S. 55. Calloway, D. H., Odell, A. C. & Margen, S. (1971) Sweat and miscellaneous nitrogen losses in human balance studies. J. Nutr. 101: 775–786. 56. Barceloux, D. G. (1999) Selenium. J. Toxicol. Clin. Toxicol. 37: 145– 172. 57. Vadhanavikit, S., Ip, C. & Ganther, H. E. (1993) Metabolites of sodium selenite and methylated selenium compounds administered at cancer chemoprevention levels in the rat. Xenobiotica 23: 731–745. 58. Cai, X. J., Block, E., Uden, P. C., Quimby, B. D. & Sullivan, J. J. (1995) Allium chemistry: identification of natural abundance organoselenium compounds in human breath after ingestion of garlic using gas chromatography with atomic emission detection. J. Agric. Food Chem. 43: 1751–1753. 59. Kirchgessner, M., Gabler, S. & Windisch, W. (1997) Homeostatic adjustments of selenium metabolism and tissue selenium to widely varying selenium supply in Se-75 labeled rats. J. Anim. Physiol. Anim. Nutr. 78: 20 –30. 60. Aalbers, T. G., Houtman, J.P.W. & Makkink, B. (1987) Trace-element concentrations in human autopsy tissue. Clin. Chem. 33: 2057–2064. 61. L’Abbe´ , M. R., Fischer, P.W.F., Trick, K. D. & Chavez, E. R. (1989) Effect of dietary selenium and tumor status on the retention of selenium-75 by tissues and mammary tumors of DMBA treated rats. Biol. Trace Elem. Res. 20: 179 –196. 62. Behne, D., Hilmert, H., Scheid, S., Gessner, H. & Elger, W. (1988) Evidence for specific selenium target tissues and new biologically important selenoproteins. Biochim. Biophys. Acta 966: 12–21. 63. Finley, J. W. & Kincaid, R. L. (1991) Selenium and glutathione peroxidase tissue distribution in rats effect of dietary intake and total body burden of selenium. Nutr. Res. 11: 91–104. 64. Hawkes, W. C. & Turek, P. J. (2001) Effects of dietary selenium on sperm motility in healthy men. J. Androl. 22: 764 –772. 65. Food and Nutrition Board, Institute of Medicine (1999) Dietary Reference Intakes for Calcium, Phosphorus, Magnesium, Vitamin D, and Fluoride. National Academy Press, Washington, DC. 66. Holben, D. H., Smith, A. M., Ilich, J. Z., Landoll, J. D., Holcomb, J. P. & Matkovic, V. (2002) Selenium intakes, absorption, retention, and status in adolescent girls. J. Am. Diet. Assoc. 102: 1082–1087. 67. Planells, E., Sanchez-Morito, N., Montellano, M. A., Aranda, P. & Llopis, J. (2000) Effect of magnesium deficiency on enterocyte Ca, Fe, Cu, Zn, Mn and Se content. J. Physiol. Biochem. 56: 217–222. 68. Hawkes, W. C., Willhite, C. C., Craig, K. A., Omaye, S. T., Cox, D. N., Choy, W. N. & Hendrickx, A.G. (1992) Effects of excess selenomethionine on selenium status indicators in pregnant long-tailed macaques macaca-fascicularis. Biol. Trace Elem. Res. 35: 281–297. 69. U. S. Department of Agriculture (1991) Composition of foods (Handbook 8). Government Printing Office, Washington, DC. 70. Association of Official Analytical Chemists (1995) Official methods of analysis, 16th ed. AOAC, Arlington, VA. 71. Food and Nutrition Board, Institute of Medicine (2001) Dietary Reference Intakes for Vitamin A, Vitamin K, Arsenic, Boron, Chromium, Copper, Iodine, Iron, Manganese, Molybdenum, Nickel, Silicon, Vanadium, and Zinc. National Academy Press, Washington, DC. 72. National Research Council (NRC) Committee on Dietary Allowances (1980) Recommended Dietary Allowances. National Academy Press, Washington, DC.
Downloaded from jn.nutrition.org at USDA, National Agricultural Library on December 28, 2007
Metabolism in Man. Publication no. 297. Carnegie Institute of Washington, Washington, DC. 31. Hawkes, W. C. & Kutnink, M. A. (1996) High-performance liquid chromatographic-fluorescence determination of traces of selenium in biological materials. Anal. Biochem. 241: 206 –211. 32. Hawkes, W. C. & Craig, K. A. (1990) Automated continuous-flow colorimetric determination of glutathione peroxidase with dichloroindophenol. Anal. Biochem. 186: 46 –52. 33. Hawkes, W. C. & Craig, K. A. (1990) Adaptation of the bicinchoninic acid protein assay to a continuous-flow autoanalyzer. Lab. Robot. Autom. 3: 13–17. 34. Dumas, A. (1962) Stickstoffbestimmung nach Dumas. Prax. Org. Chem. 41: 45–51. 35. Larsen, K. (1972) Creatinine assay by a reaction-kinetic principle. Clin. Chim. Acta 41: 209 –217. 36. Smith, P. K., Krohn, R. I., Hermanson, G. T., Mallia, A. K., Gartner, F. H., Provenzano, M. D., Fujimoto, E. K., Goeke, N. M., Olson, B. J. & Klenk, D. C. (1985) Measurement of protein using bicinchoninic-acid. Anal. Biochem. 150: 76 – 85. 37. Clark, L. C., Combs, G. F., Jr., Turnbull, B. W., Slate, E. H., Chalker, D. K., Chow, J., Davis, L. S., Glover, R. A., Graham, G. F., Gross, E. G., Krongrad, A., Lesher, J. L., Jr., Park, H. K., Sanders, B. B., Jr., Smith, C. L. & Taylor, J. R. (1996) Effects of selenium supplementation for cancer prevention in patients with carcinoma of the skin. A randomized controlled trial. J. Am. Med. Assoc. 276: 1957–1963. 38. Janssen, I., Heymsfield, S. B., Wang, Z. M. & Ross, R. (2000) Skeletal muscle mass and distribution in 468 men and women aged 18 – 88 yr. J. Appl. Physiol. 89: 81– 88. 39. Forsberg, A. M., Nilsson, E., Werneman, J., Bergstrom, J. & Hultman, E. (1991) Muscle composition in relation to age and sex. Clin. Sci. (Lond.) 81: 249 –256. 40. Finley, J. W. (1999) The retention and distribution by healthy young men of stable isotopes of selenium consumed as selenite, selenate or hydroponically grown broccoli are dependent on the isotopic form. J. Nutr. 129: 865– 871. 41. Martin, R. F., Janghorbani, M. & Young, V. R. (1989) Experimental selenium restriction in healthy adult humans changes in selenium metabolism studied with stable-isotope methodology. Am. J. Clin. Nutr. 49: 854 – 861. 42. Yang, G., Gu, L., Zhou, R. & Yin, S. (1988) Studies of human maximal and minimal safe intake and requirement of selenium. In: Selenium in Biology and Medicine (Wendel, A., ed.). Springer-Verlag, Berlin, Germany. 43. Longnecker, M. P., Taylor, P. R., Levander, O. A., Howe, S. M., Veillon, C., Mcadam, P. A., Patterson, K. Y., Holden, J. M., Stampfer, M. J. & Morris, J. S. (1991) Selenium in diet, blood and toenails in relation to human health in a seleniferous area. Am. J. Clin. Nutr. 53: 1288 –1294. 44. Robinson, M. F. & Thomson, C. D. (1981) Selenium levels in humans vs. environmental sources. In: Selenium in Biology and Medicine (Spallholz, J. E., Martin, J. L. & Ganther, H. E., eds.). Avi, Westport, CT. 45. Christensen, M. J., Gulbransen, D. S., Stephenson, W. T. & Lei, L. I. (1987) Changes in renal plasma clearance of selenium in arrivals from Finland and New Zealand. Fed. Proc. 46: 908. 46. Robinson, M. F., Thomson, C. D., Jenkinson, C. P., Luzhen, G. & Whanger, P. D. (1997) Long-term supplementation with selenate and selenomethionine: urinary excretion by New Zealand women. Br. J. Nutr. 77: 551– 563. 47. Janghorbani, M., Xia, Y., Ha, P., Whanger, P. D., Butler, J. A., Olesik, J. W. & Daniels, L. (1999) Metabolism of selenite in men with widely varying selenium status. J. Am. Coll. Nutr. 18: 462– 469. 48. Griffiths, N. M., Stewart, R. D. H. & Robinson, M. F. (1976) The metabolism of [75Se]selenomethionine in four women. Br. J. Nutr. 35: 373–382. 49. Swanson, C. A., Patterson, B. H., Levander, O. A., Veillon, C., Taylor, P. R., Helzls, O. K., Mcadam, P. A. & Zeck, L. A. (1991) Human selenium-74 selenomethionine metabolism: a kinetic model. Am. J. Clin. Nutr. 54: 917–926. 50. Oster, O., Schmiedel, G. & Prellwitz, W. (1988) The organ distribution of selenium in German adults. Biol. Trace Elem. Res. 15: 23– 45.