IEEE SENSORS JOURNAL, VOL. 10, NO. 9, SEPTEMBER 2010
1519
Hybrid Multiresolution Method for Multisensor Multimodal Image Fusion Shutao Li, Member, IEEE, and Bin Yang
Abstract—The aim of image fusion is to integrate complementary information from several images to create a highly informative image which is more suitable for human visual perception or computer-processing tasks. Recent studies show that stationary wavelet transform (SWT) and nonsubsampled contourlet transform (NSCT) both turn out to be effective and efficient for image fusion. In order to take some complementary characteristics between the two multiresolution transformations simultaneously, we propose a hybrid multiresolution method by combining the SWT with the NSCT to perform image fusion. Two methods, serial NSCT aiding SWT (SNAS) and serial SWT aiding NSCT (SSAN), are studied and compared with some state-of-the-art methods. Experimental results demonstrate that the SSAN method performs better than SNAS and the individual multiresolution-based methods, such as NSCT, SWT, complex wavelet (CWT), curvelet (CVT) and wavelet-based contourlet (WBCT). Index Terms—Image fusion, multisensor fusion, nonsubsampled contourlet transform (NSCT), stationary wavelet transform (SWT), hybrid multiresolution.
I. INTRODUCTION N recent years, image fusion has become an important and useful technique for image analysis and computer vision. It is being studied and applied to integrate information from several images which may come from one sensor or multiple sensors. The fused image is more suitable for human perception or further image processing tasks [1], [2]. The fusion process can be performed at different levels of information representation, namely, pixel level, feature level and decision level [3]. Pixel level image fusion generates a fused image in which each pixel is determined by a set of pixels in various sources. The advantage of pixel level fusion is that the fused image contains more original information. In addition, compared to feature or decision level fusion, the pixel level fusion is easy to implement and more time efficient [4]. A simple image fusion method is to take the average of the source images pixel by pixel. Although this method is simple to implement, it brings about several undesired side effects including reduced contrast [4]. Multiscale transforms have been successfully used to image fusion in recent years. There is evidence that the human visual system performs similar signal decomposition in its early processing [5]. Commonly used
I
Manuscript received October 30, 2009; revised January 20, 2010; accepted January 20, 2010. Date of publication June 07, 2010; date of current versionJuly 21, 2010. The associate editor coordinating the review of this paper and approving it for publication was Prof. Kiseon Kim. The authors are with the College of Electrical and Information Engineering, Hunan University, Changsha 410082, China (e-mail:
[email protected];
[email protected]) Digital Object Identifier 10.1109/JSEN.2010.2041924
multiresolution transformations include the Laplacian pyramid [6], ratio-of-low-pass pyramid [7], independent component analysis [8], and discrete wavelet transform (DWT) [9]–[13]. The multiscale decomposition-based image fusion approaches have been studied within a generic image fusion framework in [4]. The basic idea is to perform certain multiresolution decomposition on each source image, and then integrate all these decompositions to obtain one combined representation according to a fusion rule. Finally, applying the inverse transformation to the combined representation, the fused image can be constructed. The key step in multiscale decomposition-based image fusion is how to represent the details in the source images with decomposed coefficients. However, due to the down-sampling process, many multiresolution decompositions are not translation-invariant. Hence, in practice, their performances quickly deteriorate when there is a slight object movement or the source images cannot be perfectly registered. One way to alleviate this problem is to use translation-invariant multiresolution transformations, such as stationary wavelet transform (SWT) [14], [15]. The SWT closely resembles the DWT, but uses an overcomplete wavelet decomposition by avoiding DWT’s down-sampling process. However, recent papers argued that wavelets and related classical multiresolution transforms are playing with a limited dictionary made up of roughly isotropic elements occurring at all scales and locations. To solve this problem, some new multiscale transformations like curvelets [16], ridgelets [17], and contourlets [18] are introduced. The main motivation of these new multiscale transformations is to pursue a “true” two-dimensional transform that can capture the intrinsic geometric structure. The ridgelet transform is applied to image fusion in [19]. The experimental results demonstrate that this algorithm outperforms classical fusion methods both in visual and objective evaluation. In [20], curvelet transform is used to fuse remote sensing images. The experimental results show that the method simultaneously provides richer information in spatial and spectral domains. One contourlet-based image fusion method is proposed in [21], which is better in preserving edge and texture information than wavelet transform or Laplacian pyramid-based methods. Other contourlet transform-based multispectral and panchromatic satellite image fusion method is proposed in [22]. Like the wavelet, due to the existence of downsamplers and upsamplers in both the Laplacian pyramid and the directional filter banks (DFB), the contourlet transform is either not shiftinvariant. In [23], Cunha and Zhou proposed the nonsubsampled contourlet transform (NSCT). The NSCT is a fully shift-invariant, multiscale, and multidirection transformation that has a fast implementation. Yang et al. used the NSCT for image fusion and got good performance in [24].
1530-437X/$26.00 © 2010 IEEE
1520
In fact, each multiresolution transform has its own advantages and disadvantages. For example, the wavelet does not represent long edges well, while it is challenging for the contourlet to express image details, and these complementarities may have great potential. Therefore, there is room for improving image processing performance by using hybrid multiresolution transformations [25]–[30]. In [25], a denoising algorithm is proposed which investigates those complementarities, by combining several multiscale transforms in order to achieve very high quality image restoration. It is shown that the combined reconstruction exhibits clear advantages over any one individual system. In [26], a new deconvolution approach, which combines the wavelet transform and the curvelet transform together is presented. Eslami et al. proposes a new family of perfect reconstruction, nonredundant, and multiresolution geometric image transforms using the wavelet transform in conjunction with modified versions of DFB [27]. The proposed hybrid wavelet and DFB transform family provides visual and peak signal-to-noise ratio improvements over the wavelet and contourlet transforms. The paper [28] presents a new image coding technique based on a mixed contourlet and wavelet transform. The redundancy of the transform is controlled by using the contourlet at fine scales and switching to a separable wavelet transform at coarse scales. The transform is then optimized through an iterative projection process in order to minimize the quantization error in the image domain. It outstrips contourlet and wavelet-based coding, respectively. A texture classification problem is investigated with individual and combined multiresolution features, i.e., the dyadic wavelet, wavelet frame, Gabor wavelet, and steerable pyramid in [30]. Naturally, combining some complementary multiresolution methods to improve image fusion performance may be considered. In this paper, a hybrid multiresolution image fusion method using NSCT and SWT is proposed. Here, two proposed methods, the serial NSCT aiding SWT (SNAS) and the serial SWT aiding NSCT (SSAN), are investigated in this paper. The serial methods firstly decompose the source images into the high-frequency coefficients and the low-frequency coefficients using one transform. Then, the high-frequency coefficients are combined by selecting coefficients with largest energy, and lowfrequency coefficients are combined using the other transformbased image fusion method. The remaining sections of this paper are organized as follows. Section II briefly introduces the SWT, NSCT, and generic image fusion method based on multiresolution analysis. Section III provides the proposed fusion scheme. Section IV presents experimental results, and Section V summarizes this paper. II. SWT, NSCT, AND GENERIC IMAGE FUSION METHOD The SWT [14], [15] is similar to the DWT, except that coefficient sequences are not decimated at each stage. It is a redundant scheme, as each set of coefficients contains the same number of samples as the input. The SWT provides the approximate shift invariance which the traditional wavelet transform is short of. As the DWT, the SWT can well represent the small features, such as angles and textures [25]. However, the SWT suffers from the drawbacks of limited directional information, and the lack of correlation of significant wavelet coefficients
IEEE SENSORS JOURNAL, VOL. 10, NO. 9, SEPTEMBER 2010
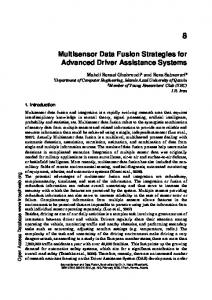
Fig. 1. Wavelet and contourlet schemes in successive refinement near a smooth contour. (a) Wavelet. (b) Contourlet.
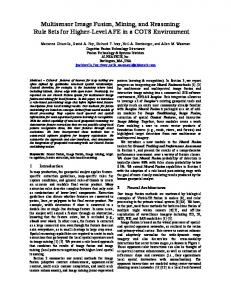
along the discontinuity curve. As a result, poor representations of edges are produced, particularly when images have contours and curves. The NSCT is a flexible multiscale, multidirectional, and shift-invariant image decomposition scheme which is built upon nonsubsampled multiscale pyramids and nonsubsampled directional filter banks [23]. It can extract the geometric information of images very well, which is useful to many image processing tasks. Contourlet represents the long edges very well while challenged by small features [27]–[29]. Consider the situation when a smooth contour is being painted, as shown in Fig. 1. It illustrates the successive refinement by the two systems near a smooth contour. Since 2-D DWT is constructed from tensor products of 1-D DWT, the “wavelet”- style painter is limited to using square-shaped brush strokes along the contour, different sizes corresponding to the multiresolution structure of wavelets. As the resolution becomes finer, we can clearly see the limitation of the wavelet-style painter who needs to use many fine “dots” to capture the contour. The contourlet, on the other hand, exploits effectively the smoothness of the contour by making brush strokes with different elongated shapes and in a variety of directions following the contour. However, the contourlet cannot represent small features such as angles as efficiently as the wavelet transform does. Considering an image “Lenna” with size 512 512, we do NSCT and SWT decomposition and reconstruction to compare their performances. For the NSCT, the contourlet transform is implemented into two levels, and each level contains eight orientations. For the SWT, the wavelet basis “Daubechies 6” and a decomposition level of 2 are used. The sum square of each high-frequency coefficient for each pixel location is calculated. We select all the low-frequency coefficients and those high-frequency coefficients with the top 2% largest sum squares to do reconstruction. The zoomed left eye regions of two reconstructed images by NSCT and SWT are shown in Fig. 2. A careful inspection reveals that the fringe of the hat in Fig. 2(b) is smoother and clearer than it is in Fig. 2(a), but in Fig. 2(a), Lenna’s eye is clearer than it is in Fig. 2(b). This example verifies that the NSCT and SWT have complementary characteristics. The multiresolution transforms, such as DWT, SWT, NSCT, complex wavelet transform (CWT), and curvelet (CVT) are appropriate for performing image fusion tasks. The generic image fusion schematic diagram is shown as Fig. 3. T represents the indicates the inverse translinear invertible transform while form. We assume that the source images have been registered. The fusion procedure takes the following steps. Firstly, Each of
LI AND YANG: HYBRID MULTIRESOLUTION METHOD FOR MULTISENSOR MULTIMODAL IMAGE FUSION
Fig. 2. Comparison between the NSCT and SWT reconstructed results. (a) SWT-based method. (b) NSCT-based method.
1521
SWT-based fusion method. The SSAN method is described in detail as follows: , is decomposed by 1) Each of the source images, the NSCT into low-frequency coefficients, , and . high-frequency coefficients, 2) For every source image, the activity level of each NSCT , is calculated by the following two coefficients, equations [4]:
(1) (2) where is the number of decomposition scales, and the total number of frequency orientations, and
is
Fig. 3. Basic structure of generic image fusion method.
(3)
Fig. 4. Schematic diagram of SSAN.
the registered input images is decomposed with certain multiresolution analysis method. The corresponding coeffiare obtained. Then, the coefficients are intecients grated according to certain fusion rule. Optionally, consistency verification is performed to ensure that a fused coefficient does not come from a different source image from most of its neighbors. Finally, the fused image is reconstructed by performing the corresponding inverse transform. III. THE HYBRID IMAGE FUSION METHOD In this section, we design two different hybrid methods. These methods consider the SWT coefficients and NSCT coefficients simultaneously in the process of image fusion. We know that although different multiresolution analysis methods similarly decompose the input images into low-frequency and high-frequency subbands, the low-frequency coefficients or high-frequency coefficients among different decompositions have different characteristics. Thus, fusing the low-frequency and high-frequency coefficients using different suitable multiresolution methods can improve the performance of image fusion. Based on this idea, we design two multiresolution-based fusion methods: the serial SWT aiding NSCT (SSAN) and the serial NSCT aiding SWT (SNAS). Fig. 4 shows the schematic diagram of the serial method SSAN. The source images are decomposed using the NSCT, and the high-frequency coefficients are combined by selecting those with larger activity values, while the low-frequency coefficients are fused using the
is applied to make the algoThe convolution kernel rithm robust to variant adverse effects, such as misregistration and impulse noise, by collaboration from neighboring approximates a Gauss filter with cutoff pixels. Here, frequency 0.3027. In fact, other possible filters with similar characteristics can also be used. , are combined 3) The high-frequency coefficients, by selecting the coefficients with larger energy as follows:
(4) , the activity level, , of the high-frequency coefficients , is computed using (1) and (2). , are fused by 4) The low-frequency coefficients, using the generic multiresolution image fusion method described in Section II, where SWT is used. For SWT, the wavelet basis is “Daubechies 6,” and the decomposition level is two. The activity level of each coefficient is calculated by weighted averaging over a 5 5 window at each coefficient location. The choosing maximum activity level technique is used to combine the SWT coefficients. The . fused coefficients are indicated as 5) The inverse NSCT (INSCT is applied to the fused coefficients to get the fused image. The serial SNAS method is similar to the SSAN method. The source images are first decomposed by the SWT. The high-fre, are fused by selecting the coeffiquency coefficients, cients with larger energy at each pixel location, and the low-fre, are fused by using the NSCTquency coefficients, based fusion method, as described in Section III. Finally, the inverse SWT is applied to the fused coefficients to get the fused image. where
1522
IEEE SENSORS JOURNAL, VOL. 10, NO. 9, SEPTEMBER 2010
2
Fig. 6. Zoomed image regions with size of 80 80 from Fig. 5(c)–(f): (a) From Fig. 5(c); (b) From Fig. 5(d); (c) From Fig. 5(e); (d) From Fig. 5(f).
2
Fig. 5. Multifocus source images (256 level, 512 512) and fusion results: (a) focus on the right clock; (b) focus on the left clock; and (c)–(f) are the fusion results of NSCT, SWT, SNAS, and SSAN methods.
IV. EXPERIMENTS A. Experimental Setups The experiment is done by a personal computer with 2.17 GHz AMD Sempron CPU, 512 MB RAM, under MATLAB 6.5. We use three scales of decomposition for NSCT, and two scales of high-frequency coefficients are obtained. For the coarser scale, there are two directions, and for the finer, there are eight directions. Thus, for each source image, 11 subimages with the same size as the source image are generated. For SWT, the wavelet basis is “Daubechies 6,” which behaves well in the preservation of original information, and the decomposition level is two, which results in seven subimages for each source image. In this work, we use both subjective and objective evaluations to test the fused results. The subjective method judges the quality of the image visually. Three objective image quality [31], and index, root mean squared error (RMSE), the [36] metrics are also used. The RMSE between the ground truth fused image and the fused image is calculated to evaluate the image fusion performance. The lower the value of RMSE is, metric was prothe better the fused image is [4]. The posed by Xydeas and Petrovic, which considers the amount of edge information transferred from the input images to the fused image [31], [32]. Sobel edge detector is used to calculate the strength and orientation information of the edge at each pixel in both source and the fused images. It should be close to 1 as is promuch as possible. The fusion performance metric value, posed by Piella and Heijmans in [36]. The larger the the better the fused result is. B. Experimental Results Fig. 5(a) and (b) show a pair of tested images, each of which contains two clocks with different distances to the camera. The focus in Fig. 5(a) is on the right clock, while the focus in Fig. 5(b) is on the left one. Fig. 5(c) and (d) illustrate the fused images using the NSCT-based and SWT-based image
fusion approach respectively. It can be observed that the edges in Fig. 5(c) are clearer than those in Fig. 5(d). Fig. 5(e) and (f) are the fused results of the proposed SNAS and SSAN, respectively. It is difficult to conclude which resultant image is the best from visual observation since only a slight difference can be found among them. Therefore, for further comparison, we magnify one selected region, as shown in Fig. 6, from the resulted images in Fig. 5. Comparing Fig. 6(a) and (b), we can see that the result of the NSCT method retains more edge information than the result of the SWT method. The results of the hybrid methods SNAS and SSAN shown in Fig. 6(c) and (d) are both better than the results of the SWT or the NSCT methods. The edges in Fig. 6(c) and (d) are clearer than those in Fig. 6(a) and (b), and the angle point of the two edges with different orientation in Fig. 6(c) and (d) is also clearer. Further, comparing Fig. 6(c) and (d), we can see that Fig. 6(d) is more acceptable which has fewer artifacts contained. This may be due to that the SSAN considers both the NSCT and the SWT simultaneously. Notice that the SNAS method also considers both the NSCT and the SWT, but the result is not as good as that of SSAN method. As mentioned above, the low-frequency coefficients or high-frequency coefficients among different decompositions have different characteristics, and the edge information which is very important for visual perception mainly contains in the high-frequency coefficients. As the NSCT represents the long edges very well, the SSAN by which the high-frequency information is fused by using the NSCT coefficients is more appropriate than the SNAS. In addition, the low-frequency coefficients are further decomposed and fused by the SWT. Thus, more underlying information is transferred into the fused image making it well improved. Experimental results using different sensor images are shown in Figs. 7 and 8. Fig. 7(a) shows a computerized tomography (CT) image and Fig. 7(b) illustrates a magnetic resonance image (MRI) of the same person. The experimental setups are the same as previously mentioned. The fused images are shown in Fig. 7(c)–(h). From Fig. 7, we can observe that Fig. 7(h) and (g) preserve more useful information compared with others, and the distinct extent of the fusion image is improved. Another experiment is performed on visible and infrared images shown in Fig. 8. Fig. 8(a) is a visual image which clearly shows grass. Fig. 8(b) is a thermal infrared image in which the target (the gun) is clearly visible. A careful inspection of the fusion results reveals that Fig. 8(h) contains more details. In addition, in order to make the comparison as fair as possible, some multifocus images obtained by camera shown in Fig. 9 and ten standard images as ground truth shown in Fig. 10
LI AND YANG: HYBRID MULTIRESOLUTION METHOD FOR MULTISENSOR MULTIMODAL IMAGE FUSION
1523
2
Fig. 7. Medical source images (256 level, 256 256) and fusion results: (a) CT image; (b) MRI; and (c)–(f) are the fusion results of NSCT, SWT, SNAS, and SSAN methods.
Fig. 9. Three pairs of multifocus source images: (a) focus on the clock (256 level, 480 640); (b) focus on the bookshelf (256 level, 480 640); (c) focus on the left clock (256 level, 480 640); (d) focus on the student (256 level, 480 640); (e) focus on the left (256 level, 512 512); and (f) focus on the right (256 level, 512 512).
2
2
2
2
2
2
2
Fig. 8. Visible and infrared source images (256 level, 160 224) and fusion results: (a) visible image; (b) infrared image; and (c)–(f) are the fusion results of NSCT, SWT, SNAS, and SSAN methods.
are used in following experiments. From each image in Fig. 10, two out-of-focus images are created by Gaussian blurring. Then, the blurred images with different focus points are taken as the source images. The original image is taken as the reference and of the different proposed image. The values of image fusion methods on the images are shown in Table I, where the values in bold indicate the highest accuracy obtained over all the methods tested. We can see from Table I that the SSAN value. For provides the fused image with the largest , the SSAN method performs better than other methods for the natural source images. However, for the artificial images in values of various fusion methods are almost Fig. 10, the is not as sensitive as unchanged. This may be due to that for the artificial images. The values of RMSE of the fusion results on those artificial blurred images generated from Fig. 10 are listed in Table II. Table II shows that the SSAN has the best performance in all of the investigated methods. Both objective and subjective analysis of the experimental results show that the SSAN has the highest quality performance. In the following section, the SSAN method is further studied and compared with some state-of-the-art algorithms. Here, the complex wavelet (CWT) [33], curvelet-based fusion methods
Fig. 10. The ten ground truth images (256 level, 256
2 256).
(CVT) [34], and wavelet-based contourlet transform (WBCT) [35] are used for comparison. For the complex wavelet-based method, the decomposed scale is 2 [33]. The subband consistency and majority consistency are used. For the curvelet-based method, the decomposed level 2 is used [34]. The fusion method based on WBCT is also a hybrid multiresolution-based method in some degree, which considers both the wavelet and the directional contourlet transform. Since both wavelet and contourlet contain the downsampled process, WBCT is a shift-variant image decomposition scheme. For WBCT-based directional fusion, we used three wavelet levels and subbands for three wavelet levels from the coarser to the finer. , and Three different scale and direction cases, are used to investigate the effects of various decomposition scales and directions of NSCT on the fusion performance of the SSAN method. values of the fused results using different The methods on all the source images are listed in Table III. values of different methods on the Table IV lists the natural source images shown in Figs. 5–9 and Table V lists the
1524
IEEE SENSORS JOURNAL, VOL. 10, NO. 9, SEPTEMBER 2010
TABLE I PERFORMANCE OF DIFFERENT FUSION METHODS (
Q
TABLE II PERFORMANCE OF DIFFERENT FUSION METHODS (RMSE)
RMSE of different methods on the source images shown in Fig. 10. Observing Table III–Table V, we can see that the SSAN , and RMSE, and increasing performs the best in decomposed scale and direction will effectively improve the fusion results of SSAN objectively. It should be noted that mainly considers the amount of edge information the transferred from the source images to the fused image [31], [32]. Thus, the result of SSAN provided better performances in reserving the edge information of the source images. This because that the NSCT are used to fuse the high-frequency reflects information of the source images. The value of the dependence between the source images and the fused in Table IV shows that result in some degree. The largest the results of SSAN contain more useful information of the source images. The RMSE measures the difference between the ground truth image and the fused image. Table V demonstrates that the fused result from the SSAN has the smallest difference
AND
Q
)
TABLE III PERFORMANCE WITH DIFFERENT METHODS
(Q
)
from the “ideal” fused results. This may be due to that, for the SSAN-based image fusion, the low-frequency coefficients of NSCT are fused by SWT-based image fusion method, instead of averaging. Thus, more underlying information is transformed into the fused image. In order to estimate the computational efficiency of SSAN methods on different decomposed parameters, the time costs (in seconds) for different decomposed parameters are listed in Table VI. From the values in Table VI, we can observe the increase in time expense when the decomposed scale and direction
LI AND YANG: HYBRID MULTIRESOLUTION METHOD FOR MULTISENSOR MULTIMODAL IMAGE FUSION
TABLE IV PERFORMANCE WITH DIFFERENT METHODS (Q )
1525
consumes more time than the SWT or the NSCT-based method because it contains two different multiscale decomposition processes. This problem should be resolved in the future with hardware implementation. ACKNOWLEDGMENT The author would like to thank the anonymous reviewers for their detailed review, valuable comments, and constructive suggestions. The multifocus “Bookshelf,” ” Student,” and “Pepsi” images were supplied by Prof. R. Blum of Lehigh University. These images are available online at www.imagefusion.org.
TABLE V PERFORMANCE WITH DIFFERENT METHODS (RMSE)
TABLE VI COMPUTATION EFFICIENCY OF SSAN ON DIFFERENT DECOMPOSITION LEVEL(S)
rise. Thus, the best results are obtained at the cost of more time consumption. V. CONCLUSION In this paper, we first briefly analyze the complementary characteristics between the stationary wavelet transform and the nonsubsampled contourlet transform by comparing the differences between the reconstructed images. Then, the serial hybrid fusion schemes are proposed for exploring the complementary characteristics between different multiresolution methods in fusion processes. Objective and subjective comparisons between the different combined fusion methods have been implemented. Experimental results on several multisensor images show that the SSAN method performs better than the SNAS and, in most cases, performs better than the individual multiresolution-based methods, including NSCT, SWT, CWT, CVT, and WBCT. Some parameters affecting the performance are also investigated. From the experimental results we can see that the increase of decomposed levels and directions can improve the fused result of the best serial method, SSAN. A shortcoming of the hybrid multiresolution method is that it
REFERENCES [1] J. K. Aggarwal, Multisensor Fusion for Computer Vision. Berlin, Germany: Spinger-Verlag, 1993. [2] R. C. Luo, C. C. Yih, and K. L. Su, “Multisensor fusion and integration: Approaches, applications, and future research directions,” IEEE Sensors J., vol. 2, no. 2, pp. 107–119, 2002. [3] N. Cvejic, D. Bull, and N. Canagarajah, “Region-based multimodal image fusion using ICA bases,” IEEE Sensors J., vol. 7, no. 5, pp. 743–751, May 2007. [4] Z. Zhang and R. S. Blum, “A categorization of multiscale-decomposition-based image fusion schemes with a performance study for a digital camera application,” Proc. IEEE, vol. 87, no. 8, pp. 1315–1326, 1999. [5] D. L. Donoho and A. G. Flesia, “Can recent innovations in harmonic analysis ‘explain’ key findings in natural image statistics,” Network: Computation in Neural Systems, vol. 12, no. 3, pp. 371–393, 2001. [6] P. T. Burt and E. H. Andelson, “The Laplacian pyramid as a compact image code,” IEEE Trans. Commun., vol. 31, no. 4, pp. 532–540, 1983. [7] A. Toet, “Image fusion by a ratio of low-pass pyramid,” Patt Recog. Lett., vol. 9, no. 4, pp. 245–253, 1989. [8] N. Mitianoudis and T. Stathaki, “Optimal contrast correction for ICAbased fusion of multimodal images,” IEEE Sensors J., vol. 8, no. 12, pp. 2016–2026, Dec. 2008. [9] H. Li, B. Manjunath, and S. Mitra, “Multisensor image fusion using the wavelet transform,” Graph. Models Image Process., vol. 57, no. 3, pp. 235–245, 1995. [10] G. Pajares and J. Cruz, “A wavelet-based image fusion tutorial,” Patt. Recog., vol. 37, no. 9, pp. 1855–1872, 2004. [11] Y. Chibani and A. Houacine, “Redundant versus orthogonal wavelet decomposition for multisensor image fusion,” Patt. Recog., vol. 36, no. 4, pp. 1785–1794, 2003. [12] P. Hill, N. Canagarajah, and D. Bull, “Image fusion using complex wavelets,” in Proc. 13th Brit. Machine Vision Conf., Cardiff, U.K., 2002, pp. 487–496. [13] S. T. Li, J. T. Kwok, I. W. Tsang, and Y. N. Wang, “Fusing images with different focuses using support vector machines,” IEEE Trans. Neural Net., vol. 15, no. 6, pp. 1555–1561, 2004. [14] M. Beaulieu, S. Foucher, and L. Gagnon, “Multi-spectral image resolution refinement using stationary wavelet transform,” in Proc. IEEE Int. Geosci. Remote Sensing Symp., Vancouver, Canada, 1989, vol. 6, pp. 4032–4034. [15] O. Rockinger, “Image sequence fusion using a shift invariant wavelet transform,” in Proc. Int. Conf. Image Proc., Washington, DC, 1997, vol. 3, pp. 288–291. [16] E. J. Candes, L. Demanet, and D. L. Donoho, “Fast discrete curvelet transforms,” Multiscale Modeling and Simulation, vol. 5, no. 3, pp. 861–899, 2006. [17] M. N. Do and M. Vetterli, “The finite ridgelet transform for image representation,” IEEE Trans. Image Proc., vol. 12, no. 1, pp. 16–28, 2003. [18] M. N. Do and M. Vetterli, “The contourlet transform: An efficient directional multiresolution image representation,” IEEE Trans. Image Proc., vol. 14, no. 12, pp. 2091–2106, 2005. [19] T. Chen, J. P. Zhang, and Y. Zhang, “Remote sensing image fusion based on ridgelet transform,” in Proc. IEEE Int. Conf. Geosci. Remote Sensing Symp., Seoul, Korea, 2005, vol. 2, pp. 1150–1153. [20] F. Nencinia, A. Garzellia, S. Barontib, and L. Alparonec, “Remote sensing image fusion using the curvelet transform,” Inf. Fusion, vol. 8, no. 2, pp. 143–156, 2007. [21] Q. G. Miao and B. S. Wang, “A novel image fusion method using contourlet transform,” in Proc. 4th Int. Conf. Commun., Circuits, Syst., Guilin, China, 2006, pp. 548–552.
1526
[22] H. H. Song, S. Y. Yu, L. Song, and X. K. Yang, “Fusion of multispectral and panchromatic satellite images based on contourlet transform and local average gradient,” Opt. Eng., vol. 46, no. 2, 2007, 020502 (3 pages). [23] L. D. Cunha and J. P. Zhou, “The nonsubsampled contourlet transform: Theory, design, and applications,” IEEE Trans. Image Proc., vol. 15, no. 10, pp. 3089–3101, 2006. [24] B. Yang, S. T. Li, and F. M. Sun, “Image fusion using nonsubsampled contourlet transform,” in Proc. IEEE 4th Int. Conf. Image Graphics, Chengdu, China, 2007, pp. 719–724. [25] J. L. Starck, D. L. Donoho, and E. J. Candès, “Very high quality image restoration by combining wavelets and Curvelets,” in Proc. SPIE, San Jose, CA, 2001, pp. 9–19. [26] J. L. Starck, M. K. Nguyen, and F. Murtagh, “Wavelets and curvelets for image deconvolution: A combined approach,” Signal Proc., vol. 83, no. 10, pp. 2279–2283, 2003. [27] R. Eslami and H. Radha, “New image transforms using hybrid wavelets and directional filter banks: Analysis and design,” in Proc. IEEE Int. Conf. Image Proc., 2005, pp. 733–736. [28] V. Chappelier, C. Guillemot, and S. Marinkovic, “Image coding with iterated contourlet and wavelet transforms,” in Proc. IEEE Int. Conf. Image Proc., 2004, pp. 3157–3160. [29] V. P. Shah, N. H. Younan, and R. L. King, “An efficient pan-sharpening method via a combined adaptive PCA approach and contourlets,” IEEE Trans. Geosci. Remote Sens., vol. 46, no. 5, pp. 1323–1335, 2008. [30] S. T. Li and J. Shawe-Taylor, “Comparison and fusion of multiresolution features for texture classification,” Patt. Recog. Lett., vol. 26, no. 5, pp. 633–638, 2005. [31] C. S. Xydeas and V. Petrovic, “Objective image fusion performance measure,” Electron. Lett., vol. 36, no. 4, pp. 308–309, 2000. [32] V. Petrovic and T. Cootes, “Objective adaptive image fusion,” Inf. Fusion, vol. 8, no. 2, pp. 168–176, 2007. [33] B. Forster, D. V. D. Ville, J. Berent, D. Sage, and M. Unser, “Complex wavelets for extended depth-of-field: A new method for the fusion of multichannel microscopy images,” Microsc. Res. Tech., vol. 65, no. 8, pp. 33–42, 2004. [34] L. Tessens, A. Ledda, A. Pizurica, and W. Philips, “Extending the depth of field in microscopy through curvelet-based frequency-adaptive image fusion,” in Proc. IEEE Int. Conf. Acoustics, Speech and Signal Process., 2007, pp. 1861–1864. [35] L. Tang and Z. G. Zhao, “Multiresolution image fusion based on the wavelet-based contourlet transform,” in Proc. IEEE Int. Conf. Information Fusion, Quebec, QC, Canada, Jul. 2007, pp. 1–6, 9–12.
IEEE SENSORS JOURNAL, VOL. 10, NO. 9, SEPTEMBER 2010
[36] G. Piella and H. Heijmans, “A new quality metric for image fusion,” in Proc. IEEE Int. Conf. Image Process., Barcelona, Spain, 2003, pp. 173–176.
Shutao Li (M’07) received the B.S., M.S., and Ph.D. degrees in electrical engineering from Hunan University, Changsha, China, in 1995, 1997, and 2001, respectively. He joined the College of Electrical and Information Engineering, Hunan University, in 2001. He was a Research Associate in the Department of Computer Science, Hong Kong University of Science and Technology, from May 2001 to October 2001. From November 2002 to November 2003, he was a Postdoctoral Fellow at the Royal Holloway College, University of London, working with Prof. J. Shawe-Taylor. During April 2005 to June 2005, he has visited the Department of Computer Science, Hong Kong University of Science and Technology as a Visiting Professor. Now, he is a Full Professor with the College of Electrical and Information Engineering, Hunan University. He has authored or coauthored more than 100 refereed papers. His professional interests are information fusion, pattern recognition, bioinformatics, and image processing. Dr. Li has won two Second-Grade National Awards at Science and Technology Progress of China in 2004 and 2006. He served as a member of the Neural Networks Technical Committee from 2007 to 2008.
Bin Yang received the B.S. degree from Zhengzhou University of Light Industry, Zhengzhou, China, in 2005. He is currently working towards the Ph.D. degree at Hunan University, Changsha, China. His technical interests include image fusion and pattern recognition.