k aquifer skeletal storage coefficient. S' ke aquitard elastic skeletal storage coefficient ..... ments, inelastic specific storage generally is 20 to more ..... represents the rate of consolidation for a given load ... feet below land surface; mm, millimeter; lb/in2, pound per square inch; ft2/yr, square foot per year; ft/yr, foot per year; ftâ1, ...
Hydraulic and Mechanical Properties Affecting Ground-Water Flow and AquiferSystem Compaction, San Joaquin Valley, California By Michelle Sneed
U.S. GEOLOGICAL SURVEY Open-File Report 01-35
6441-23
Prepared in cooperation with the U.S. BUREAU OF RECLAMATION
Sacramento, California 2001
U.S. DEPARTMENT OF THE INTERIOR GALE A. NORTON, Secretary U.S. GEOLOGICAL SURVEY Charles G. Groat, Director
The use of firm, trade, and brand names in this report is for identification purposes only and does not constitute endorsement by the U.S. Geological Survey.
For additional information write to:
Copies of this report can be purchased from:
District Chief U.S. Geological Survey Placer Hall, Suite 2012 6000 J Street Sacramento, CA 95819-6129
U.S. Geological Survey Information Services Box 25286 Federal Center Denver, CO 80225
CONTENTS Abstract.................................................................................................................................................................................. Introduction ........................................................................................................................................................................... Purpose and Scope....................................................................................................................................................... Location of Study Area................................................................................................................................................ Hydrogeologic Setting................................................................................................................................................. Aquifer-System Storage......................................................................................................................................................... Elastic and Inelastic Compressibility (Specific Storage)............................................................................................. Aquifer-System Storage Coefficients .......................................................................................................................... Estimates Of Aquifer-System Storage Values........................................................................................................................ Aquifer-Test Analyses ................................................................................................................................................. Stress-Strain Analyses of Borehole Extensometer Observations ................................................................................ Laboratory Consolidation Tests ................................................................................................................................... Model Simulations....................................................................................................................................................... Evaluation of Specific-Storage Values................................................................................................................................... Summary................................................................................................................................................................................ References .............................................................................................................................................................................
1 1 3 3 3 4 4 5 5 5 7 11 11 24 25 25
FIGURES 1. Location of selected features in the Central Valley, California ................................................................................ 2 2. Relation of WESTSIM (U.S. Bureau of Reclamation) model domain and RASA (U.S. Geological Survey) model domain ........................................................................................................................................................... 18 TABLES 1. Storage coefficients estimated from results of aquifer tests near Pixley, California, February 1961 and March 1963 ............................................................................................................................................................. 6 2. Aquifer-system properties estimated from results of stress-strain analyses of borehole extensometer observations, San Joaquin Valley, California .......................................................................................................... 8 3. Consolidation test summaries ................................................................................................................................. 12 4. Aquifer-system properties estimated from results of calibrated models, San Joaquin Valley, California .............. 16 5. Aquifer-system properties used in Regional Aquifer-System Analysis simulations............................................... 20
Contents
III
CONVERSION FACTORS, VERTICAL DATUM, ABBREVIATIONS, WELL-NUMBERING SYSTEM, AND SYMBOLS
Conversion Factors Multiply
By
To obtain
0.3048 0.3048 0.06308 25.4 1.609 6.895 0.09290 2.590
foot (ft) foot per year (ft/yr) gallon per minute (gal/min) inch (in.) mile (mi) pound per square inch (lb/in2) square foot per year (ft2/yr) square mile (mi2)
meter meter per year liter per second millimeter kilometer kilopascal square meter per year square kilometer
Vertical Datum Sea level: In this report, "sea level" refers to the National Geodetic Vertical Datum of 1929 (NGVD of 1929)—a geodetic datum derived from a general adjustment of the first-order level nets of both the United States and Canada, formerly called Sea Level Datum of 1929. Abbreviations USBR
U.S. Bureau of Reclamation
RASA
Regional Aquifer-System Analysis
Well-Numbering System Wells are identified and numbered according to their location in the rectangular system for the subdivision of public lands. Identification consists of the township number, north or south; the range number, east or west; and the section number. Each section is divided into sixteen 40-acre tracts lettered consecutively (except I and O), beginning with "A" in the northeast corner of the section and progressing in a sinusoidal manner to "R" in the southeast corner. Within the 40-acre tract, wells are sequentially numbered in the order they are inventoried. The final letter refers to the base line and meridian. In California, there are three base lines and meridians: Humboldt (H), Mount Diablo (M), and San Bernardino (S). All wells in the study area are referenced to the Mount Diablo base line and meridian (M). Well numbers consist of 15 characters and follow the format 023S025E17Q002M. In this report, well numbers are abbreviated and written 23S/25E-17Q2. Wells in the same township and range are referred to only by their section designation, -17Q2. The following diagram shows how the number for well 23S/25E-17Q2 is derived. R25E RANGE T25S T24S T23S
R1E
Mount Diablo Meridian
TOWNSHIP
R1W
R24E R25E R26E
6
5
4
3
7
8
9
10 11 12
2
1
SECTION 17
D
C
B
A
E
F
G
H
30 29 28 27 26 25
M
L
K
J
31 32 33 34 35 36
N
P
Q
R
18 17 16 15 14 13 T23S
19 20 21 22 23 24
Well-numbering diagram 23S/25E-17Q2
IV
Contents
Symbols, in order of appearance
σe p ∆ h ρ g S*sk α∗k * (k) S'sk S'ske α'ke < σe(max)
S'skv α'kv > ' (e) (v) Ssk Sske αke Σb' Σb S'k Sk S'ke S'kv Ske βf, Sw S'sw Ssw n' n S* S*v
effective or intergranular stress pore-fluid pressure change (for example, ∆σe means change in effective stress) hydraulic head fluid density gravitational acceleration aquifer-system skeletal specific storage aquifer-system skeletal compressibility aquifer-system property skeletal component of specific storage, compressibility, or storage coefficient aquitard skeletal specific storage aquitard elastic skeletal specific storage aquitard elastic skeletal compressibility less than past maximum effective or integranular stress aquitard inelastic skeletal specific storage aquitard inelastic skeletal compressibility greater than aquitard property elastic property inelastic property aquifer skeletal specific storage aquifer elastic skeletal specific storage aquifer elastic skeletal compressibility aggregate thickness of aquitards aggregate thickness of aquifers aquitard skeletal storage coefficient aquifer skeletal storage coefficient aquitard elastic skeletal storage coefficient aquitard inelastic skeletal storage coefficient aquifer elastic skeletal storage coefficient fluid compressibility of water aquifer-system storage attributed to the pore water specific storage of water of aquitards specific storage of water of aquifers porosity of the aquitards porosity of the aquifers aquifer-system storage coefficient aquifer-system inelastic storage coefficient Contents
V
� S*ke S*ske S*k S*kv S*skv cv Kv T50 H50 t50 γw eo e K'v Sˆskv
VI
approximately equal to aquifer-system elastic skeletal storage coefficient aquifer-system elastic skeletal specific storage aquifer-system skeletal storage coefficient aquifer-system inelastic skeletal storage coefficient aquifer-system inelastic skeletal specific storage coefficient of consolidation vertical hydraulic conductivity time factor at 50-percent consolidation one-half specimen thickness at 50-percent consolidation time required to reach 50-percent consolidation specific weight of water initial void ratio final void ratio aquitard vertical hydraulic conductivity sample inelastic skeletal specific storage
Contents
Hydraulic and Mechanical Properties Affecting GroundWater Flow and Aquifer-System Compaction, San Joaquin Valley, California By Michelle Sneed ABSTRACT
INTRODUCTION
This report summarizes hydraulic and mechanical properties affecting ground-water flow and aquifer-system compaction in the San Joaquin Valley, a broad alluviated intermontane structural trough that constitutes the southern two-thirds of the Central Valley of California. These values will be used to constrain a coupled ground-water flow and aquifer-system compaction model of the western San Joaquin Valley called WESTSIM. A main objective of the WESTSIM model is to evaluate potential future land subsidence that might occur under conditions in which deliveries of imported surface water for agricultural use are reduced and ground-water pumping is increased. Storage values generally are components of the total aquifer-system storage and include inelastic and elastic skeletal storage values of the aquifers and the aquitards that primarily govern the potential amount of land subsidence. Vertical hydraulic conductivity values generally are for discrete thicknesses of sediments, usually aquitards, that primarily govern the rate of land subsidence. The data were compiled from published sources and include results of aquifer tests, stress-strain analyses of borehole extensometer observations, laboratory consolidation tests, and calibrated models of aquifer-system compaction.
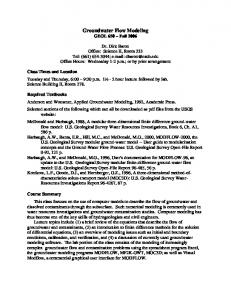
The San Joaquin Valley (fig.1), a broad alluviated intermontane structural trough, constitutes the southern two-thirds of the Central Valley of California (Poland and others, 1975; Lofgren, 1976; Ireland, 1986). The Central Valley and pertinent features in the area of focus—the San Joaquin Valley—are shown on figure 1. Land subsidence owing to ground-water withdrawal began in the San Joaquin Valley during the mid1920s. By 1970, the maximum subsidence exceeded 28 ft (Poland and others, 1975) and reached 29.7 ft in 1981. More than 5,200 mi2 of irrigable land, nearly one-half of the entire valley, has subsided at least 1 ft (Ireland, 1986). The subsidence occurred so slowly and uniformly over such a broad area throughout most of the affected area that its effects have been largely unnoticed by most observers. Locally, however, the differential subsidence has appeared abrupt and nonuniform, resulting in severe problems in the design and maintenance of canals and waterways, the expenditure of millions of dollars in repair and replacement of deep irrigation wells, and changes in irrigation and other farming practices (Lofgren, 1976). The importation of surface water to subsiding areas by way of canals, such as the Friant–Kern and Delta–Mendota canals beginning in the 1950s, and the California Aqueduct beginning in 1968, reduced the pumping of ground water in these areas and reversed the rapid decline of hydraulic head (measured as water levels in wells) starting in the late 1960s and early 1970s. In 1983, ground-water levels in most actively subsiding areas of the San Joaquin Valley had returned
Introduction
1
SACRAMENTO CO 121°
EXPLANATION WESTSIM model domain 35D5
Stockton
38°
SAN JOAQUIN CO
Well and identifier
0
30 Miles
0
30 Kilometers
Modesto
Tracy
O S C LAU CO S I N ED STA MERC
R6E
T 5 S
120°
Oro Loma
R 25 E
ERA C O MAD NO CO FRES
12/12-16H1
CALIFORNIA
16H2-6
35D5
11D3-6
Mendota
14/13-11D1
31N2,3
sn Fre
R 10 E
o
16/15-34N1
119°
34N1-5
ment o Vall
Sacramento Sacramento
19/17-22J1,2
ey
Huron
rraa eerr SSii
Sa
Avenal
n
CO
Kettleman City
16N1,3,4
Pixley
n
17Q2 17Q1 17R2
Delano
HA PI
ct du ue Aq
ey
ll Va
S
E NG
KERN CO
R 15 E
T
T 20 S
Tulare
ia ifor n Cal
ui
RA
da va
T
aq
Ne
Jo
AS
Map Area*
Lemoore
11Q1-3
36°
S EMIGAN DIO M MTTSS
Visalia
Hanford
20P1,2 23P2
San Francisco
SacramentoSan Joaquin Delta
T 15S
Slo u gh
Sacra
Cantua Creek
Fresno
A C TS EH M
Cana l
al
37°
T 10 S
t-K ern
Ca
n
Fr i a n
t do en
a
D CO RCE ME CO R E A MA D
KINGS CO TULARE CO
Del ta- M
Merced Los Banos
34F1 36A2 T 25 S
1A2
R 30 E
Wasco
Los Angeles
Bakersfield * Note: Central Valley comprises both the Sacramento and San Joaquin Valleys
Mt Diablo Base San Bernardino Base
Grapevine
R 20 E
Maricopa
R 25 E
3B1 R 32 E
T 12 N T 11 N 35° R 25 W R 20 W
Figure 1. Location of selected features in the Central Valley, California.
2
T 30 S
Arvin
Hydraulic and Mechanical Properties Affecting Ground-Water Flow and Aquifer-System Compaction, San Joaquin Valley, California
to, or recovered above, their 1940–1950 levels, and the subsidence had slowed considerably or ceased (Ireland, 1986). A detailed ground- and surface-water flow model of the western San Joaquin Valley called WESTSIM is being developed by the U.S. Bureau of Reclamation (USBR) to evaluate potential future land subsidence that might occur under conditions in which deliveries of imported surface water for agricultural use are reduced, resulting in increased ground-water pumping. A realistic model of land subsidence requires realistic values of model parameters that govern the magnitude and timing of aquifer-system compaction and the resulting land subsidence. These values include the skeletal specific storage, thickness, and vertical hydraulic conductivity of the aquitards. This report principally focusses on the skeletal specific storage values; vertical hydraulic conductivity of the aquitards is a secondary focus, and thicknesses of aquitards are minimally discussed.
Purpose and Scope This report summarizes hydraulic and mechanical properties for the aquifer system in the San Joaquin Valley. The data were compiled from published sources and include results of aquifer tests, stress-strain analyses of borehole extensometer observations, laboratory consolidation tests, and calibrated models of aquifersystem compaction. These data will be used by the USBR to model ground-water flow and aquifer-system compaction (land subsidence) in a coupled groundwater flow and land subsidence model of the western San Joaquin Valley (WESTSIM).
Location of Study Area The San Joaquin Valley includes roughly the southern two-thirds of the Central Valley of California (fig. 1). It is a broad structural trough surrounded on three sides by mountains—the Sierra Nevada on the east, the Coast Ranges on the west, and the Tehachapi and San Emigdio mountains on the south. The San Joaquin Valley is separated from the Sacramento Valley on the north by the combined deltas of the Sacramento and San Joaquin rivers. The valley extends 250 mi southward from north of Stockton to Grapevine at the foot of the Tehachapi Mountains. The width of the
valley floor ranges from 25 mi near Bakersfield to 55 mi near Visalia and averages about 35 mi. The area of the valley floor is 10,000 mi2, excluding the rolling foothills that skirt the mountains (Davis and others, 1959; Poland and others, 1975; Lofgren, 1976; Ireland, 1986). The geographic focus of this report, coincident with the WESTSIM model domain, is the western part of the San Joaquin Valley, which includes lands from Tracy on the north to Avenal on the south, and from the valley-side of the Coast Ranges on the west to the San Joaquin River and Fresno Slough on the east (fig. 1). Surrounding areas were included in this report, however, especially east of the WESTSIM model domain, because the estimates of hydraulic and mechanical properties in that area may be useful for comparable areas within the WESTSIM model domain.
Hydrogeologic Setting The San Joaquin Valley is a major structural trough whose main axis trends northwest-southeast. Throughout Late Cretaceous (Mesozoic Era) and Tertiary (Cenozoic Era) Periods of geologic time, thousands of feet of shallow-water marine sediments were deposited in this down-warping geosyncline. Overlying these marine deposits are continental deposits of late Cenozoic age. In aggregate, these marine and continental deposits form an immense wedge that thickens from east to west and from north to south. At the extreme southern end of the valley, the thickness of sediments exceeds 28,000 ft (Lofgren, 1976). The valley was formed chiefly by tectonic movement during late Cenozoic (late Tertiary Period and Quaternary Period) time that included major westward tilting of the Sierra Nevada block. Quaternary deformation has been principally along the southern and western borders of the valley, where the marine and continental rocks are tightly faulted and folded and the stream terraces are conspicuously elevated (Lofgren, 1976). A detailed discussion of the geology of the entire Central Valley is given by Page (1986). Ground water in the San Joaquin Valley occurs under confined and unconfined conditions. Three distinct ground-water bodies exist in much of the western, central, and southeastern parts of the valley. In downward succession, these include (1) a body of unconfined and semiconfined fresh water in alluvial deposits overlying a widespread lacustrine confining bed—the
Introduction
3
Corcoran Clay Member of the Tulare Formation (hereinafter called the Corcoran Clay), (2) an extensive reservoir of fresh water confined beneath the Corcoran Clay in alluvial and lacustrine deposits, and (3) a body of saline water contained in marine sediments that underlies the fresh water body throughout the area. In much of the eastern part of the valley, especially in the areas of major streams, the Corcoran Clay is not present and ground water occurs as one fresh water body to considerable depth (Lofgren, 1976).
AQUIFER-SYSTEM STORAGE The concepts relating the compressibility of the aquifer system and its storage properties are briefly reviewed in the following sections. Various storage terms are used to define and delineate the components of the aquifer system that contribute to the total aquifer-system storage. The term “aquifer system” refers to a complex set of variably extensive, faulted, and interbedded aquifers (coarse-grained sediments) and aquitards (fine-grained sediments) that function regionally as a water-yielding unit (Poland and others, 1972). Correct application of the storage values in this report requires an understanding of these terms.
Elastic and Inelastic Compressibility (Specific Storage) Under saturated confined conditions, the skeletal component of compressibility of an aquifer system governs the inverse change in volume and direct change in density of the material in response to a change in the intergranular stress. The law of effective stress (Terzaghi, 1925) states that when total stress on the aquifer system does not vary, the change in intergranular (effective) stress, σe, is related to the change in pore-fluid pressure, p, by ∆σ e = – ∆p Fluid pressure variations cause equal but oppositely sensed changes in intergranular stress. Expressed in terms of hydraulic head, h: h = p ⁄ ρg 4
where ρ is the density of the pore water and g is the acceleration resulting from gravity. The changes in intergranular stress can be determined by measuring or simulating hydraulic-head variations ∆σ e = – ∆hρg assuming ρ is constant. For the purposes of this report, the skeletal specific storage of an aquifer system, S*sk, is expressed in terms of the skeletal compressibility, α∗k, where the subscript k refers to the skeletal component of specific storage or compressibility and the superscript * refers to an aquifer-system property. Specific storage represents the volume of fluid taken into, or released from, a unit volume of aquifer-system sediment for a unit change in head (Lohman, 1972). The water being exchanged is derived from two processes—expansion or compression of the sediment that results from a change in effective stress, and expansion or compression of the fluid caused by a change in pore-fluid pressure. The skeletal component of specific storage addresses the first of these processes, which for most unconsolidated alluvial aquifer systems is the dominant component. Skeletal compressibilities of finegrained aquitards and coarser-grained aquifers typically differ by several orders of magnitude; therefore, it is useful to define them separately. Skeletal specific storages of the aquitards, S'sk, are defined for two ranges of stress, elastic and inelastic.
S' sk =
S' ske = α' S' skv = α'
ke
ρg,
σ σ e e ( max )
(1)
The primes (') signify aquitard properties, and the subscripts e and v refer to elastic and inelastic properties, respectively. For a change in effective stress, the aquitard deforms elastically when the effective stress remains less than the previous maximum effective stress, σe(max); when the effective stress exceeds σe(max), the aquitard deforms inelastically. For coarsegrained sediments typically found in aquifers, inelastic skeletal compressibility is negligible; therefore, skeletal specific storage of the aquifer, Ssk, is adequately represented by the fully recoverable, elastic component of skeletal specific storage, Sske:
Hydraulic and Mechanical Properties Affecting Ground-Water Flow and Aquifer-System Compaction, San Joaquin Valley, California
S sk = S ske = α ke ρg
(2)
In typical aquifer systems consisting of unconsolidated to partly consolidated late Cenozoic sediments, inelastic specific storage generally is 20 to more than 100 times larger than elastic specific storage (Riley, 1998). In the context of aquifer systems, the past maximum stress, or “preconsolidation stress,” can generally be represented by the previous lowest ground-water level. For stresses less than the preconsolidation stress—that is, ground-water levels higher than the preconsolidation-stress level—the aquifer system deforms (compresses or expands) elastically, and the deformation is recoverable. For stresses beyond the preconsolidation stress—ground-water levels lower than the preconsolidation-stress level—the pore structure of susceptible fine-grained sediment in the system may undergo significant rearrangement, resulting in a permanent (inelastic) reduction of pore volume and the vertical displacement of the land surface, or land subsidence.
Aquifer-System Storage Coefficients The products of the elastic or inelastic skeletal specific storage values and the aggregate thickness of the aquitards, Σb', or aquifers, Σb, define the skeletal storage coefficients of the aquitards (S'k) and the aquifers (Sk), respectively:
S' k =
S' ke = S' ske ( Σb' ),
σ