Original Research Hypercapnic Respiratory Failure in Obesity-Hypoventilation Syndrome: CO2 Response and Acetazolamide Treatment Effects Joan-Maria Raurich MD, Gemma Rialp MD, Jordi Iba´n˜ez MD, Juan Antonio Llompart-Pou MD, and Ignacio Ayestara´n MD
OBJECTIVE: In obesity-hypoventilation-syndrome patients mechanically ventilated for hypercapnic respiratory failure we investigated the relationship between CO2 response, body mass index, and plasma bicarbonate concentration, and the effect of acetazolamide on bicarbonate concentration and CO2 response. METHODS: CO2 response tests and arterial blood gas analysis were performed in 25 patients ready for a spontaneous breathing test, and repeated in a subgroup of 8 patients after acetazolamide treatment. CO2 response test was measured as (1) hypercapnic drive response (the ratio of the change in airway occlusion pressure 0.1 s after the start of inspiratory flow to the change in PaCO2), and (2) hypercapnic ventilatory response (the ratio of the change in minute volume to the change in PaCO2). RESULTS: We did not find a significant relationship between CO2 response and body mass index. Patients with higher bicarbonate concentration had a more blunted CO2 response. Grouping the patients according to the first, second, and third tertiles of the bicarbonate concentration, the hypercapnic drive response was 0.32 ⴞ 0.17 cm H2O/mm Hg, 0.22 ⴞ 0.15 cm H2O/ mm Hg, and 0.10 ⴞ 0.06 cm H2O/mm Hg, respectively (P ⴝ .01), and hypercapnic ventilatory response was 0.46 ⴞ 0.23 L/min/mm Hg, 0.48 ⴞ 0.36 L/min/mm Hg, and 0.22 ⴞ 0.16 L/min/mm Hg, respectively (P ⴝ .04). After acetazolamide treatment, bicarbonate concentration was reduced by 8.4 ⴞ 3.0 mmol/L (P ⴝ .01), and CO2 response was shifted to the left, with an increase in hypercapnic drive response, by 0.14 ⴞ 0.16 cm H2O/mm Hg (P ⴝ .02), and hypercapnic ventilatory response, by 0.11 ⴞ 0.22 L/min/mm Hg (P ⴝ .33). CONCLUSIONS: Patients with obesity-hypoventilation syndrome and higher bicarbonate concentrations had a more blunted CO2 response. Body mass index was not related to CO2 response. Acetazolamide decreased bicarbonate concentration and increased CO2 response. Key words: obesity-hypoventilation syndrome; hypercapnia; mechanical ventilation; respiratory center; respiratory function test; acetazolamide; metabolic alkalosis. [Respir Care 2010;55(11):1442–1448. © 2010 Daedalus Enterprises]
Introduction Obesity-hypoventilation syndrome is under-recognized and under-treated in hospitalized patients1 and its preva-
Joan Maria Raurich MD, Jordi Iba´n˜ez MD, Juan Antonio Llompart-Pou MD, and Ignacio Ayestara´n MD are affiliated with the Intensive Care Unit, Hospital Universitari Son Dureta, Palma de Mallorca, Spain. Gemma Rialp MD is affiliated with Son Lla`tzer Hospital, Palma de Mallorca, Spain.
lence increases as body mass index (BMI) increases.2,3 These patients have a higher rate of intensive care unit (ICU) admission than do obese patients without hypoventilation. No standardized guidelines exist for the treatment of hypercapnic respiratory failure in obesity-hypoventilation syndrome.4
SEE
THE
RELATED EDITORIAL
ON
PAGE 1504
Correspondence: Joan Maria Raurich MD, Intensive Care Unit, Hospital Universitari Son Dureta, Andrea Doria 55, 07014, Palma de Mallorca, Illes Balears, Spain. E-mail:
[email protected].
The exact mechanism that leads to alveolar hypoventilation in patients with obesity-hypoventilation syndrome is controversial.5 Proposed mechanisms include abnormal respiratory system mechanics secondary to obesity, impaired central response to hypercapnia and hypoxia, sleep-disor-
1442
RESPIRATORY CARE • NOVEMBER 2010 VOL 55 NO 11
The authors have disclosed no conflicts of interest.
HYPERCAPNIC RESPIRATORY FAILURE dered breathing, and neurohormonal abnormalities such as decreased leptin level or leptin resistance. Recently, Norman et al6 proposed a model that combines sleep-disordered breathing, central respiratory drive, and renal buffering to explain the transition from acute to chronic hypercapnia. Frequently, when these patients are admitted to the ICU for acute hypercapnic respiratory failure, they have a high plasma bicarbonate concentration. This fact introduces the controversy regarding whether it is appropriate to reduce the bicarbonate concentration with acetazolamide, a carbonic anhydrase inhibitor7-9 that aims to increase CO2 response.10,11 In obesity-hypoventilation-syndrome patients mechanically ventilated for hypercapnic respiratory failure we investigated the relationship between CO2 response, BMI, and plasma bicarbonate concentration, and the effect of acetazolamide on plasma bicarbonate and CO2 response. Methods Patients In 2 medical-surgical ICUs, during a 5-year period, we prospectively studied 25 nonconsecutive patients with obesity-hypoventilation syndrome recovering from hypercapnic respiratory failure after ⱖ 2 days of invasive mechanical ventilation. The study was approved by the review boards of both hospitals, and informed consent was obtained from patients or relatives. Obesity-hypoventilation syndrome is defined as a combination of obesity (BMI ⬎ 30 kg/m2) and awake arterial hypercapnia (PaCO2 ⬎ 45 mm Hg) in the absence of other causes of hypoventilation.1,12-14 Frequently, obesityhypoventilation syndrome is accompanied by sleep-disordered breathing or COPD.5 Essential to the diagnosis is the exclusion of other common causes of hypercapnia, such as chest-wall restrictive disorders (eg, scoliosis), severe interstitial lung disease, severe COPD (FEV1 ⬍ 35% of predicted), severe hypothyroidism, neuromuscular disease, and other central hypoventilation syndromes.14 Patients were eligible for the study if they had acute hypercapnic respiratory failure that required invasive mechanical ventilation for hypercapnic encephalopathy or failure of noninvasive mechanical ventilation, BMI ⬎ 30 kg/ m2, previous basal stable PaCO2 ⬎ 45 mm Hg, and bicarbonate concentration ⬎ 27 mmol/L, in the absence of other known causes of hypoventilation.
IN
OBESITY-HYPOVENTILATION SYNDROME bility; awake and able to obey oral commands; FIO2 ⱕ 0.5; PEEP ⱕ 8 cm H2O; and PaO2/FIO2 ⬎ 150 mm Hg.15 The first day that the patient was ready for a spontaneous breathing test, respiratory neuromuscular function was evaluated, during pressure support of 7 cm H2O, via measurement of airway occlusion pressure 0.1 s after the beginning of inspiration (P0.1), and CO2 response test. All these measurements were carried out with the patient in the semirecumbent position, immediately following endotracheal suctioning. We continuously recorded electrocardiogram, heart rate, pulse oximetry, and invasive systemic blood pressure. In a subgroup of these patients, who had plasma bicarbonate ⬎ 34 mmol/L, a second CO2 response test was performed several days after acetazolamide treatment, when plasma bicarbonate was reduced. The physician in charge was responsible for applying a spontaneous breathing test with T-piece 15–30 min after the respiratory neuromuscular measurements, or weaning the patient from mechanical ventilation with progressive reduction of the pressure-support ventilation. The decision to extubate or to reconnect the patient to the ventilator was made by the physician in charge. Measurements and Procedures Airway Occlusion Pressure. P0.1 was measured with the built-in system of the ventilator (Evita 2 Dura or Evita 4, Dra¨ger, Lu¨beck, Germany),16 and P0.1 was calculated as the mean of 5 measurements at each point of the study.17 Normal P0.1 in healthy volunteers is 0.75 ⫾ 0.32 cm H2O.18
All the patients underwent a daily screening by the physician in charge. The routine clinical criteria for considering a spontaneous breathing test were: hemodynamic sta-
CO2 Response Test. The CO2 response test has been detailed elsewhere.19,20 Our CO2 response test method involved the re-inhalation of expired air21,22 by inserting a corrugated tube between the Y-piece and the endotracheal tube, which increased the dead space by a volume similar to the tidal volume obtained with pressure support of 7 cm H2O. Baseline values for the hypercapnia test were obtained after applying 5 min of pressure-support ventilation with a pressure of 7 cm H2O, without PEEP, and FIO2 was set at 1.0 to prevent hypoxemia, for patient safety, and to avoid hypoxic stimuli. Then the respiratory rate, P0.1, and minute ˙ E) were recorded from the ventilator, and an volume (V arterial blood sample was drawn to measure PaCO2 with a blood gas analyzer (IL-1650, Instrument Laboratory, Izasa, Spain). Then we conducted the CO2 response test by increasing the dead space while maintaining the same ventilatory support, and when the exhaled CO2 (measured via capnography) had increased by approximately 10 mm Hg, ˙ E, and took we again measured respiratory rate, P0.1, and V another arterial blood sample. After the CO2 response test
RESPIRATORY CARE • NOVEMBER 2010 VOL 55 NO 11
1443
Protocol
HYPERCAPNIC RESPIRATORY FAILURE the added dead space was removed and the patient was returned to the original assisted ventilation mode. We studied the following hypercapnia indexes: • The hypercapnic drive response, defined as the ratio of the change in P0.1 (⌬P0.1) to the change in PaCO2 (⌬PaCO2) • The hypercapnic ventilatory response, defined as the ˙ E (⌬V ˙ E) to ⌬PaCO ratio of the change in V 2 ˙ E, ⌬P0.1, and ⌬PaCO were calculated as the difThe ⌬V 2 ference between the value at the end of the hypercapnia test and the baseline value. Normal values in healthy volunteers are: hypercapnic drive response 0.6 ⫾ 0.5 cm H2O/ mm Hg, and hypercapnic ventilatory response 2.6 ⫾ 1.2 L/ min/mm Hg.23,24 We recorded the following variables: age, weight, height, BMI, pulmonary function test results, polysomnography results, and arterial blood gas values while in stable condition and with hypercapnic respiratory failure before mechanical ventilation, Simplified Acute Physiological Score (SAPS) II, duration of mechanical ventilation, and outcome. Duration of mechanical ventilation was defined as the number of days between the beginning of mechanical ventilation and the day of successful weaning. The patients were followed until hospital discharge.
IN
OBESITY-HYPOVENTILATION SYNDROME Table 1.
Baseline Clinical Characteristics of 25 Patients With Obesity-Hypoventilation Syndrome
Female, No. (%) Age (mean ⫾ SD y) Weight (mean ⫾ SD kg) Height (mean ⫾ SD cm) Body mass index (mean ⫾ SD kg/m2) Comorbidities, No. (%) COPD Sleep-disordered breathing Pulmonary hypertension Right-sided heart failure Arterial hypertension Coronary artery disease Heart failure Alcohol abuse Diabetes Blood Gases in Stable Condition (n ⫽ 24) pH PaCO2 (mean ⫾ SD mm Hg) Plasma bicarbonate (mean ⫾ SD mmol/L) PaO2 (mean ⫾ SD mm Hg) Pulmonary Function Tests (n ⫽ 20) FVC (% predicted) FEV1 (% predicted) FEV1/FVC (%)
10 (40) 62 ⫾ 11 105 ⫾ 20 162 ⫾ 9 40.0 ⫾ 7.6 12 (48) 16 (64) 8 (32) 8 (32) 18 (72) 4 (16) 5 (20) 8 (32) 9 (36) 7.42 ⫾ 0.02 50.1 ⫾ 4.2 31.6 ⫾ 2.9 61 ⫾ 7 62 ⫾ 17 53 ⫾ 14 68 ⫾ 11
FVC ⫽ forced vital capacity
Statistical Analysis Categorical data are expressed as numbers and percentages. Continuous variables are expressed as mean ⫾ SD or as median and interquartile range. Differences between patients with and without COPD were analyzed with the Mann-Whitney test. BMI and plasma bicarbonate were coded by tertiles, and the differences between tertiles were compared with the Kruskal-Wallis test. BMI was coded by tertiles (not by obesity standard classification) to maintain a homogeneous categorization criteria as with plasma bicarbonate. The associations between BMI and plasma bicarbonate were analyzed with Pearson’s correlation. Differences between the first and second CO2 response tests were analyzed with the Wilcoxon signed-rank test. Statistical analysis was performed with statistics software (SPSS 15.0, SPSS, Chicago, Illinois). Results
Table 2.
Blood Values and CO2 Response on the Study Day (mean ⫾ SD)
Blood Values Hemoglobin (g/dL) pH PaCO2 (mm Hg) PaO2 (mm Hg) Plasma bicarbonate (mmol/L) CO2 Response P0.1 (cm H2O) Hypercapnic drive response (cm H2O/mm Hg) Hypercapnic ventilatory response (L/min/mm Hg)
13.3 ⫾ 3.1 7.38 ⫾ 0.04 60 ⫾ 12 379 ⫾ 125 34.9 ⫾ 5.2 2.4 ⫾ 1.5 0.21 ⫾ 0.16 0.39 ⫾ 0.28
P0.1 ⫽ occlusion pressure 0.1 s after the beginning of inspiration Normal values are: hypercapnic drive response 0.6 ⫾ 0.5 cm H2O/mm Hg and hypercapnic ventilatory response 2.6 ⫾ 1.2 L/min/mm Hg.23,24
We studied 25 patients with obesity-hypoventilation syndrome. Eight patients (32%) had associated both COPD and obstructive sleep apnea (Table 1). Data not available were: pulmonary function tests in 5 patients, polysomnography in 2 patients, and arterial blood gases while in stable condition in 1 patient (see Table 1). The arterial blood gas analysis before mechanical ventilation in 22 of 25 patients showed respiratory acidosis: pH 7.18 ⫾ 0.08 and PaCO2
102 ⫾ 25 mm Hg. The mean SAPS II score at ICU admission was 35 ⫾ 10. The total duration of mechanical ventilation was 6.7 ⫾ 5.3 d (median 5 d, interquartile range 3-8 d). Two patients (8%) died during their hospital stay. The mean duration of invasive mechanical ventilation at CO2 response test was 3.3 ⫾ 2.1 d (median 2 d, interquar-
1444
RESPIRATORY CARE • NOVEMBER 2010 VOL 55 NO 11
HYPERCAPNIC RESPIRATORY FAILURE Table 3.
IN
OBESITY-HYPOVENTILATION SYNDROME
Pulmonary Function Test and CO2 Response in Patients With and Without COPD
Pulmonary Function FVC (% predicted) FEV1 (% predicted) FEV1/FVC (%) CO2 Response Plasma bicarbonate (mmol/L) Hypercapnic drive response (cm H2O/mm Hg) Hypercapnic ventilatory response (L/min/mm Hg)
With COPD (mean ⫾ SD)
Without COPD (mean ⫾ SD)
(n ⫽ 12) 69 ⫾ 16 51 ⫾ 13 61 ⫾ 5 (n ⫽ 12) 35.6 ⫾ 5.5 0.19 ⫾ 0.14 0.35 ⫾ 0.31
(n ⫽ 8) 55 ⫾ 16 56 ⫾ 15 80 ⫾ 6 (n ⫽ 13) 34.3 ⫾ 5.0 0.23 ⫾ 0.17 0.42 ⫾ 0.27
P
.12 .52 ⬍ .001 .54 .61 .57
FVC ⫽ forced vital capacity Normal values are: hypercapnic drive response 0.6 ⫾ 0.5 cm H2O/mm Hg and hypercapnic ventilatory response 2.6 ⫾ 1.2 L/min/mm/Hg.23,24
Table 4.
Hypercapnic Drive and Ventilatory Response According to Body Mass Index and Plasma Bicarbonate Tertiles Tertile
Body Mass Index Hypercapnic drive response (cm H2O/mm Hg) Hypercapnic ventilatory response (L/min/mm Hg) Plasma Bicarbonate Hypercapnic drive response (cm H2O/mm Hg) Hypercapnic ventilatory response (L/min/mm Hg)
First (mean ⫾ SD)
Second (mean ⫾ SD)
Third (mean ⫾ SD)
(n ⫽ 8) 0.17 ⫾ 0.17 0.35 ⫾ 0.29 (n ⫽ 8) 0.32 ⫾ 0.17 0.46 ⫾ 0.23
(n ⫽ 9) 0.21 ⫾ 0.18 0.35 ⫾ 0.23 (n ⫽ 9) 0.22 ⫾ 0.15 0.48 ⫾ 0.36
(n ⫽ 8) 0.27 ⫾ 0.11 0.47 ⫾ 0.35 (n ⫽ 8) 0.10 ⫾ 0.06 0.22 ⫾ 0.16
P
.08 .71 .01 .04
test. Six patients were included in the third plasma bicarbonate tertile and 2 patients in the second plasma bicarbonate tertile. Acetazolamide was administered via nasogastric tube 1– 4 days before the second CO2 response test, with a dose range of 500 –2,750 mg. Plasma bicarbonate was reduced by 8.4 ⫾ 3.0 mmol/L (P ⫽ .01), hypercapnic drive response was increased by 0.14 ⫾ 0.16 cm H2O/ mm Hg (P ⫽ .02), and hypercapnic ventilatory response was increased by 0.11 ⫾ 0.22 L/min/mm Hg (P ⫽ .33) (Table 5). CO2 response was shifted to the left in the PaCO2 axis (Fig. 2). During the CO2 tests, no clinical complications occurred that required interruption of the test.
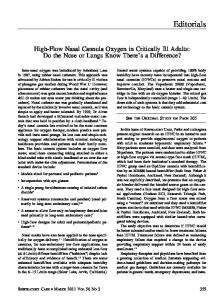
tile range 2– 4.5 d). The mean P0.1 was increased, and the mean CO2 response test levels were low (Table 2), compared to reference normal values. Comparing patients with and without COPD, no differences were found in the mean values of FEV1, plasma bicarbonate, hypercapnic drive response, or hypercapnic ventilatory response. Only the FEV1/FVC ratio showed statistically significant difference between the groups (Table 3). We did not find statistically significant differences in the mean hypercapnic drive response and ventilatory response of patients grouped according to BMI tertiles (Table 4 and Fig. 1). However, there was a nonsignificant trend of increased CO2 response and BMI (see Table 4). When BMI was grouped by obesity standard classifications, we found no significant differences (data not shown). We did find significant differences in hypercapnic drive response and ventilatory response of patients grouped according to plasma bicarbonate tertiles (see Table 4 and Fig. 1). The higher the plasma bicarbonate, the more blunted the CO2 response. There was no correlation between BMI and plasma bicarbonate (r2 ⫽ 0.04, P ⫽ .36). The second CO2 response test was performed in 8 patients (4 of them with COPD) 5.9 ⫾ 6.9 d after the first
This study in obesity-hypoventilation-syndrome patients mechanically ventilated for acute-on-chronic hypercapnic respiratory failure demonstrated an association between CO2 response and plasma bicarbonate, but not between CO2 response and BMI. The patients with the highest plasma bicarbonate had the most blunted CO2 response. Moreover, in the patients with the highest plasma bicarbonate, acetazolamide decreased the plasma bicarbonate and increased the hypercapnic drive response.
RESPIRATORY CARE • NOVEMBER 2010 VOL 55 NO 11
1445
Discussion
HYPERCAPNIC RESPIRATORY FAILURE
Fig. 1. Airway-occlusion pressure 0.1 s after the start of inspiratory flow (P0.1) versus PaCO2, and minute volume (V˙E) versus PaCO2, grouped according to the tertiles of body mass index (upper 2 graphs) and plasma bicarbonate (lower 2 graphs). The body mass index tertile values were: first tertile 30 –36 kg/m2, second tertile 36 – 42 kg/m2, third tertile 42– 60 kg/m2. The plasma bicarbonate tertile values were: first tertile 26 –31 mmol/L, second tertile 31– 37 mmol/L, third tertile 37– 44 mmol/L. The first-tertile data points are indicated with squares. The second-tertile data points are indicated with circles. The third-tertile data points are indicated with triangles. The error bars represent standard errors.
Patients with higher plasma bicarbonate showed decreased CO2 response, compared to the others. This decreased response could not be explained by the COPD. This fact highlights the importance of the respiratory-renal interaction. In a mathematical model, Norman et al6 showed that the respiratory-renal interactions create a cumulative effect over subsequent periods of sleep, which eventually results in a self-perpetuating state of chronic hypercapnia, through increased plasma bicarbonate and blunting of ventilatory drive.6 In that model a hyperbolic relationship between ventilatory response and bicarbonate concentrations was demonstrated, indicating blunting of the ventilatory CO2 response with elevated bicarbonate. The reason is that elevated bicarbonate is associated with smaller decreases in pH for a given change in PaCO2, and results in blunting of ventilatory response. We believe that the same model6 could explain some episodes of acute respiratory failure Table 5.
OBESITY-HYPOVENTILATION SYNDROME and high plasma bicarbonate in patients with obesity-hypoventilation syndrome. From a clinical point of view, it is interesting to find an association between acetazolamide (a carbonic anhydrase inhibitor) and reduced plasma bicarbonate, which explains a leftward shift of the CO2 response, as has been found in other studies,7-9,25 and the increase in CO2 response, according to the model by Norman et al.6 The effect of acetazolamide on ventilatory CO2 sensitivity in humans is less clear, since the CO2 response ranges from no change7,8,26 to an increase in CO2 sensitivity.10,11 A similar increase in CO2 response was found in patients with obstructive sleep apnea syndrome treated with continuous positive airway pressure, which reduced bicarbonate concentration.27 Applying our results to clinical practice, we believe that patients with obesity-hypoventilation syndrome being mechanically ventilated for acute hypercapnic respiratory failure and who have a high plasma bicarbonate could be treated with acetazolamide, once the acidosis is corrected, to decrease the plasma bicarbonate to the usual level and thus increase the central ventilatory drive. However, it must be underlined that most of these patients will still need noninvasive ventilation after extubation. Therefore, a larger controlled randomized study is necessary to confirm our results, especially on whether there is a reduction of the duration of weaning of mechanical ventilation, and, eventually, a potential implication on outcome. The lack of relationship between BMI, CO2 response, and plasma bicarbonate in our study, and with PaCO2 in the study by Kessler et al,28 might indicate that obesity acts as a trigger toward hypoventilation in those patients who already have physiologic abnormalities, similar to what occurs in obstructive sleep apnea-hypopnea syndrome, in which depressed chemoresponsiveness plays a role that is independent of obesity in the development of CO2 retention.27 However, the importance of obesity in the pathogenesis of obesity-hypoventilation syndrome is supported by the observation that weight loss alone decreases awake PaCO2,29 and that as much as BMI increases, the prevalence of obesity-hypoventilation syndrome rises.3,30
CO2 Response Test in 8 Patients Before and After Treatment With Acetazolamide
pH Plasma bicarbonate (mmol/L) Hypercapnic drive response (cm H2O/mm Hg) Hypercapnic ventilatory response (L/min/mm Hg)
1446
IN
Before Acetazolamide (mean ⫾ SD)
After Acetazolamide (mean ⫾ SD)
P
7.38 ⫾ 0.06 39.6 ⫾ 4.3 0.10 ⫾ 0.05 0.21 ⫾ 0.17
7.37 ⫾ 0.03 31.2 ⫾ 3.2 0.23 ⫾ 0.14 0.32 ⫾ 0.19
.55 .01 .02 .33
RESPIRATORY CARE • NOVEMBER 2010 VOL 55 NO 11
HYPERCAPNIC RESPIRATORY FAILURE
IN
OBESITY-HYPOVENTILATION SYNDROME REFERENCES
We thank Guillem Frontera MD, Investigation Unit, Hospital Universitari Son Dureta, Palma de Mallorca, Spain, for his assistance in the review of the statistical analysis.
1. Nowbar S, Burkart KM, Gonzales R, Fedorowicz A, Gozansky WS, Gaudio JC, et al. Obesity-associated hypoventilation in hospitalized patients: prevalence, effects, and outcome. Am J Med 2004;116(1): 1-7. 2. Pierce RJ, Hillman D, Young IH, O’Donoghue F, Zimmerman PV, West S, Burdon JG. Respiratory function tests and their application. Respirology 2005;10(Suppl 2):S1-S19. 3. Laaban JP, Chailleux E. Daytime hypercapnia in adult patients with obstructive sleep apnea syndrome in France, before initiating nocturnal nasal continuous positive airway pressure therapy. Chest 2005; 127(3):710-715. 4. Al Dabal L, Bahammam AS. Obesity hypoventilation syndrome. Ann Thorac Med 2009;4(2):41-49. 5. Mokhlesi B, Tulaimat A. Recent advances in obesity hypoventilation syndrome. Chest 2007;132(4):1322-1336. 6. Norman RG, Goldring RM, Clain JM, Oppenheimer BW, Charney AN, Rapoport DM, Berger KI. Transition from acute to chronic hypercapnia in patients with periodic breathing: predictions from a computer model. J Appl Physiol 2006;100(5):1733-1741. 7. Van de Ven MJ, Colier WN, van der Sluijs MC, Oeseburg B, Vis P, Folgering H. Effects of acetazolamide and furosemide on ventilation and cerebral blood volume in normocapnic and hypercapnic patients with COPD. Chest 2002;121(2):383-392. 8. Wagenaar M, Vos P, Heijdra Y, Teppema L, Folgering H. Comparison of acetazolamide and medroxyprogesterone as respiratory stimulants in hypercapnic patients with COPD. Chest 2003;123(5):14501459. 9. Wagenaar M, Vos PJ, Heijdra YF, Teppema LJ, Folgering HT. Combined treatment with acetazolamide and medroxyprogesterone in chronic obstructive pulmonary disease patients. Eur Respir J 2002; 20(5):1130-1137. 10. Vos PJ, Folgering HT, De Boo TM, Lemmens WJ, van Herwaarden CL. Effects of chlormadinone acetate, acetazolamide and oxygen on awake and asleep gas exchange in patients with chronic obstructive pulmonary disease (COPD). Eur Respir J 1994;7(5):850-855. 11. Swenson ER, Hughes JM. Effects of acute and chronic acetazolamide on resting ventilation and ventilatory responses in men. J Appl Physiol 1993;74(1):230-237. 12. Powers MA. The obesity hypoventilation syndrome. Respir Care 2008;53(12):1723-1730. 13. Olson AL, Zwillich C. The obesity hypoventilation syndrome. Am J Med 2005;118(9):948-956. 14. Lee WY, Mokhlesi B. Diagnosis and management of obesity hypoventilation syndrome in the ICU. Crit Care Clin 2008;24(3):533549. 15. Boles JM, Bion J, Connors A, Herridge M, Marsh B, Melot C, et al. Weaning from mechanical ventilation. Eur Respir J 2007;29(5):10331056. 16. Marini JJ, Smith TC, Lamb V. Estimation of inspiratory muscle strength in mechanically ventilated patients: the measurement of maximal inspiratory pressure. J Crit Care 1986;1(1):32-38. 17. Fernandez R, Raurich JM, Mut T, Blanco J, Santos A, Villagra A. Extubation failure: diagnostic value of occlusion pressure (P0.1) and P0.1-derived parameters. Intensive Care Med 2004;30(2):234-240. 18. Scott GC, Burki NK. The relationship of resting ventilation to mouth occlusion pressure. An index of resting respiratory function. Chest 1990;98(4):900-906. 19. Raurich JM, Rialp G, Ibanez J, Campillo C, Ayestaran I, Blanco C. Hypercapnia test as a predictor of success in spontaneous breathing trials and extubation. Respir Care 2008;53(8):1012-1018. 20. Raurich JM, Rialp G, Ibanez J, Ayestaran I, Llompart-Pou JA, Togores B. Hypercapnia test and weaning outcome from mechanical
RESPIRATORY CARE • NOVEMBER 2010 VOL 55 NO 11
1447
Fig. 2. Airway-occlusion pressure 0.1 s after the start of inspiratory flow (P0.1) versus PaCO2, and minute volume (V˙E) versus PaCO2 increase in 8 patients, before (solid lines) and after (dashed lines) acetazolamide treatment. The error bars represent standard errors.
The duration of mechanical ventilation of these patients was short and in-hospital mortality was lower than that previously reported for COPD patients.31,32 Limitations The first important limitation of this study is the small number of patients studied, in particular after acetazolamide treatment, so the study has limited statistical power. Second, the results of the CO2 response tests performed after acetazolamide treatment are difficult to interpret, as the time elapsed between the 2 tests and the adjunctive treatment received may have differed between patients. A control group could have been useful to address that problem. Third, we did not have pulmonary function and polysomnography tests for all the patients. Finally, the hypercapnia test was performed on an FIO2 of 1.0, and we can not exclude the possibility that hyperoxia might have decreased the hypercapnic stimulus; however, hyperoxia-induced hypercapnia may be primarily due to gas-exchange impairment rather than to depression of ventilation.33,34 Conclusions In patients with obesity-hypoventilation syndrome, invasively ventilated for hypercapnic respiratory failure, those with higher plasma bicarbonate had a more blunted CO2 response than did those with lower plasma bicarbonate. In those patients the BMI was not related to CO2 response. Acetazolamide decreased the plasma bicarbonate and increased the CO2 response.
ACKNOWLEDGMENTS
HYPERCAPNIC RESPIRATORY FAILURE
21.
22.
23.
24. 25.
26.
27.
ventilation in COPD patients. Anaesth Intensive Care 2009;37(5): 726-732. Ranieri VM, Giuliani R, Mascia L, Grasso S, Petruzzelli V, Puntillo N, et al. Patient-ventilator interaction during acute hypercapnia: pressure-support vs. proportional-assist ventilation. J Appl Physiol 1996; 81(8):426-436. Sidney DA, Poon CS. Ventilatory responses to dead space and CO2 breathing under inspiratory resistive load. J Appl Physiol 1995;78(2): 555-561. Altose MD, McCauley WC, Kelsen SG, Cherniack NS. Effects of hypercapnia and inspiratory flow-resistive loading on respiratory activity in chronic airways obstruction. J Clin Invest 1977;59(3):500507. Irsigler GB. Carbon dioxide response lines in young adults: the limits of the normal response. Am Rev Respir Dis 1976;114(3):529-536. Teppema LJ, Dahan A. Acetazolamide and breathing. Does a clinical dose alter peripheral and central CO2 sensitivity? Am J Respir Crit Care Med 1999;160(5 Pt 1):1592-1597. Kiwull-Schone HF, Teppema LJ, Kiwull PJ. Low-dose acetazolamide does affect respiratory muscle function in spontaneously breathing anesthetized rabbits. Am J Respir Crit Care Med 2001;163(2): 478-483. Han F, Chen E, Wei H, He Q, Ding D, Strohl KP. Treatment effects on carbon dioxide retention in patients with obstructive sleep apneahypopnea syndrome. Chest 2001;119(6):1814-1819.
1448
IN
OBESITY-HYPOVENTILATION SYNDROME 28. Kessler R, Chaouat A, Schinkewitch P et al. The obesity-hypoventilation syndrome revisited: a prospective study of 34 consecutive cases. Chest 2001;120(2):369-376. 29. Sugerman HJ, Fairman RP, Sood RK, Engle K, Wolfe L, Kellum JM. Long-term effects of gastric surgery for treating respiratory insufficiency of obesity. Am J Clin Nutr 1992;55(2 Suppl):597S601S. 30. Mokhlesi B, Tulaimat A, Faibussowitsch I, Wang Y, Evans AT. Obesity hypoventilation syndrome: prevalence and predictors in patients with obstructive sleep apnea. Sleep Breath 2007;11(2):117124. 31. Esteban A, Anzueto A, Frutos F, Alía I, Brochard L, Stewart TE, et al. Characteristics and outcomes in adult patients receiving mechanical ventilation. A 28-Day international study. JAMA 2002;287(3): 345-355. 32. Raurich JM, Perez J, Ibanez J, Roig S, Batle S. In-hospital and 2-year survival of patients treated with mechanical ventilation for acute exacerbation of COPD. Arch Bronconeumol 2004;40(7):295-300. 33. Sassoon CS, Hassell KT, Mahutte CK. Hyperoxic-induced hypercapnia in stable chronic obstructive pulmonary disease. Am Rev Respir Dis 1987;135(4):907-911. 34. Dick CR, Liu Z, Sassoon CS, Berry RB, Mahutte CK. O2-induced change in ventilation and ventilatory drive in COPD. Am J Respir Crit Care Med 1997;155(2):609-614.
RESPIRATORY CARE • NOVEMBER 2010 VOL 55 NO 11


![Primary Care Respiratory UPDATE - The Primary Care Respiratory ... [PDF]](https://m.moam.info/img/260x300/primary-care-respiratory-update-the-primary-care-r_647a26b1098a9ee0288b4693.jpg)