Biogeosciences, 11, 7077–7095, 2014 www.biogeosciences.net/11/7077/2014/ doi:10.5194/bg-11-7077-2014 © Author(s) 2014. CC Attribution 3.0 License.
I / Ca ratios in benthic foraminifera from the Peruvian oxygen minimum zone: analytical methodology and evaluation as a proxy for redox conditions N. Glock1,2 , V. Liebetrau2 , and A. Eisenhauer2 1 Sonderforschungsbereich
754, Christian Albrechts University Kiel, Climate Biogeochemistry Interactions in the Tropical Ocean, Kiel, Germany 2 GEOMAR Helmholtz-Institut für Ozeanforschung, Wischhofstr. 1–3, 24148 Kiel, Germany Correspondence to: N. Glock (
[email protected]) Received: 17 June 2014 – Published in Biogeosciences Discuss.: 29 July 2014 Revised: 7 October 2014 – Accepted: 21 October 2014 – Published: 12 December 2014
Abstract. In this study, we explore the correlation of I / Ca ratios in three calcitic and one aragonitic foraminiferal species. I / Ca ratios are evaluated as possible proxies for changes in ambient redox conditions across the Peruvian oxygen minimum zone to the ambient oxygen concentrations in the habitat of the foraminiferal species studied. Cleaning and measurement methods for the determination of I / Ca ratios are tested. All species show a positive trend in their I / Ca ratios as a function of higher oxygen concentrations. The most promising species appears to be Uvigerina striata, which shows a highly statistically significant correlation between I / Ca ratios and bottom water (BW) oxygenation (I / Ca = 0.032(±0.004) × [O2 ]BW + 0.29(±0.03), R 2 = 0.61, F = 75, P < 0.0001). Only for the aragonitic species Hoeglundina elegans is this relationship not significant. The iodine volatility in acidic solutions, the species dependency of I / Ca–[O2 ]BW correlations, and the individual variability of single tests, need to be accounted for when applying the I / Ca ratio as a proxy for redox conditions.
1
Introduction
Tropical oxygen minimum zones (OMZs) are the most important regions of low oxygen in the recent ocean, and the nutrient cycling in these regions influences the global ocean. This is particularly important, because model calculations predict that the ocean will progressively lose oxygen over the next 200 years (Bopp et al., 2002; Matear and Hirst, 2003;
Joos et al., 2003), with adverse consequences for marine life and fisheries. To some extent, oxygen loss is related to ocean warming, but the main reason is the decreased ocean ventilation due to circulation changes related to anthropogenically induced climate change. Indeed, a 50-year time series of dissolved oxygen concentrations reveals vertical expansion of the intermediate depth OMZs in the eastern equatorial Atlantic and the equatorial Pacific during this time interval (Stramma et al., 2008). One of the most distinct OMZs is located at the Peruvian upwelling cell. Although coastal upwelling cells cover only about 0.14 % of the global ocean (Baturin, 1983; Wolf, 2002), in 2007, 15.5 million tons of fish were caught by commercial fisheries in eastern boundary upwelling ecosystems (Fréon et al., 2009), corresponding to ∼ 17 % of the global catches (91.2 million tons; source: FAO FishStat, 2013). The Peruvian upwelling cell alone contributed about 8 % of global fish catches (7.2 million tons; source: FAO FishStat, 2013). Therefore, if the oxygen depletion in this area were to expand, habitats currently rich in pelagic fish would be endangered in the future. Reconstruction of the geographical extent and magnitude of OMZs in the past might help us to estimate future changes in oxygenation and to estimate the anthropogenic role in the recent OMZ expansions. For such long-term predictions, a geochemical proxy for quantitative oxygen reconstruction in OMZs would be highly desirable. The aim of this study is to evaluate I / Ca ratios in benthic foraminifera from the Peruvian OMZ as a possible oxygenation proxy. Element / Ca ratios in foraminiferal calcite have already been extensively
Published by Copernicus Publications on behalf of the European Geosciences Union.
7078
N. Glock et al.: I / Ca ratios in benthic foraminifera from the Peruvian oxygen minimum zone
used for reconstruction of physical and chemical properties. One of the most widespread and well-established methods is temperature reconstruction via the Mg / Ca ratio (Nürnberg et al., 1996; Rosenthal et al., 1997; Hastings et al., 1998; Lea et al., 1999; Elderfield and Ganssen, 2000; Lear et al., 2002). Some elemental ratios in foraminiferal calcite have already been evaluated as proxies for redox conditions (V / Ca: Hastings et al., 1996a, b, c; U / Ca: Russel et al., 1994). However, the U / Ca ratio seems to be strongly affected by the carbonate ion concentration (Russel et al., 2004; Yu et al., 2008). Furthermore, Mn / Ca ratios have been widely used to trace for diagenetic alteration of the samples, but there is still disagreement on the acceptable Mn / Ca ratio (Boyle, 1983; Boyle and Keigwin, 1985, 1986; Delaney, 1990; Ohkouchi et al., 1994, Lea, 2003). Nevertheless, in the absence of diagenetic alteration, the Mn / Ca ratio might also be a valuable redox proxy (Fhlaitheartha et al., 2010, Glock et al., 2012). This is supported by culture experiments on Ammonia tepida which showed that Mn is incorporated into the test calcite proportionally to the concentration in the ambient water (Munsel et al., 2010). Iodine is highly redox sensitive and easily reduced to iodite (I− ), which is easily oxidised (see the “200 years of iodine research” review by Küpper et al., 2011). Of the two most thermodynamically stable inorganic forms of dissolved iodine (iodide, e.g. I− ; iodate, e.g. IO− 3 ) (Wong and Brewer, 1977), only IO− seems to be incorporated into car3 bonates (Lu et al., 2010). Precipitation experiments by Lu et al. (2010) showed that the I / Ca ratios in synthetic calcite are a linear function of the IO− 3 concentrations in the ambient water, while I− concentrations did not affect the I / Ca ratios at all. Thus, it was proposed that iodate is partially substituting the carbonate ions in the calcite lattice. Since the I− / IO− 3 system has a reduction potential which is close to that of O2 / H2 O, it should be highly sensitive to oxygen depletion in the oceans (Rue et al., 1997; Harris, 2006; Brewer and Peltzer, 2009, Lu et al., 2010). In the Arabian Sea OMZ, I− concentration peaks in the core OMZ, where oxygen is most depleted (Farrenkopf and Luther, 2002). The latitudinal distribution of IO− 3 in the Atlantic shows a trend to higher concentrations at high latitudes and generally lower concentrations closer to the Equator (Truesdale et al., 2000). Lu et al. (2010) suggested that these trends are correlated with the different oxygen solubilities at different temperatures and, thus, that the IO− 3 concentrations in the Atlantic are directly correlated with the oxygen concentrations. Indeed, at higher latitudes in the Atlantic, IO− 3 can reach the concentration of the total iodine at high latitudes, while IO− 3 concentrations may drop during an extreme hypoxic event in the Benguela upwelling system (Truesdale et al., 2000; Truesdale and Bailey, 2000). The I− peaks in the core of the Arabian Sea OMZ can reach the total iodine concentrations, suggesting a quan− titative reduction of IO− 3 to I (Farrenkopf and Luther, 2002). Furthermore, the I / Ca ratios decrease in bulk carbonates
Biogeosciences, 11, 7077–7095, 2014
and belemnites from the early Toarcian and Cenomanian– Turonian oceanic anoxic events (OAEs), interpreted as a depletion of IO− 3 due to the strongly reducing conditions during those time intervals (Lu et al., 2010). All these results imply that I / Ca ratios in marine carbonates might be a valuable proxy for oxygen concentrations in the ancient ocean. In our study, we determined the I / Ca ratios in four different benthic foraminiferal species from the Peruvian OMZ with inductively coupled plasma mass spectrometry (ICPMS). The samples included two shallow infaunal and two epifaunal living species, of which three form calcitic (Uvigerina striata, Uvigerina peregrina, Planulina limbata) and one aragonitic (Hoeglundina elegans) tests. Cleaning protocols were modified after Barker et al. (2003) and Lu et al. (2010) to customise the I / Ca analyses to small amounts of foraminiferal carbonate. The main changes to standard cleaning protocols for foraminifera were the use of PFA instead of PE microcentrifuge vials and the application of more rigorous oxidative cleaning to avoid contamination by organically bound iodine. The measured I / Ca ratios are then correlated with bottom water oxygen concentrations [O2 ]BW for the calibration of I / Ca ratios in benthic foraminiferal calcite as a possible palaeo-oxygen proxy. Infaunal foraminiferal species are able to migrate into the pore waters. Oxygen in the pore waters is consumed by the diagenesis of organic matter (Froelich et al., 1979), which might complicate quantitative O2 reconstruction through infaunal species. Nevertheless, bottom water oxygenation usually has a strong influence on the oxygen gradient and penetration depth into the pore waters (Morford et al., 2005), which also justifies the use of the infaunal foraminiferal species for this study. 2 2.1
Material and methods Sampling procedure
During RV Meteor cruises M77/1 and M77/2 (October and November 2008), nine sediment cores from the Peruvian OMZ were recovered with a video-guided multiple corer for foraminiferal analyses in the present study (Table 1). The coring tubes were of a 100 mm inner diameter. Immediately after retrieval, one multicorer tube was transferred to a constant temperature (4 ◦ C) laboratory. Supernatant water of the core was carefully removed. The core was then gently pushed out of the multicorer tube and cut into 10 mm thick slices for benthic foraminiferal analysis. The samples were transferred ™ either to Whirl-Pak plastic bags or plastic bottles, transported at a temperature of 4 ◦ C, and finally stored at 4 ◦ C at GEOMAR, Kiel, Germany. 2.2
Foraminiferal studies
The foraminiferal samples were washed through stacked sieves with mesh sizes of 63 µm. The > 63 µm size fractions were collected in ethanol to prevent samples from www.biogeosciences.net/11/7077/2014/
N. Glock et al.: I / Ca ratios in benthic foraminifera from the Peruvian oxygen minimum zone
7079
Table 1. Sampling sites. [O2 ]BW in bold numbers are taken from Glock et al. (2011). [O2 ]BW for station M77/1-406/MUC-06 is taken from the CTD profile from station M77/1-392/CTD-RO-4. [O2 ]BW for station M77/2 St. 47-3 is taken from the CTD profile from station M77/2 St. 47-1 – CTD-19 (Krahmann, 2012). [O2 ]BW in italic numbers indicates that this value was intrapolated from the closest CTD profiles available. Site M77/1-406/MUC-06 M77/1-455/MUC-21 M77/1-487/MUC-39 M77/1-565/MUC-60 M77/1-604/MUC-74 M77/1-516/MUC-40 M77/1-459/MUC-25 M77/1 553/MUC-54 M77/2 St. 47-3
Longitude (W)
Latitude (S)
Water depth (m)
[O2 ]BW (µmol L−1 )
71◦ 52.400 78◦ 19.230 78◦ 23.170 78◦ 21.400 78◦ 22.420 78◦ 20.000 78◦ 25.600 78◦ 54.700 80◦ 31.360
17◦ 28.000 11◦ 00.000 11◦ 00.000 11◦ 08.000 11◦ 17.960 11◦ 00.000 11◦ 00.030 10◦ 26.380 07◦ 52.010
492 465 579 640 878 512 697 521 625
25.2 2.4 3.7 8.2 34.2 2.4 12.6 3.0 8.1
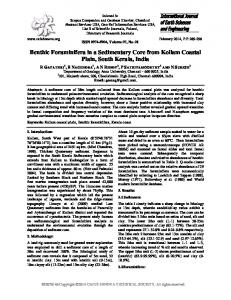
dividual for the light micrograph was picked from a random deeper sample (27–28 cm) of core M77/2 St. 47-3. Pictures of all species are shown in Fig. 1. The species U. striata and U. peregrina live shallow infaunal within the sediments in a pore water dominated environment, while P. limbata and H. elegans live epifaunal on top of the sediments in a bottom water dominated environment. 2.3
Figure 1. Photographs of the foraminiferal species used in this study. (a) Uvigerina striata, (b) Uvigerina peregrina, (c) Planulina limbata, (d) Hoeglundina elegans.
dissolution, and dried at 50 ◦ C. They were further subdivided into grain-size fractions of 63–125, 125–250, 250– 315, 315–355, 355–400, and > 400 µm. Specimens of Uvigerina striata, Uvigerina peregrina, Planulina limbata and Hoeglundina elegans were picked from the > 400 µm size fractions. Light micrographs of the different species were recorded with a miniPixie MPX2051UC CCD camera (AOS Technologies™ ) through objectives 1-6233 and 1-6010 of the Navitar™ company. Because all individuals of Uvigerina peregrina from the core top have been consumed during chemical digestion for later analyses of I / Ca ratios, the inwww.biogeosciences.net/11/7077/2014/
Cleaning methods
The number of specimens used for the analyses varied from 6 to 25 as a function of the species and the availability of specimens in the sample (see Table 2). The tests were gently crushed between two glass plates. The test fragments were transferred into PFA microcentrifuge vials and rinsed three times with reverse osmosis water (ROW) having a conductivity of 0.055 µS cm−1 (Elga™ PURELAB Ultra). After each rinsing step, the vials were put into a ultrasonic bath for 20 s. Afterwards, the vials were rinsed three times with ethanol and put into the supersonic bath for 1 min after each rinsing step. The vials were rinsed again two times with ROW to remove residual ethanol. An oxidative reagent was freshly mixed by adding 100 µL 30 % H2 O2 to 10 mL of a 0.1 M NaOH (p.a., Roth™ ) solution. Subsequently, 350 µL of this reagent were added to each vial. The vials were put into a water bath at 92 ◦ C for 15 min. During the oxidative cleaning, samples were taken out of the water bath at 5 min intervals, and gas bubbles were removed by snapping against the bottom of the vials. After three 5 min intervals, the vials were rinsed with ROW, and another 350 µL of the fresh oxidative reagent were added. The oxidative cleaning step was repeated for another 15 min (including the removal of air bubbles at 5 min intervals). After another 20 s in the ultrasonic bath, the vials were rinsed two times with ROW to remove residues of the oxidative reagent. The test fragments were transferred into clean vials with a pipette. Into each vial, 250 µL 0.001 M HNO3 (suprapure, Roth™ ) were added. Biogeosciences, 11, 7077–7095, 2014
7080
N. Glock et al.: I / Ca ratios in benthic foraminifera from the Peruvian oxygen minimum zone
Table 2. Details for analysed foraminiferal samples. Note that TMAH was added after transfer of the centrifuged dissolved sample into a clean vial. Thus, the volume of 0.0075 M HNO3 is reduced by 50 µL when TMAH is added (see text in Sect. 2). Sample name
Sample location
Species
A1 A2 A3 A4 A5 A6 A7 A8 A9 A10 B1 B2 B3 B4 B5 B6 B7 B8 C1 C2 C3 C4 D1 E1 F1 G1 H1 H2 J1 J2
566/MUC-59 566/MUC-59 566/MUC-59 566/MUC-59 566/MUC-59 566/MUC-59 566/MUC-59 566/MUC-59 566/MUC-59 566/MUC-59 487/MUC-38 487/MUC-38 487/MUC-38 487/MUC-38 487/MUC-38 487/MUC-38 487/MUC-38 487/MUC-38 455/MUC-21 455/MUC-21 455/MUC-21 455/MUC-21 553/MUC-54 406/MUCM77-2 47-3 516/MUC-40 459/MUC-25 459/MUC-25 604/MUC-74 604/MUC-74
U. striata U. striata U. striata U. striata P. limbata P. limbata P. limbata P. limbata U. striata P. limbata U. striata U. striata U. striata P. limbata P. limbata P. limbata H. elegans H. elegans U. striata U. striata H. elegans H. elegans P. limbata P. limbata U. striata U. striata U. peregrina U. striata U. peregrina H. elegans
Number of specimens
Volume of 0.075 M HNO3 for dissolution (µL)
Volume of TMAH added after dissolution (µL)
20 20 20 20 6 6 6 6 20 10 15 15 15 6 6 6 11 10 15 15 10 15 6 6 15 15 15 10 9 10
550 550 550 550 400 400 400 400 450 450 550 450 450 400 400 350 400 550 400 450 550 550 350 350 450 450 450 400 400 450
9 9 9 9 7 7 7 7 8 8 9 8 8 7 7 6 7 9 7 8 9 9 6 6 8 8 8 7 7 8
The vials were put into the ultrasonic bath for 20 s. The extremely dilute acid solution was removed, and the vials were rinsed three times with ROW. The samples were dissolved in 0.075 M HNO3 (suprapure, Roth™ ), centrifuged and supernatant transferred into clean vials, leaving a residue of 50 µL in the centrifuge vial. Afterwards tetramethylammoniumhydroxide (TMAH, 25 % in H2 O, TraceSELECT, impurities ≤ 10 µg kg−1 total iodine, Sigma Aldrich™ ) solution was added to each sample to reduce loss of volatile I. The volume of 0.075 M HNO3 for dissolution and TMAH varied due to the different sample sizes (see Table 2). During each cleaning session, 1–3 blank samples without foraminifera passed all cleaning steps to correct for the complete procedural blank after the analyses. 2.4
standards included the external aragonitic coral reference material JCp-1 (I / Ca ratios reported by Lu et al., 2010; Chai and Muramatsu, 2007), a lab-internal pure aragonite and labinternal pure calcite standard. These three references were chosen to test the reproducibility of relative differences in the I / Ca ratios for each measurement session. Furthermore, they cover a broad range of I / Ca ratios (e.g. high in the JCp-1 and very low in the reference calcite). Before analyses on each measurement day, fresh reference standard solutions were prepared from the solid powders to minimise loss of volatile iodine. Usually, 20 mL of 50 ppm Ca solutions were mixed by 2.5 mg carbonate, 400 µL of 25 % TMAH, 150 µL concentrated HNO3 and 19.45 mL ROW. In some cases, 100 mL solutions were prepared using 5 times these amounts.
Matrix matching carbonate standards
Three different carbonate standards were used to ensure reproducibility between different analytical sessions. These Biogeosciences, 11, 7077–7095, 2014
www.biogeosciences.net/11/7077/2014/
N. Glock et al.: I / Ca ratios in benthic foraminifera from the Peruvian oxygen minimum zone
7081
Table 3. Operation conditions for Agilent 7500cx. Value/description RF power Nebuliser Spray chamber Autosampler Uptake rate (µL min−1 ) Washout time(s) beaker 1 Washout time(s) beaker 2 Uptake time(s) Stabilisation time(s) Argon plasma gas flow rate (L min−1 ) Argon auxiliary gas flow rate (L min−1 ) Argon nebuliser gas flow rate (L min−1 ) Sample cone Skimmer cone CeO/Ce and Ba2+ /Ba+ ratios
JCP non hom
12
JCP hom
I/Ca (mmol/mol)
10
8
6
4
2
n = 100
0,7
0,9
1,1
n = 60
1,3
1,5
1,7
1,9
2,1
2,3
Figure 2. Comparison of all I / Ca measurements on the untreated JCp-1 and an aliquot of the same standard homogenised using a mortar. The mean precision for a single analysis for the aragonitic reference standards in this study was 1σmean = 1.5 % (n = 236).
2.5
Quadrupole ICP-MS analyses
The analyses were performed on an Agilent 7500cx Quadrupole ICP-MS. Operation conditions are listed in Table 3. Instrument sensitivity was optimised by using a 1 ppb Li–Y–Tl–Ce–Mg–Co standard solution before the measurements. For sample introduction, a micro-autosampler (Cetac ASX 100) coupled to a PFA self-aspiration nebuliser fitted to a glass spray chamber was used. Due to the small available sample volume (typically < 500 µL), the low sample uptake rate of the self-aspirating system was an important feature during the analyses. The integration times were 0.3 s for 43 Ca, 0.3 s for 44 Ca and 6.0 s for 127 I, with five repetition runs. www.biogeosciences.net/11/7077/2014/
1500 W PFA (100 µL min−1 , self aspirating) Glass (cooled to 2 ◦ C) Cetac ASX 100 100 60 120 40 40 14 0.23 0.93 Nickel (Agilent) Nickel < 2.5 %
For the preparation of the standards, 170 mg solid KIO3 (suprapur, Sigma Aldrich™ ) were dissolved in 97.25 mL ROW, 2 mL of 25 % TMAH and 0.75 mL conc. HNO3 (1000 ppm of iodine). Furthermore, a 1000 ppm Ca solution was prepared by dissolving 250 mg solid CaCO3 (suprapur, Sigma Aldrich™ ) in 99.25 mL ROW and 0.75 mL conc. HNO3 . Solid CaCO3 was used for the closest matching of the sample matrix. These solutions were used to prepare a succession of working standards via three steps of pre-dilution. Concentrations for standards and pre-dilutions are given in Table 4. Again, on each day, all these solutions were prepared freshly before the analyses. The working standards were prepared directly in the vials, which were later used for sample injection. Samples were analysed directly after the cleaning procedure to prevent loss of volatile iodine even after trapping with TMAH. For the analyses, samples were diluted to ∼ 50 ppm Ca to keep the matrix consistent. Samples were diluted with a matrix matching solution prepared from 19.45 mL ROW, 400 µL of 25 % TMAH and 150 µL conc. HNO3 (e.g. 0.5 % TMAH/0.5 % HNO3 ). The standard row was measured at least after every 10 samples to correct for instrumental drift. The I / Ca ratio of the internal calcite reference standard was below the detection limit in every measurement session (n = 70). This indicates that the procedural blank for preparation of the standard solutions was also below the detection limit.
3 3.1
Results Reproducibility
All determined I / Ca ratios are reported in the Appendix (Appendix Tables A1 and A2). Summaries of mean values for the different reference standards and Biogeosciences, 11, 7077–7095, 2014
7082
N. Glock et al.: I / Ca ratios in benthic foraminifera from the Peruvian oxygen minimum zone
Table 4. Element concentrations and volumes of different pre-dilutions for the different standard rows used for ICP-MS. Standard or dilution
Ca (ppm)
5 ppm I 50 ppb I 5 ppb I Standard 0 Standard 1 Standard 2 Standard 3 Standard 4 Standard 5 Standard 6
0 0 0 50 50 50 50 50 50 50
Iodine
H2 O (ROW) (mL)
25 % TMAH (µL)
Conc. HNO3 (µL)
1000 ppm Ca (µL)
Iodine pre-dilution (µL)
Concentration of used iodine pre-dilution
19.35 19.25 17.50 3.68 3.67 3.64 3.59 3.50 3.30 2.91
400 400 360 80 79.6 79.2 78.0 76.0 72.0 64.0
150 150 135 29.2 29.0 28.9 28.4 27.7 26.2 23.2
0 0 0 200 200 200 200 200 200 200
100 200 2000 0 20 40 100 200 400 800
1000 ppm 5 ppm 50 ppb – 5 ppb 5 ppb 5 ppb 5 ppb 5 ppb 5 ppb
5 ppm 50 ppb 5 ppb 0 ppt 25 ppt 50 ppt 125 ppt 250 ppt 500 ppt 1000 ppt
4,5 n = 60
4 3,5 3
I/Ca (mmol/mol)
n = 70
2,5 2 1,5 1 n = 28
0,5 0
n = 70 (not detectable) 0
0,5
1
Calcite
1,5
2
2,5
Aragonite
-0,5
3
JCp-1
3,5
4
4,5
U. peregrina 5 x 20 specimens
Figure 3. Mean I / Ca ratios, number of measurements (n) and errors (1 SD) for the carbonate reference standards and 5 different samples of 20 U. striata specimens from the same location (M77-1565/MUC-60).
foraminiferal samples of the same species and sampling site are listed in Table 5. Figure 2 shows a comparison of I / Ca ratios measured in an aliquot of untreated JCp-1 and an aliquot of the same JCp-1 standard homogenised in a mortar. The reproducibility of the homogenised JCp-1 (3.82 ± 0.08 µmol mol−1 ; n = 60; 1σ = 2.0 %) was 1 order of magnitude higher than in the untreated aliquot (I / Ca = 4.05 ± 0.96 µmol mol−1 ; n = 100; 1σ = 24 %). These results strongly indicate inhomogeneities within the JCp-1 with respect to the I / Ca ratios. As a consequence of these results, only homogenised aliquots are used as reference standards in this study. During each measurement session, I / Ca ratios of freshly prepared solutions of the reference standards (the external JCp-1, the internal aragonite and the calcite) were repeatedly measured to ensure the reproducibility of the method Biogeosciences, 11, 7077–7095, 2014
between different days. Additionally, every day, I / Ca ratios of one (in one case two) sample(s) of 25 U. striata specimens from the same sampling location (M77-1 565/MUC-60) were measured (Fig. 3). The I / Ca ratios were 3.82 ± 0.08 µmol mol−1 (n = 60; 1σ = 2.0 %) for the JCp-1, 2.59 ± 0.09 µmol mol−1 (n = 52; 1σ = 3.5 %) for the aragonite and 0.54 ± 0.04 µmol mol−1 (n = 28; 5 different assemblages of 25 specimens each; 1σ = 6.6 %) for the internal U. striata reference samples. The mean precision for single I / Ca determinations for these standards (including the standard deviations of I and Ca counts between the different measurement cycles and the error of the calibration function) ranged from ∼ 1.29 % (n = 60) for the JCp-1 to ∼ 2.15 % (n = 28) for the U. striata samples. 3.2
Volatility of iodine
Six different foraminiferal samples from three different species were measured directly after the cleaning procedure and 1 day after dissolution to test the effects of iodine volatility on the measured I / Ca ratios (Fig. 4). For this, the samples were stored in PFA microcentrifuge vials after dissolution. All samples show lower I / Ca ratios 1 day after dissolution, except for one measurement of sample A1, where the I / Ca ratio was slightly higher than the directly measured samples. The exceptionally high standard deviation of this value (18 %) and Grubb’s outlier test indicate that this data point is an outlier. The mean iodine loss after 1 day varied between ∼6 % and ∼22 % (excluding the outlier). 3.3
Correlation between foraminiferal I / Ca ratios and oxygenation
The correlations between the I / Ca ratios in tests of four different benthic foraminiferal species and [O2 ]BW are shown in Fig. 5. The I / Ca in all species tends to be positively correlated with [O2 ]BW . The correlation is highly significant (P < 0.0001; ANOVA) for U. striata, significant for P. limbata (P = 0.009; ANOVA), but not significant for H. elegans www.biogeosciences.net/11/7077/2014/
N. Glock et al.: I / Ca ratios in benthic foraminifera from the Peruvian oxygen minimum zone
7083
Table 5. Mean I / Ca ratios, number of measurements (n) and errors for the reference standards and foraminiferal samples at the different sampling sites. The variability represents the standard deviation between all measurements of the sample/standard. Sampling site
Calcite Aragonite JCp-1 (no treatment) JCp-1 (homogenised) U. striata M77-1 565/MUC-59 U. striata M77-1 487/MUC-38 U. striata M77-1 455/MUC-21 U. striata M77-2 47-3 U. striata M77-1 516/MUC-40 U. striata M77-1 459/MUC-25 P. limbata M77-1 565/MUC-59 P. limbata M77-1 487/MUC-38 P. limbata M77-1 553/MUC-54 P. limbata M77-1 406/MUC-06 H. elegans M77-1 487/MUC-38 H. elegans M77-1 455/MUC-21 H. elegans M77-1 604/MUC-74 U. peregrina M77-1 604/MUC-74 U. peregrina M77-1 459/MUC-25
n
I / Ca (µmol mol−1 )
Variability (1σ )
Mean precision for single measurement (1 SD)
1σ of mean precision
70 70 100 60 28 12 6 1 1 1 8 5 1 1 9 8 1 1 1
n.d. 2.59 4.05 3.82 0.54 0.43 0.32 0.41 0.57 0.91 1.22 1.32 1.34 2.20 0.13 0.19 0.29 0.40 0.48
– 3.22 % 23.80 % 1.97 % 6.56 % 6.86 % 7.19 % – – – 6.84 % 22.80 % – – 4.89 % 34.57 % – – –
– 1.56 % 1.51 % 1.29 % 2.15 % 2.51 % 4.09 % 4.47 % 3.13 % 2.35 % 2.07 % 1.67 % 1.99 % 1.28 % 6.34 % 6.78 % 5.87 % 4.87 % 3.55 %
– 0.92 % 0.62 % 0.53 % 0.92 % 0.60 % 0.85 % – – – 0.50 % 0.40 % – – 1.91 % 3.36 % – – –
(P = 0.1000; ANOVA). The epifaunal species P. limbata shows the highest I / Ca ratios (1.03–2.20 µmol mol−1 ), followed by the shallow infaunal species U. striata (0.28– 0.91 µmol mol−1 ). The epifaunal aragonitic species H. elegans has the lowest I / Ca ratios (0.12–0.31 µmol mol−1 ). The I / Ca ratio of U. peregrina is much lower than the I / Ca ratio of U. striata from the same sampling site (0.39 µmol mol−1 compared to 0.91 µmol mol−1 ; M77/1459/MUC-25; 697 m). Neither regression nor ANOVA was calculated for U. peregrina, due to the low number of data points (n = 2).
1,6
dissolution directly before measurement
1,4 1 day after dissolution 1,2
I/Ca (mmol/mol)
Standard/ species
1
0,8
0,6
0,4
0,2
4
Discussion 0
4.1
Methodical issues: reproducibility and iodine volatility
The significant differences in the reproducibility of the I / Ca ratio of untreated versus homogenised JCp-1 aliquots (Fig. 2) indicate that heterogeneities may have a huge impact on the precision of the iodine measurements. Even within one session by measuring the same solution out of the same beaker, the I / Ca ratio of the untreated JCp-1 is reproducible only within 24 %. The I / Ca reproducibility of the homogenised JCp-1 (n = 60; 1σ = 2.0 %) is of the same order of magnitude as reported earlier by Lu et al. (2010): n = 8; 1σ = 1.4 %; Chai and Muramatsu, 2007: n = 5; 1σ = 3.7 %. Apart from that, there are problems with the accuracy of the stanwww.biogeosciences.net/11/7077/2014/
0
1
A1
2
A2
3
A5
4
5
A6 B1 Sample name
6
B4
7
8
B7
Figure 4. Comparison of I / Ca ratios measured in seven different samples directly after dissolution (diamonds) and 1 day after dissolution (triangles). Iodine volatility appears to have a strong influence on the samples within 1 day. For sample specification, see Table 2. The mean precision for the foraminiferal analyses in this study was species dependent: 1σmean = 3.2 % (U. striata n = 65), 4.21 % (U. peregrina n = 2), 2.0 % (P. limbata n = 18) and 7.4 % (H. elegans n = 29).
dards, because the I / Ca ratio of the homogenised JCp1 reported here (3.82 ± 0.08 µmol mol−1 ) is lower than the Biogeosciences, 11, 7077–7095, 2014
7084
N. Glock et al.: I / Ca ratios in benthic foraminifera from the Peruvian oxygen minimum zone 1
1
U. striata shallow infaunal calcitic
0,8 0,7 0,6 0,5 0,4
y = 0.032 (±0.004))x + 0.29(±0.03) R² = 0.61 F = 75 P < 0.0001
0,3 0,2 0
2
4
U. peregrina shallow infaunal calcitic
0,9
I/Ca (mmol/mol)
I/Ca (mmol/mol)
0,9
6
8
10
12
0,8 0,7 0,6 0,5 0,4 0,3 0,2 0
14
10
[O2]BW (mmol/kg) 2,3
P. limbata epifaunal calcitic
1,9 1,7 1,5 1,3
1,1 y = 0.037(±0.012)x + 1.05 (±0.11) R² = 0.37 F = 9.3 P = 0.009
0,9
0,7 0
5
10
15
20
30
40
H. elegans epifaunal aragonitic
0,4
I/Ca (mmol/mol)
I/Ca (mmol/mol)
2,1
20
[O2]BW (mmol/kg)
25
0,3
0,2
0,1 y = 0.0034(±0.0020)x + 0.16(±0.015) R² = 0.071 F = 2.9 P = 0.1
0 0
30
10
20
30
40
[O2]BW (mmol/l)
[O2]BW (mmol/l)
Figure 5. Correlation of I / Ca ratios with bottom water oxygen concentrations [O2 ]BW for the four analysed benthic foraminiferal species. Different symbols at the same locations indicate that measurements were done on different sample assemblages from the same sampling site. Significances were calculated with an ANOVA. The dashed line is just for orientation, because no correlation could be calculated with only two data points. The mean precision for the foraminiferal analyses in this study was species dependent: 1σmean = 3.2 % (U. striata; n = 65), 4.21 % (U. peregrina; n = 2), 2.0 % (P. limbata; n = 18) and 7.4 % (H. elegans; n = 29).
I / Ca ratios of the JCp-1 reported in the literature (Lu et al., 2010: 4.27 ± 0.06 µmol mol−1 ; Chai and Muramatsu, 2007: 4.33 ± 0.16 µmol mol−1 ). A possible explanation might be that volatile iodine adsorbed to the surface of the JCp-1 powder has been mobilised and removed during the grinding process, since the mean I / Ca ratio of the untreated JCp-1 aliquot is closer to the values reported in the literature. Another possibility is that different aliquots of the JCp-1 which show a difference in the I / Ca ratios have been used in different labs. Nevertheless, the reproducibility of all our carbonate reference standards (except for the JCp-1 before homogenisation) indicates that drift effects are negligible between the different measurement sessions. Iodine is a volatile element which could be stabilised by adding TMAH, which also reduces the memory effect during ICP-MS measurement (Muramatsu and Wedepohl, 1998; Tagami and Uchida, 2005; Lu et al., 2010). The fact that we observe a strong decrease in the I / Ca ratios after 1 day of sample dissolution supports the requirement of an immediate measurement directly after sample disso-
Biogeosciences, 11, 7077–7095, 2014
lution. Although a similar matrix was used for the samples after dissolution (e.g. 0.5 % TMAH), the results presented here differ from the observations of Lu et al. (2010). The author tested the iodine volatility in such a matrix over 2 months, did not observe a strong loss in iodine after 30 days, and concluded that iodine loss within 2 days should be negligible. Despite the volatility problem, the very reproducible I / Ca ratio in five different samples of 25 U. striata specimens (I / Ca = 0.54 ± 0.04 µmol mol−1 ; 1σ = 6.6 %) from the same location (M77-1 565/MUC-60) which were cleaned, dissolved and measured in four different sessions (on four different days) shows that the results are robust, providing that samples are measured within 2 h after dissolution. 4.2
Foraminiferal I / Ca ratios as a redox proxy
Our results indicate that I / Ca ratios in benthic foraminifera might prove to be a valuable proxy for oxygen in the adjacent waters. This is supported by the observation that all analysed species show a positive correlation for the I / Ca–[O2 ]BW www.biogeosciences.net/11/7077/2014/
N. Glock et al.: I / Ca ratios in benthic foraminifera from the Peruvian oxygen minimum zone relationship. For two of three species, the correlations are significant (one even highly significant). Only the aragonitic species H. elegans shows no significant correlation. The fact that P. limbata, which lives epifaunal, shows much higher I / Ca ratios than the other two calcitic infaunal species also supports the trend of higher I / Ca ratios under elevated oxygenation: oxygen concentrations are typically higher in the bottom waters compared to the pore waters. In general, our results support and confirm the earlier observations and conclusions of Lu et al. (2010). Furthermore, the variability of foraminiferal I / Ca ratios by location (e.g. [O2 ]BW ) or species is much higher than the uncertainties discussed in Sect. 4.1, which indicates that the trends in the I / Ca– [O2 ]BW relationships are robust with respect to the technical issues. Nevertheless, there are some pitfalls which must be considered in this discussion. The importance of methodological issues has been discussed separately above. Another important point is the high variability of I / Ca ratios between different samples of the same location in some species, which is further amplified by analytical uncertainties. The amount of foraminifera available for analysis is often limited in geological samples. Thus, if monospecific samples are analysed, the number is often limited to one sample. Additionally, the number of measurements of such a sample is limited by the volume of sample solution consumed by the mass spectrometer and the circumstance that a constant concentration of 50 ppm Ca is needed to minimise matrix-related drifts and to consider enough iodine for the analyses. Consequently, some samples are limited to one analysis. Furthermore, the fact that we observe a strong species dependency of the I / Ca ratio accentuates this problem, because the use of bulk species samples which would provide enough material for a sufficient number of analyses might influence the results. The I / Ca ratio of U. striata is twice as high when compared to U. peregrina from the same location. Both species live shallow infaunal, belong to the same genus, and in general have similar morphologies. This difference might either be related to a strong vital effect or to a species-dependent difference in calcification depths. Oxygen gradients in the pore waters of a comparable OMZ off Pakistan are quite steep under suboxic conditions (Bogus et al., 2012), and IO− 3 probably follows this gradient. Thus, a difference in calcification depth might have a severe influence on the I / Ca ratio. These results suggest that a careful distinction of the analysed species is essential for the application of this proxy, at least for the infaunal species. Nevertheless, since the species dependency of I / Ca ratios appears to be higher than the oxygenation dependency, bulk analyses might provide information about oxygenation in a different way: the species composition of a foraminiferal assemblage is often oxygen dependent (Bernhard, 1986; Sen Gupta and Machain-Castello, 1993; Bernhard and Sen Gupta, 1999; Mallon et al., 2012). Thus, bulk I / Ca ratios might be domi-
www.biogeosciences.net/11/7077/2014/
7085
nated by the species composition, which is affected by oxygen availability. Furthermore, the variability of samples from the same location seems also to be strongly species dependent. The epifaunal species P. limbata has a much higher variability in the I / Ca ratio (22.80 %) than the infaunal species U. striata (6.68 %) from the same location (M77-1-487/MUC-38; see Table 5). This is unexpected, because infaunal species are supposed to migrate vertically in the sediment column following the chemical gradients (especially oxygen penetration) in the surrounding pore waters strongly varying within a few millimetres. According to the TROX model, the living depth of infaunal benthic foraminifera is controlled by the availability of food (e.g. organic matter) and the oxygen penetration depth (Jorisson et al., 1995). In a eutrophic environment like the Peruvian OMZ, where organic matter is available in excess, the living depth is mostly controlled by oxygen availability (Mallon et al., 2012). On the contrary, the epifaunal species do not have the possibility of migrating into the pore waters, and are directly exposed to changing bottom water conditions, while the infaunal species might compensate for changing conditions by migration. It is also possible that the smaller numbers of specimens in the analysed assemblages (6 for P. limbata, 10–20 for U. striata) might explain the difference. The inter-test variability of Mg / Ca ratios for example can be very high within one sample (Sadekov et al., 2008). Thus, the uncertainty of palaeotemperature estimates using Mg / Ca ratios can be decreased by using a higher number of specimens for each analysis (Anand and Elderfield, 2005). In general, due to the steep chemical gradients in the pore waters mentioned above, epifaunal species might be more suitable for oxygen reconstructions, because they should directly represent bottom water conditions not influenced by the microhabitat in the pore waters. Nevertheless, this might require the use of a higher number of specimens for the I / Ca analyses to reduce uncertainties due to inter-test variability, which again would require more sampling material. The strong inter-test variability might indeed be related to real changes in oxygenation of the habitat, since there are strong seasonal fluctuations in the magnitude of the OMZ (Paulmier and Ruiz-Pino, 2009). Regarding these issues, samples have to be carefully prepared and measured, or foraminiferal I / Ca ratios might be considered more a qualitative to semiquantitative proxy at this stage. Finally, the aragonitic epifaunal species H. elegans shows no significant I / Ca–[O2 ]BW correlation. Additionally, this species has the lowest I / Ca ratios, although it lives epifaunal and has aragonitic tests (all our aragonite standards showed much higher I / Ca ratios than all the calcite samples analysed). Dissolution and recrystallisation of metastable aragonite can already occur during the earliest sedimentation stages, as shown by studies in the Bahama Banks (Hover et al., 2001; Rosenthal et al., 2006). Thus, although the analysed H. elegans specimens originate from recent core top
Biogeosciences, 11, 7077–7095, 2014
7086
N. Glock et al.: I / Ca ratios in benthic foraminifera from the Peruvian oxygen minimum zone
samples, they might already be influenced by diagenesis; recrystallised test portions may have altered I / Ca ratios. 5
Summary and conclusions
We provide cleaning protocols and a method to measure I / Ca ratios in benthic foraminifera. Due to its volatility, iodine is lost in measurable amounts already 1 day after dissolution, although TMAH was used to trap the iodine. Nevertheless, our results show that this effect is negligible if the samples are measured within 2 h after dissolution. The I / Ca ratios of different Uvigerina striata samples from the same location and two different aragonitic coral standards are well reproducible in different measurement sessions, given that the samples are measured within 2 h after dissolution (JCp1: n = 60; 1σ = 2.0 %; lab-internal aragonitic coral standard: n = 52; 1σ = 3.5 %; U. striata: n = 28, 1σ = 6.6 %). Thus, the measurement of the samples within a short time after dissolution is essential.
Biogeosciences, 11, 7077–7095, 2014
There is a strong inter-species variability of I / Ca ratios in two infaunal species from the same location, which indicates either a strong vital effect or slight species-dependent differences in the calcification depth of these species. All analysed species show a trend of positive I / Ca correlations with [O2 ]BW . This correlation is significant for two calcitic species (even highly significant for U. striata), and not significant for the aragonitic species Hoeglundina elegans, which shows relatively low I / Ca ratios in general. The most promising of the analysed species is U. striata (I / Ca = 0.0324(±0.004) × [O2 ]BW +0.285(±0.026), R 2 = 0.608, F = 75.38, P < 0.0001). This is surprising, since U. striata is living infaunal, and thus migrates vertically in the sediment column, undergoing a variety of oxygen and thus IO− 3 concentrations over its lifetime. When samples are carefully prepared and measured, accounting for the pitfalls outlined here, the resulting I / Ca ratios from benthic foraminifera are considered to be a promising proxy for redox conditions in the ambient water mass.
www.biogeosciences.net/11/7077/2014/
N. Glock et al.: I / Ca ratios in benthic foraminifera from the Peruvian oxygen minimum zone
7087
Appendix A
Table A1. I / Ca ratios and precisions for the single measurements of the internal reference standards. All measurements for the internal calcite reference standard (n = 70) were below the detection limit, and are not listed in this table. Reference standard Aragonite Aragonite Aragonite Aragonite Aragonite Aragonite Aragonite Aragonite Aragonite Aragonite Aragonite Aragonite Aragonite Aragonite Aragonite Aragonite Aragonite Aragonite Aragonite Aragonite Aragonite Aragonite Aragonite Aragonite Aragonite Aragonite Aragonite Aragonite Aragonite Aragonite Aragonite Aragonite Aragonite Aragonite Aragonite Aragonite Aragonite Aragonite Aragonite Aragonite Aragonite Aragonite Aragonite Aragonite Aragonite Aragonite Aragonite Aragonite Aragonite Aragonite Aragonite Aragonite Aragonite
www.biogeosciences.net/11/7077/2014/
I / Ca (µmol mol−1 )
Precision (1σ )
Date of measurement
2.42 2.40 2.44 2.43 2.45 2.44 2.47 2.46 2.64 2.66 2.58 2.57 2.54 2.56 2.57 2.57 2.54 2.55 2.53 2.56 2.60 2.62 2.65 2.62 2.52 2.54 2.44 2.52 2.58 2.55 2.48 2.50 2.56 2.58 2.63 2.63 2.60 2.58 2.59 2.59 2.60 2.57 2.57 2.57 2.51 2.62 2.70 2.71 2.65 2.67 2.65 2.63 2.63
1.63 % 1.53 % 2.00 % 1.00 % 1.38 % 1.30 % 1.75 % 1.08 % 1.02 % 1.13 % 1.43 % 1.04 % 1.61 % 1.53 % 1.68 % 1.63 % 1.36 % 1.37 % 1.86 % 1.40 % 1.23 % 1.28 % 1.05 % 0.90 % 0.91 % 1.01 % 1.97 % 1.68 % 1.59 % 1.36 % 1.37 % 2.09 % 2.28 % 2.42 % 2.10 % 2.26 % 1.33 % 1.06 % 1.70 % 1.22 % 1.15 % 1.29 % 1.46 % 1.26 % 8.35 % 1.55 % 1.26 % 1.25 % 1.51 % 1.20 % 1.49 % 1.26 % 1.35 %
19 Nov 2013 19 Nov 2013 19 Nov 2013 19 Nov 2013 19 Nov 2013 19 Nov 2013 19 Nov 2013 19 Nov 2013 20 Nov 2013 20 Nov 2013 20 Nov 2013 20 Nov 2013 20 Nov 2013 20 Nov 2013 20 Nov 2013 20 Nov 2013 20 Nov 2013 20 Nov 2013 20 Nov 2013 20 Nov 2013 20 Nov 2013 20 Nov 2013 21 Nov 2013 21 Nov 2013 21 Nov 2013 21 Nov 2013 21 Nov 2013 21 Nov 2013 21 Nov 2013 21 Nov 2013 21 Nov 2013 21 Nov 2013 21 Nov 2013 21 Nov 2013 21 Nov 2013 21 Nov 2013 21 Nov 2013 21 Nov 2013 22 Nov 2013 22 Nov 2013 22 Nov 2013 22 Nov 2013 22 Nov 2013 22 Nov 2013 22 Nov 2013 22 Nov 2013 22 Nov 2013 22 Nov 2013 22 Nov 2013 22 Nov 2013 22 Nov 2013 22 Nov 2013 22 Nov 2013
Biogeosciences, 11, 7077–7095, 2014
7088
N. Glock et al.: I / Ca ratios in benthic foraminifera from the Peruvian oxygen minimum zone
Table A1. Continued. Reference standard Aragonite Aragonite Aragonite Aragonite Aragonite Aragonite Aragonite Aragonite Aragonite Aragonite Aragonite Aragonite Aragonite Aragonite Aragonite Aragonite Aragonite JCp-1 (no treatment) JCp-1 (no treatment) JCp-1 (no treatment) JCp-1 (no treatment) JCp-1 (no treatment) JCp-1 (no treatment) JCp-1 (no treatment) JCp-1 (no treatment) JCp-1 (no treatment) JCp-1 (no treatment) JCp-1 (no treatment) JCp-1 (no treatment) JCp-1 (no treatment) JCp-1 (no treatment) JCp-1 (no treatment) JCp-1 (no treatment) JCp-1 (no treatment) JCp-1 (no treatment) JCp-1 (no treatment) JCp-1 (no treatment) JCp-1 (no treatment) JCp-1 (no treatment) JCp-1 (no treatment) JCp-1 (no treatment) JCp-1 (no treatment) JCp-1 (no treatment) JCp-1 (no treatment) JCp-1 (no treatment) JCp-1 (no treatment) JCp-1 (no treatment) JCp-1 (no treatment) JCp-1 (no treatment) JCp-1 (no treatment) JCp-1 (no treatment) JCp-1 (no treatment) JCp-1 (no treatment) JCp-1 (no treatment) JCp-1 (no treatment) JCp-1 (no treatment) JCp-1 (no treatment) JCp-1 (no treatment) JCp-1 (no treatment)
Biogeosciences, 11, 7077–7095, 2014
I / Ca (µmol mol−1 )
Precision (1σ )
Date of measurement
2.63 2.72 2.76 2.70 2.69 2.71 2.61 2.65 2.68 2.64 2.73 2.65 2.67 2.66 2.70 2.63 2.66 2.42 2.40 2.44 2.43 2.45 2.44 2.47 2.46 2.64 2.66 2.58 2.57 2.54 2.56 2.57 2.57 2.54 2.55 2.53 2.56 2.60 2.62 2.65 2.62 2.52 2.54 2.44 2.52 2.58 2.55 2.48 2.50 2.56 2.58 2.63 2.63 2.60 2.58 2.59 2.59 2.60 2.57
0.94 % 1.03 % 1.29 % 1.75 % 1.20 % 1.67 % 1.41 % 1.26 % 0.76 % 1.13 % 1.72 % 1.09 % 1.18 % 2.26 % 2.28 % 2.63 % 1.53 % 0.80 % 3.25 % 0.69 % 1.90 % 1.81 % 0.70 % 1.24 % 1.01 % 1.77 % 3.51 % 1.69 % 1.46 % 1.54 % 1.38 % 1.52 % 1.74 % 1.46 % 1.16 % 0.82 % 1.04 % 1.41 % 1.03 % 1.70 % 1.03 % 1.35 % 1.59 % 1.60 % 1.61 % 1.77 % 2.82 % 1.46 % 0.81 % 1.39 % 1.31 % 1.43 % 1.34 % 1.76 % 1.36 % 1.97 % 1.68 % 1.64 % 1.52 %
22 Nov 2013 25 Nov 2013 25 Nov 2013 25 Nov 2013 25 Nov 2013 25 Nov 2013 25 Nov 2013 25 Nov 2013 25 Nov 2013 25 Nov 2013 25 Nov 2013 25 Nov 2013 25 Nov 2013 25 Nov 2013 25 Nov 2013 25 Nov 2013 25 Nov 2013 15 Nov 2013 15 Nov 2013 15 Nov 2013 15 Nov 2013 15 Nov 2013 15 Nov 2013 15 Nov 2013 15 Nov 2013 15 Nov 2013 15 Nov 2013 15 Nov 2013 15 Nov 2013 15 Nov 2013 15 Nov 2013 15 Nov 2013 15 Nov 2013 15 Nov 2013 15 Nov 2013 15 Nov 2013 15 Nov 2013 15 Nov 2013 15 Nov 2013 15 Nov 2013 15 Nov 2013 15 Nov 2013 15 Nov 2013 15 Nov 2013 15 Nov 2013 15 Nov 2013 15 Nov 2013 18 Nov 2013 18 Nov 2013 18 Nov 2013 18 Nov 2013 18 Nov 2013 18 Nov 2013 18 Nov 2013 18 Nov 2013 18 Nov 2013 18 Nov 2013 18 Nov 2013 18 Nov 2013
www.biogeosciences.net/11/7077/2014/
N. Glock et al.: I / Ca ratios in benthic foraminifera from the Peruvian oxygen minimum zone
7089
Table A1. Continued. Reference standard JCp-1 (no treatment) JCp-1 (no treatment) JCp-1 (no treatment) JCp-1 (no treatment) JCp-1 (no treatment) JCp-1 (no treatment) JCp-1 (no treatment) JCp-1 (no treatment) JCp-1 (no treatment) JCp-1 (no treatment) JCp-1 (no treatment) JCp-1 (no treatment) JCp-1 (no treatment) JCp-1 (no treatment) JCp-1 (no treatment) JCp-1 (no treatment) JCp-1 (no treatment) JCp-1 (no treatment) JCp-1 (no treatment) JCp-1 (no treatment) JCp-1 (no treatment) JCp-1 (no treatment) JCp-1 (no treatment) JCp-1 (no treatment) JCp-1 (no treatment) JCp-1 (no treatment) JCp-1 (no treatment) JCp-1 (no treatment) JCp-1 (no treatment) JCp-1 (no treatment) JCp-1 (no treatment) JCp-1 (no treatment) JCp-1 (no treatment) JCp-1 (no treatment) JCp-1 (no treatment) JCp-1 (no treatment) JCp-1 (no treatment) JCp-1 (no treatment) JCp-1 (no treatment) JCp-1 (no treatment) JCp-1 (no treatment) JCp-1 (no treatment) JCp-1 (no treatment) JCp-1 (no treatment) JCp-1 (no treatment) JCp-1 (no treatment) JCp-1 (no treatment) JCp-1 (no treatment) JCp-1 (no treatment) JCp-1 (no treatment) JCp-1 (no treatment) JCp-1 (no treatment) JCp-1 (no treatment)
www.biogeosciences.net/11/7077/2014/
I / Ca (µmol mol−1 )
Precision (1σ )
Date of measurement
2.57 2.57 2.51 2.62 2.70 2.71 2.65 2.67 2.65 2.63 2.63 2.63 2.72 2.76 2.70 2.69 2.71 2.61 2.65 2.68 2.64 2.73 2.65 2.67 2.66 2.70 2.63 2.66 4.29 12.67 5.32 5.17 5.18 4.20 4.41 4.43 5.23 4.87 4.15 4.06 4.13 4.53 4.34 4.10 4.01 4.12 4.20 4.07 4.10 4.13 4.07 3.99 3.97
2.07 % 1.13 % 1.44 % 1.29 % 2.16 % 2.38 % 0.74 % 1.54 % 3.46 % 1.52 % 1.06 % 1.45 % 1.14 % 1.21 % 1.75 % 1.59 % 0.99 % 0.87 % 1.34 % 1.36 % 0.95 % 1.96 % 1.33 % 1.61 % 1.14 % 0.79 % 1.25 % 1.84 % 1.47 % 1.10 % 1.09 % 1.75 % 1.40 % 1.04 % 1.35 % 1.61 % 1.16 % 1.36 % 0.70 % 2.03 % 1.94 % 1.40 % 1.04 % 1.17 % 2.15 % 2.20 % 1.09 % 1.22 % 0.62 % 4.96 % 1.16 % 0.85 % 1.72 %
18 Nov 2013 18 Nov 2013 18 Nov 2013 18 Nov 2013 18 Nov 2013 18 Nov 2013 19 Nov 2013 19 Nov 2013 19 Nov 2013 19 Nov 2013 19 Nov 2013 19 Nov 2013 19 Nov 2013 19 Nov 2013 19 Nov 2013 19 Nov 2013 19 Nov 2013 19 Nov 2013 19 Nov 2013 19 Nov 2013 19 Nov 2013 19 Nov 2013 19 Nov 2013 19 Nov 2013 20 Nov 2013 20 Nov 2013 20 Nov 2013 20 Nov 2013 20 Nov 2013 20 Nov 2013 20 Nov 2013 20 Nov 2013 20 Nov 2013 20 Nov 2013 20 Nov 2013 20 Nov 2013 20 Nov 2013 20 Nov 2013 20 Nov 2013 20 Nov 2013 20 Nov 2013 20 Nov 2013 20 Nov 2013 20 Nov 2013 20 Nov 2013 20 Nov 2013 20 Nov 2013 20 Nov 2013 21 Nov 2013 21 Nov 2013 21 Nov 2013 21 Nov 2013 21 Nov 2013
Biogeosciences, 11, 7077–7095, 2014
7090
N. Glock et al.: I / Ca ratios in benthic foraminifera from the Peruvian oxygen minimum zone
Table A1. Continued. Reference standard JCp-1 (no treatment) JCp-1 (no treatment) JCp-1 (no treatment) JCp-1 (no treatment) JCp-1 (no treatment) JCp-1 (no treatment) JCp-1 (no treatment) JCp-1 (no treatment) JCp-1 (no treatment) JCp-1 (no treatment) JCp-1 (no treatment) JCp-1 (homogenised) JCp-1 (homogenised) JCp-1 (homogenised) JCp-1 (homogenised) JCp-1 (homogenised) JCp-1 (homogenised) JCp-1 (homogenised) JCp-1 (homogenised) JCp-1 (homogenised) JCp-1 (homogenised) JCp-1 (homogenised) JCp-1 (homogenised) JCp-1 (homogenised) JCp-1 (homogenised) JCp-1 (homogenised) JCp-1 (homogenised) JCp-1 (homogenised) JCp-1 (homogenised) JCp-1 (homogenised) JCp-1 (homogenised) JCp-1 (homogenised) JCp-1 (homogenised) JCp-1 (homogenised) JCp-1 (homogenised) JCp-1 (homogenised) JCp-1 (homogenised) JCp-1 (homogenised) JCp-1 (homogenised) JCp-1 (homogenised) JCp-1 (homogenised) JCp-1 (homogenised) JCp-1 (homogenised) JCp-1 (homogenised) JCp-1 (homogenised) JCp-1 (homogenised) JCp-1 (homogenised) JCp-1 (homogenised) JCp-1 (homogenised) JCp-1 (homogenised) JCp-1 (homogenised) JCp-1 (homogenised) JCp-1 (homogenised) JCp-1 (homogenised) JCp-1 (homogenised) JCp-1 (homogenised) JCp-1 (homogenised) JCp-1 (homogenised) JCp-1 (homogenised)
Biogeosciences, 11, 7077–7095, 2014
I / Ca (µmol mol−1 )
Precision (1σ )
Date of measurement
4.09 4.05 4.08 3.84 3.79 5.02 4.31 4.24 5.02 4.36 4.30 4.74 4.14 4.23 4.97 4.19 4.20 4.98 4.23 4.22 4.99 4.35 4.42 3.74 3.63 3.55 3.64 3.56 3.53 3.53 3.49 3.58 3.50 3.52 3.54 3.49 3.51 3.48 3.51 3.56 3.57 3.86 3.73 3.80 3.59 3.56 3.58 3.51 3.51 3.47 3.59 3.51 3.50 3.57 3.52 3.63 3.54 3.63 3.58
0.98 % 1.57 % 1.65 % 1.28 % 1.56 % 2.17 % 1.85 % 1.93 % 1.93 % 1.18 % 0.89 % 1.50 % 0.83 % 1.28 % 1.46 % 1.39 % 1.20 % 2.34 % 2.28 % 1.91 % 1.96 % 0.73 % 0.76 % 1.29 % 1.02 % 1.52 % 1.07 % 1.55 % 1.33 % 1.17 % 1.35 % 1.90 % 2.36 % 1.39 % 0.60 % 0.89 % 1.10 % 1.05 % 0.60 % 1.33 % 1.57 % 0.88 % 0.97 % 0.78 % 3.65 % 1.33 % 1.31 % 0.79 % 0.81 % 1.74 % 1.35 % 0.89 % 0.97 % 1.21 % 1.01 % 1.16 % 0.49 % 1.54 % 0.75 %
21 Nov 2013 21 Nov 2013 21 Nov 2013 21 Nov 2013 21 Nov 2013 21 Nov 2013 21 Nov 2013 21 Nov 2013 21 Nov 2013 21 Nov 2013 21 Nov 2013 21 Nov 2013 21 Nov 2013 21 Nov 2013 21 Nov 2013 21 Nov 2013 21 Nov 2013 21 Nov 2013 21 Nov 2013 21 Nov 2013 21 Nov 2013 21 Nov 2013 21 Nov 2013 22 Nov 2013 22 Nov 2013 22 Nov 2013 22 Nov 2013 22 Nov 2013 22 Nov 2013 22 Nov 2013 22 Nov 2013 22 Nov 2013 22 Nov 2013 22 Nov 2013 22 Nov 2013 22 Nov 2013 22 Nov 2013 22 Nov 2013 22 Nov 2013 22 Nov 2013 22 Nov 2013 22 Nov 2013 22 Nov 2013 22 Nov 2013 22 Nov 2013 22 Nov 2013 22 Nov 2013 25 Nov 2013 25 Nov 2013 25 Nov 2013 25 Nov 2013 25 Nov 2013 25 Nov 2013 25 Nov 2013 25 Nov 2013 25 Nov 2013 25 Nov 2013 25 Nov 2013 25 Nov 2013
www.biogeosciences.net/11/7077/2014/
N. Glock et al.: I / Ca ratios in benthic foraminifera from the Peruvian oxygen minimum zone
7091
Table A1. Continued. Reference standard JCp-1 (homogenised) JCp-1 (homogenised) JCp-1 (homogenised) JCp-1 (homogenised) JCp-1 (homogenised) JCp-1 (homogenised) JCp-1 (homogenised) JCp-1 (homogenised) JCp-1 (homogenised) JCp-1 (homogenised) JCp-1 (homogenised) JCp-1 (homogenised)
www.biogeosciences.net/11/7077/2014/
I / Ca (µmol mol−1 )
Precision (1σ )
Date of measurement
3.56 3.53 3.54 3.66 3.67 3.60 3.98 4.02 3.85 3.72 3.68 3.63
1.92 % 0.63 % 1.01 % 1.14 % 1.12 % 0.98 % 1.62 % 1.40 % 1.63 % 1.18 % 1.26 % 1.09 %
25 Nov 2013 25 Nov 2013 25 Nov 2013 25 Nov 2013 25 Nov 2013 25 Nov 2013 25 Nov 2013 25 Nov 2013 25 Nov 2013 25 Nov 2013 25 Nov 2013 25 Nov 2013
Biogeosciences, 11, 7077–7095, 2014
7092
N. Glock et al.: I / Ca ratios in benthic foraminifera from the Peruvian oxygen minimum zone
Table A2. I / Ca ratios and precision for the single measurements of the foraminiferal samples. Bold and italic numbers represent measurements which were done 1 day after the dissolution of the sample. Sample A1 A1 A1 A1 A1 A1 A1 A1 A1 A1 A1 A1 A2 A2 A2 A2 A2 A2 A2 A2 A2 A2 A3 A3 A3 A3 A3 A3 A3 A4 A4 A4 A4 A4 A4 A4 A4 A9 B1 B1 B1 B1 B1 B1 B1 B1 B1 B1 B2 B2 B2 B2 B3 B3 B3
Species
Sampling site
U. striata U. striata U. striata U. striata U. striata U. striata U. striata U. striata U. striata U. striata U. striata U. striata U. striata U. striata U. striata U. striata U. striata U. striata U. striata U. striata U. striata U. striata U. striata U. striata U. striata U. striata U. striata U. striata U. striata U. striata U. striata U. striata U. striata U. striata U. striata U. striata U. striata U. striata U. striata U. striata U. striata U. striata U. striata U. striata U. striata U. striata U. striata U. striata U. striata U. striata U. striata U. striata U. striata U. striata U. striata
M77-1 565/MUC-59 M77-1 565/MUC-59 M77-1 565/MUC-59 M77-1 565/MUC-59 M77-1 565/MUC-59 M77-1 565/MUC-59 M77-1 565/MUC-59 M77-1 565/MUC-59 M77-1 565/MUC-59 M77-1 565/MUC-59 M77-1 565/MUC-59 M77-1 565/MUC-59 M77-1 565/MUC-59 M77-1 565/MUC-59 M77-1 565/MUC-59 M77-1 565/MUC-59 M77-1 565/MUC-59 M77-1 565/MUC-59 M77-1 565/MUC-59 M77-1 565/MUC-59 M77-1 565/MUC-59 M77-1 565/MUC-59 M77-1 565/MUC-59 M77-1 565/MUC-59 M77-1 565/MUC-59 M77-1 565/MUC-59 M77-1 565/MUC-59 M77-1 565/MUC-59 M77-1 565/MUC-59 M77-1 565/MUC-59 M77-1 565/MUC-59 M77-1 565/MUC-59 M77-1 565/MUC-59 M77-1 565/MUC-59 M77-1 565/MUC-59 M77-1 565/MUC-59 M77-1 565/MUC-59 M77-1 565/MUC-59 M77-1 487/MUC-38 M77-1 487/MUC-38 M77-1 487/MUC-38 M77-1 487/MUC-38 M77-1 487/MUC-38 M77-1 487/MUC-38 M77-1 487/MUC-38 M77-1 487/MUC-38 M77-1 487/MUC-38 M77-1 487/MUC-38 M77-1 487/MUC-38 M77-1 487/MUC-38 M77-1 487/MUC-38 M77-1 487/MUC-38 M77-1 487/MUC-38 M77-1 487/MUC-38 M77-1 487/MUC-38
Biogeosciences, 11, 7077–7095, 2014
I / Ca (mmol mol−1 )
Precision (1σ )
Date of measurement
0.58 0.56 0.56 0.53 0.50 0.52 0.47 0.49 0.51 0.51 0.49 0.60 0.62 0.61 0.60 0.59 0.56 0.55 0.54 0.53 0.55 0.52 0.53 0.51 0.50 0.48 0.52 0.52 0.51 0.53 0.52 0.53 0.52 0.53 0.52 0.52 0.54 0.51 0.47 0.44 0.40 0.41 0.35 0.32 0.38 0.36 0.36 0.33 0.37 0.35 0.35 0.33 0.51 0.51 0.47
1.69 % 0.98 % 1.59 % 1.90 % 1.31 % 1.24 % 3.39 % 3.68 % 3.97 % 3.85 % 7.45 % 17.95 % 1.35 % 0.96 % 1.32 % 1.42 % 1.39 % 1.32 % 2.80 % 3.13 % 3.47 % 3.46 % 1.96 % 2.40 % 3.08 % 2.96 % 2.42 % 2.17 % 2.05 % 1.85 % 2.43 % 3.90 % 3.74 % 2.25 % 1.74 % 3.19 % 3.12 % 4.38 % 1.86 % 2.15 % 3.06 % 2.98 % 4.70 % 4.37 % 5.24 % 4.91 % 4.71 % 5.24 % 2.43 % 3.71 % 2.78 % 2.29 % 2.24 % 3.78 % 3.36 %
19 Nov 2013 19 Nov 2013 19 Nov 2013 19 Nov 2013 19 Nov 2013 19 Nov 2013 20 Nov 2013 20 Nov 2013 20 Nov 2013 20 Nov 2013 20 Nov 2013 20 Nov 2013 19 Nov 2013 19 Nov 2013 19 Nov 2013 19 Nov 2013 19 Nov 2013 19 Nov 2013 20 Nov 2013 20 Nov 2013 20 Nov 2013 20 Nov 2013 21 Nov 2013 21 Nov 2013 21 Nov 2013 21 Nov 2013 21 Nov 2013 21 Nov 2013 21 Nov 2013 22 Nov 2013 22 Nov 2013 22 Nov 2013 22 Nov 2013 22 Nov 2013 22 Nov 2013 22 Nov 2013 22 Nov 2013 25 Nov 2013 19 Nov 2013 19 Nov 2013 19 Nov 2013 19 Nov 2013 20 Nov 2013 20 Nov 2013 20 Nov 2013 20 Nov 2013 20 Nov 2013 20 Nov 2013 21 Nov 2013 21 Nov 2013 21 Nov 2013 21 Nov 2013 22 Nov 2013 22 Nov 2013 22 Nov 2013
www.biogeosciences.net/11/7077/2014/
N. Glock et al.: I / Ca ratios in benthic foraminifera from the Peruvian oxygen minimum zone
7093
Table A2. Continued. Sample B3 C1 C1 C2 C2 C2 C2 F1 G1 H2 A5 A5 A5 A6 A6 A6 A7 A7 A8 A10 B4 B4 B4 B5 B5 B6 D1 E1 B7 B7 B7 B7 B7 B8 B8 B8 B8 B8 B8 B8 C3 C3 C3 C3 C3 C3 C3 C3 C4 C4 C4 C4 C4 C4 C4 C4 J1 H1 J2
Species
Sampling site
U. striata U. striata U. striata U. striata U. striata U. striata U. striata U. striata U. striata U. striata P. limbata P. limbata P. limbata P. limbata P. limbata P. limbata P. limbata P. limbata P. limbata P. limbata P. limbata P. limbata P. limbata P. limbata P. limbata P. limbata P. limbata P. limbata H. elegans H. elegans H. elegans H. elegans H. elegans H. elegans H. elegans H. elegans H. elegans H. elegans H. elegans H. elegans H. elegans H. elegans H. elegans H. elegans H. elegans H. elegans H. elegans H. elegans H. elegans H. elegans H. elegans H. elegans H. elegans H. elegans H. elegans H. elegans H. elegans U. peregrina U. peregrina
M77-1 487/MUC-38 M77-1 455/MUC-21 M77-1 455/MUC-21 M77-1 455/MUC-21 M77-1 455/MUC-21 M77-1 455/MUC-21 M77-1 455/MUC-21 M77-2 47-3 M77-1 516/MUC-40 M77-1 459/MUC-25 M77-1 565/MUC-59 M77-1 565/MUC-59 M77-1 565/MUC-59 M77-1 565/MUC-59 M77-1 565/MUC-59 M77-1 565/MUC-59 M77-1 565/MUC-59 M77-1 565/MUC-59 M77-1 565/MUC-59 M77-1 565/MUC-59 M77-1 487/MUC-38 M77-1 487/MUC-38 M77-1 487/MUC-38 M77-1 487/MUC-38 M77-1 487/MUC-38 M77-1 487/MUC-38 M77-1 553/MUC-54 M77-1 406/MUC-06 M77-1 487/MUC-38 M77-1 487/MUC-38 M77-1 487/MUC-38 M77-1 487/MUC-38 M77-1 487/MUC-38 M77-1 487/MUC-38 M77-1 487/MUC-38 M77-1 487/MUC-38 M77-1 487/MUC-38 M77-1 487/MUC-38 M77-1 487/MUC-38 M77-1 487/MUC-38 M77-1 455/MUC-21 M77-1 455/MUC-21 M77-1 455/MUC-21 M77-1 455/MUC-21 M77-1 455/MUC-21 M77-1 455/MUC-21 M77-1 455/MUC-21 M77-1 455/MUC-21 M77-1 455/MUC-21 M77-1 455/MUC-21 M77-1 455/MUC-21 M77-1 455/MUC-21 M77-1 455/MUC-21 M77-1 455/MUC-21 M77-1 455/MUC-21 M77-1 455/MUC-21 M77-1 604/MUC-74 M77-1 459/MUC-25 M77-1 604/MUC-74
www.biogeosciences.net/11/7077/2014/
I / Ca (mmol mol−1 )
Precision (1σ )
Date of measurement
0.48 0.28 0.34 0.33 0.34 0.31 0.33 0.41 0.57 0.91 1.38 1.19 1.00 1.21 1.16 0.94 1.19 1.20 1.32 1.13 1.07 1.03 0.88 1.43 1.31 1.77 1.34 2.20 0.13 0.12 0.11 0.13 0.10 0.13 0.12 0.14 0.13 0.12 0.14 0.13 0.31 0.23 0.24 0.22 0.27 0.23 0.26 0.24 0.14 0.12 0.14 0.13 0.13 0.13 0.13 0.12 0.29 0.40 0.48
3.70 % 3.14 % 4.29 % 3.23 % 5.14 % 3.79 % 4.93 % 4.47 % 3.13 % 2.35 % 2.57 % 2.56 % 1.74 % 1.55 % 1.36 % 2.10 % 1.99 % 1.69 % 2.61 % 2.20 % 1.54 % 2.18 % 3.08 % 1.40 % 2.01 % 1.25 % 1.99 % 1.28 % 4.49 % 9.13 % 13.40 % 13.13 % 17.23 % 7.06 % 6.79 % 9.42 % 5.62 % 5.51 % 4.44 % 4.64 % 7.27 % 4.55 % 5.37 % 6.46 % 5.58 % 3.57 % 3.18 % 3.24 % 4.57 % 3.80 % 12.25 % 12.97 % 6.72 % 6.24 % 10.51 % 12.16 % 5.87 % 4.87 % 3.55 %
22 Nov 2013 21 Nov 2013 21 Nov 2013 22 Nov 2013 22 Nov 2013 22 Nov 2013 22 Nov 2013 25 Nov 2013 25 Nov 2013 25 Nov 2013 19 Nov 2013 19 Nov 2013 20 Nov 2013 19 Nov 2013 19 Nov 2013 20 Nov 2013 21 Nov 2013 21 Nov 2013 22 Nov 2013 25 Nov 2013 19 Nov 2013 19 Nov 2013 20 Nov 2013 22 Nov 2013 22 Nov 2013 22 Nov 2013 25 Nov 2013 25 Nov 2013 19 Nov 2013 19 Nov 2013 20 Nov 2013 20 Nov 2013 20 Nov 2013 21 Nov 2013 21 Nov 2013 21 Nov 2013 21 Nov 2013 21 Nov 2013 21 Nov 2013 21 Nov 2013 22 Nov 2013 22 Nov 2013 22 Nov 2013 22 Nov 2013 22 Nov 2013 22 Nov 2013 22 Nov 2013 22 Nov 2013 22 Nov 2013 22 Nov 2013 22 Nov 2013 22 Nov 2013 22 Nov 2013 22 Nov 2013 22 Nov 2013 22 Nov 2013 25 Nov 2013 25 Nov 2013 25 Nov 2013
Biogeosciences, 11, 7077–7095, 2014
7094
N. Glock et al.: I / Ca ratios in benthic foraminifera from the Peruvian oxygen minimum zone
Acknowledgements. The scientific party on R/V Meteor cruise M77 is acknowledged for their general support and advice in multicorer operation and sampling. The cleaning procedures were done in the clean lab of Dirk Nürnberg, while Nadine Gehre always gave support when problems occurred in this lab. The same applies to Ana Kolevica for her support in the Quadrupole-MS lab. Jutta Heinze is acknowledged for providing the lab-internal aragonitic coral standard and the homogenised JCp-1. Thanks to Joachim Schönfeld for fruitful general discussions and help with taxonomic issues, and Stefan Sommer, Richard Camilli and Thomas Mosch for handling of the CTD during the ship cruise (M77-1). Furthermore, we thank Jelle Bijma and Zunli Lu, whose comments improved the previous version of this manuscript considerably. The Deutsche Forschungsgemeinschaft (DFG) provided funding through SFB 754 “Climate – Biogeochemistry Interactions in the Tropical Ocean”. Furthermore, we would like to thank Tyler Goepfert for doing a native check on this manuscript. Edited by: H. Kitazato
References Anand, P. and Elderfield, H.: Variability of Mg / Ca and Sr/Ca between and within the planktonic foraminifers Globigerina bulloides and Globorotalia truncatulinoides, Geochem. Geophys. Geosyst., 6, Q11D15, doi:10.1029/2004GC000811, 2005. Baturin, G. N.: Some unique sedimentological and geochemical features of deposits in coastal upwelling regions, in: Coastal upwelling – its sediment record, Part B: Sedimentary records of ancient coastal upwelling, edited by: Suess, E. and Thiede, J., Plenum Press, NY, 11–27, 1983. Bernhard, J. M.: Characteristic assemblages and morphologies of benthic foraminifera from, anoxic, organic-rich deposits: Jurassic through Holocene, J. Foramin. Res., 16, 207–215, 1986. Bernhard, J. M. and Sen Gupta, B. K.: Foraminifera of oxygendepleted environments, in: Modern Foraminifera, edited by: Sen Gupta, B. K., Kluwer Academic Press, 201–216, 1999. Bogus, K. A., Zonnefeld, K. A. F., Fischer, D., Kasten, S., Bohrmann, G., and Versteegh, G. J. M.: The effect of meter-scale lateral oxygen gradients at the sediment-water interface on selected organic matter based alteration, productivity and temperature proxies, Biogeosciences, 9, 1553–1570, doi:10.5194/bg-91553-2012, 2012. Bopp, L., LeQuere, C., Heimann, M., Manning, A. C., and Monfray, P.: Climate-induced oceanic oxygen fluxes: Implications for the contemporary carbon budget, Global Biogeochem. Cy., 16, 1–16, doi:10.1029/2001GB001445, 2002. Boyle, E. A.: manganese carbonate overgrowths on foraminifera tests, Geochimica et Cosmochimica Acta, 47, 1815, doi:10.1016/0016-7037(83)90029-7, 1983. Boyle, E. A. and Keigwin, L. D.: Comparison of Atlantic and Pacific paleochemical records for the last 215 000 years: Changes in deep ocean circulation and chemical inventories, Earth Plan. Sci. Lett., 76, 135–150, 1985. Brewer, P. G. and Peltzer, E. T.: Limits to marine life, Science, 324, 347–348, 2009.
Biogeosciences, 11, 7077–7095, 2014
Delaney, M. L.: miocene benthic foraminiferal Cd / Ca records: South Atlantic and western Equatorial Pacific, Paleoceanography, 5, 743–760, 1990. Elderfield, H. and Ganssen, G.: Past temperature and δ 18 O of surface ocean waters inferred from foraminiferal Mg / Ca ratios, Nature, 405, 442–445, 2000. FAO FishStat: Fisheries and aquaculture software, FishStat Plus – Universal software for fishery statistical time series, in: FAO Fisheries and Aquaculture Department, Rome, updated 28 November 2013. Farrenkopf, A. M. and Luther G. W.: Iodine chemistry reflects productivity and denitrification in the Arabian Sea: evidence for flux of dissolved species from sediments of western India into the OMZ, Deep-Sea Res. II, 49, 2303–2318, 2002. Fhlaithearta, S. N., Reichart, G.-J., Jorissen, F. J., Fontanier, C., Rehling, E. J., Thomson, J., and De Lange, G. J.: Reconstructing the seafloor environment during sapropel formation using benthic foraminiferal trace metals, stable isotopes, and sediment composition, Paleoceanography, 25, PA4225, doi:10.1029/2009PA001869, 2010. Fréon, P., Barange, M., and Arístegui, J.: Eastern Boundary Upwelling Ecosystems: Integrative and comparative approaches, Prog. Oceanogr., 83, 1–14, 2009. Froelich, P. N., Klinkhammer, G. P., Bender, M. L., Luedtke, N. A., Heath, G. R., Cullen, D., and Dauphin, P.: Early oxidation of organic matter in pelagic sediments of the eastern equatorial Atlantic: suboxic diagenesis, Geochimica et Cosmochimica Acta, 43, 1075–1090, 1979. Glock, N., Eisenhauer, A., Milker, Y., Liebetrau, V., Schönfeld, J., Mallon, J., Sommer, S., and Hensen, C.: Environmental influences on the pore-density in tests of Bolivina spissa, J. Foraminiferal Res., 41, 22–32, 2011. Glock, N., Eisenhauer, A., Liebetrau, V., Wiedenbeck, M., Hensen, C., and Nehrke, G.: EMP and SIMS studies on MN / Ca and Fe/Ca systematics in benthic foraminifera from the Peruvian OMZ: a contribution to the identification of potential redox proxies and the impact of cleaning protocols, Biogeosciences, 9, 341– 359, doi:10.5194/bg-9-341-2012, 2012. Harris, D. C.: Appendix H, in: Quantitative chemical analysis, edited by: Harris, D. C., 6 Edn., New York, W. H. Freeman, p. 296, 2006. Hastings, D. W., Emerson, S., Erez, J., and Nelson, B.K.: Vanadium incorporation in foraminiferal calcite as a paleotracer for seawater vanadium concentrations, Geochimica et Cosmochimica Acta, 19, 3701–3715, 1996a. Hastings, D. W., Emerson, S. E., and Nelson, B.: Determination of picogram quantities of vanadium in foraminiferal calcite and seawater by isotope dilution inductively coupled plasma mass spectrometrwy ith electrothermavla porization, Anal. Chem., 68, 371–378, 1996b. Hastings, D. W., Emerson, S. R., and mix, A. C.: Vanadium in foraminiferal calcite as a tracer for changes in the areal extent of reducing sediments, Paleoceanography, 11, 665–678, 1996c. Hastings, D. W., Russell, A. D., and Emerson, S. R.: Foraminiferal magnesium in Globeriginoides sacculifer as a paleotemperature proxy, Paleoceanography, 13, 161–169, 1998. Hover, V. C., Walter, L. M., and Peacor, D. R.: Early marine diagenesis of biogenic aragonite and Mg-calcite: New constraints from
www.biogeosciences.net/11/7077/2014/
N. Glock et al.: I / Ca ratios in benthic foraminifera from the Peruvian oxygen minimum zone high-resolution STEM and AEM analyses of modern platform carbonates, Chem. Geol., 175, 221–248, 2001. Joos, F., Plattner, G.-K., Stocker, T. F., Körtzinger, A., and Wallace, D. W. R.: Trends in marine dissolved oxygen: Implications for ocean circulation changes and the carbon budget, EOS Trans. AGU, 84, 197–204, 2003. Jorissen, F. J., de Stigter, H. C., and Widmark, J. G. V.: A conceptual model explaining benthic foraminiferal microhabitats, Mar. Micropaleontol., 26, 3–15, 1995. Krahmann, G.: Physical oceanography during mETEOR cruise M77/2, IFM-GEOMAR Leibniz-Institute of marine Sciences, Kiel University, doi:10.1594/PANGAEA.778021. 2012. Küpper, F. C., Feiters, M. C., Olofsson, B., Kaiho, T., Yanagida, S., Zimmermann, M. B., Carpenter, L. J., Luther, G. W., Lu, Z., Jonsson, M., and Kloo, L.: Commemorating Two Centuries of Iodine Research: An Interdisciplinary Overview of Current Research. Angewandte Chemie International Edition, 50, 11598– 11620, 2011. Lea, D. W.: Trace elements in foraminiferal calcite modern Foraminifera, in: Modern Foraminifera, edited by: Sen Gupta, B. K., Kluwer Academic Publishers, New York, Boston, Dordrecht, London, Moscow, 201–216, 2003. Lea, D. W., Mashiotta, T. A., and Spero, H. J.: Controls on magnesium and strontium uptake in planktonic foraminifera determined by live culturing, Geochim. Cosmochim. Acta, 63, 2369–2379, 1999. Lear, C. H., Rosenthal, Y., and Slowey, N.: Benthic foraminiferal Mg / Ca-paleothermometry: A revised coretop calibration, Geochim. Cosmochim. Acta, 66, 3375–3387, 2002. Lu, Z., Jenkyns, H. C., and Rickaby, R. E. M.: Iodine to calcium ratios in marine carbonate as a paleo-redox proxy during oceanic anoxic events, Geology, 38, 1107–1110, 2010. Mallon, J., Glock, N., and Schönfeld, J.: The response of benthic foraminifera to low-oxygen conditions of the Peruvian oxygen minimum zone, in: ANOXIA: Evidence for eukaryote survival and paleontological strategies, Cellular Origin, Life in Extreme Habitats and Astrobiology 21, edited by: Altenbach, A. V., Bernhard, J. M., and Seckbach, J., Springer Science+Business media, 305–321, 2012. Matear, R. J. and Hirst, A. C.: Long-term changes in dissolved oxygen concentation in the ocean caused by protracted global warming, Gobal Biogeochem. Cy., 17, 1125, doi:10.1029/2002GB001997, 2003. Morford, J. L., Emerson, S. R., Breckel, E. J., and Kim, S. H.: Diagenesis of oxyanions (V, U, Re, and mo) in pore water and sediments from a continental margin, Geochimica et Cosmochimica Acta, 69, 5021–5032, 2005. Munsel, D., Kramar, U., Dissard, D., Nehrke, G., Berner, Z., Bijma, J., Reichart, G.-J., and Neumann, T.: Heavy metal incorporation in foraminiferal calcite: results from multi-element enrichment culture experiments with Ammonia tepida, Biogeosciences, 7, 2339–2350, doi:10.5194/bg-7-2339-2010, 2010. Muramatsu, Y. and Wedepohl, K. H.: The distribution of iodine in the earth’s crust, Chem. Geol., 147, 201–216, 1998.
www.biogeosciences.net/11/7077/2014/
7095
Nürnberg, D., Bijma, J., and Hemleben, C.: Assessing the reliability of magnesium in foraminiferal calcite as a proxy for water mass temperatures, Geochimica et Cosmochimica Acta, 60, 803–814, 1996. Ohkouchi, N., Kawahata, H., Murayama, M., Ohkada, M., Nakamura, T., and Taira, A.: Was deep water formed in the North Pacific during the Late Quaternary? Cadmium evidence from the northwest Pacific, Earth Planet. Sci. Lett., 124, 185–194, 1994. Paulmier, A. and Ruiz-Pino, D.: Oxygen minimum zones (OMZs) in the modern ocean, Prog. Oceanogr., 80, 113–128, 2009. Rosenthal, Y., Boyle, E. A., and Slowey, N.: Temperature control on the incorporation of magnesium, strontium, fluorine, and cadmium into benthic foraminiferal shells from Little Bahama Bank: Prospects for thermocline paleoceanography, Geochimica et Cosmochimica Acta, 61, 3633–3643, 1997. Rosenthal, Y., Lear, C. H., Oppo, D. W., and Linsley, B. K.: Temperature and carbonate ion effects on Mg / Ca and Sr / Ca ratios in benthic foraminifera: Aragonitic species Hoeglundina elegans, Paleocanography, 21, 1–14, 2006. Rue, E. L., Smith, G. J., Cutter, G. A., and Bruland, K. W.: The response of trace element redox couples to suboxic conditions in the water column, Deep-Sea Res. Part I, 44, 113–134, 1997. Russell, A. D., Emerson, S., Nelson, B., Erez, J., and Lea, D. W.: Uranium in foraminiferal calcite as a recorder of seawater uranium concentrations, Geochimica et Cosmochimica Acta, 58, 671–681, 1994. Russell, A. D., Hönisch, B., Spero, H. J., and Lea, D. W.: Effects of seawater carbonate ion concentration and temperature on shell U, Mg, and Sr in cultured planktonic foraminifera, Geochimica et Cosmochimica Acta, 68, 4347–4361, 2004. Sadekov, A., Eggins, S. M., De Dekker, P., and Kroon, D.: Uncertainties in seawater thermometry deriving from intratest and intertest Mg / Ca variability in Globigerinoides ruber, Paleoceanography, 23, 1–12, 2008. Sen Gupta, B. K. and Machain-Castillo, M. L.: Benthic foraminifera in oxygen-poor habitats, Mar. Micropaleontol., 20, 3–4, 1993. Stramma, L., Johnson, G. C., Sprintall, J., and Mohrholz, V.: Expanding Oxygen-Minimum Zones in the Tropical Oceans, Science, 320, 655–658, 2008. Truesdale, V. W. and Bailey, G. W.: Dissolved iodate and total iodine during an extreme hypoxic event in the Southern Benguela System, Estuar. Coast. Shelf Sci., 50, 751–760, 2000. Truesdale, V. W., Bale, A. J., and Woodward, E. M. S.: The meridional distribution of dissolved iodine in near-surface waters of the Atlantic Ocean, Prog. Oceanogr., 45, 387–400, 2000. Wolf, A.: Zeitliche Variationen im peruanischen Küstenauftrieb seit dem Letzten Glazialen maximum – Steuerung durch globale Klimadynamik, Dissertation, 2002. Wong, G. T. F. and Brewer, P. G.: marine chemistry of iodine in anoxic basins, Geochimica et Cosmochimica Acta, 41, 151–159, 1977. Yu, J., Elderfield, H., Jin, Z., and Booth, L.: A strong temperature effect on U / Ca in planktonic foraminiferal carbonates, Geochimica et Cosmochimica Acta, 72, 4988–5000, 2008.
Biogeosciences, 11, 7077–7095, 2014