Research Article
2073
Identification of regulators of germ layer morphogenesis using proteomics in zebrafish Vinzenz Link, Lara Carvalho, Irinka Castanon, Petra Stockinger, Andrej Shevchenko and Carl-Philipp Heisenberg* Max Planck Institute of Molecular Cell Biology and Genetics, Pfotenhauerstr.108, 01307 Dresden, Germany *Author for correspondence (e-mail:
[email protected])
Journal of Cell Science
Accepted 8 February 2006 Journal of Cell Science 119, 2073-2083 Published by The Company of Biologists 2006 doi:10.1242/jcs.02928
Summary During vertebrate gastrulation, a well-orchestrated series of morphogenetic changes leads to the formation of the three germ layers: the ectoderm, mesoderm and endoderm. The analysis of gene expression patterns during gastrulation has been central to the identification of genes involved in germ layer formation. However, many proteins are regulated on a translational or post-translational level and are thus undetectable by gene expression analysis. Therefore, we developed a 2D-gel-based comparative proteomic approach to target proteins involved in germ layer morphogenesis during zebrafish gastrulation. Proteomes of ectodermal and mesendodermal progenitor cells were compared and 35 significantly regulated proteins were identified by mass spectrometry, including several proteins with predicted functions in cytoskeletal organization. A comparison of our proteomic results with data obtained in an accompanying microarray-based gene
Introduction The systematic analysis of gene transcription patterns during development has been instrumental in the identification of a large number of candidate genes with potential functions in various developmental processes (reviewed by Stanford et al., 2001). By contrast, proteomic screens have very rarely been used to analyze developmental processes (Gong et al., 2004) despite indications that these approaches are complementary to large scale genomics (reviewed by Hebestreit, 2001; Lopez, 1999; Patton, 1999). Proteomics may be a powerful method to study the downstream effects of signaling pathways on protein modifications. The identification of modifications regulating tissue morphogenesis during development currently poses a major challenge in developmental biology. The first morphogenetic process in the development of most multicellular organisms is gastrulation, during which a seemingly unstructured blastula transforms into a gastrula consisting of distinct germ layers (Stern, 2004). In zebrafish, gastrulation begins with the synchronized ingression of individual mesodermal and endodermal (mesendodermal) progenitor cells at the germ-ring margin, leading to the formation of a bi-layered embryo consisting of epiblast (ectodermal progenitors) and hypoblast (mesendodermal progenitors) (Montero et al., 2005; Warga and Kimmel, 1990). Ingression is followed by progenitor cells of both germ layers
expression analysis revealed no significant overlap, confirming the complementary nature of proteomics and transcriptomics. The regulation of ezrin2, which was identified based on a reduction in spot intensity in mesendodermal cells, was independently validated. Furthermore, we show that ezrin2 is activated by phosphorylation in mesendodermal cells and is required for proper germ layer morphogenesis. We demonstrate the feasibility of proteomics in zebrafish, concluding that proteomics is a valuable tool for analysis of early development. Supplementary material available online at http://jcs.biologists.org/cgi/content/full/119/10/2073/DC1 Key words: Proteomics, Ezrin, Gastrulation, Zebrafish
converging towards the dorsal side of the gastrula and redistributing along the anterior-posterior axis in a movement commonly named convergent extension (reviewed by Wallingford et al., 2002). Various forward and reverse genetic approaches have provided insight into the genetic pathways controlling zebrafish germ layer formation (reviewed by Schier, 2001). TGF--like Nodal signals play a central role in this process by both inducing mesendodermal cell fates and controlling the cell-autonomous ingression of mesendodermal progenitors. In addition to Nodals, Wnt, PDGF and JAK/STAT signaling have all been shown to control different aspects of progenitor cell polarization and directed migration, although little is known about the precise molecular and cellular mechanisms by which these signaling pathways function during gastrulation (reviewed by Solnica-Krezel, 2005). During germ layer formation, progenitor cells undergo pronounced changes in morphology and adhesion, suggesting that both cytoskeletal and cell adhesion proteins are crucial for this process. Wnt signals, for example, are thought to interfere with gastrulation movements by modulating the activity of adhesion molecules including cadherins (Puech et al., 2005; Torres et al., 1996; Ulrich et al., 2005) and by controlling cytoskeletal dynamics through activation of Rho kinase 2 (Rok2), a known regulator of actin-myosin contractility (Marlow et al., 2002). Interestingly, the immediate functions of
Journal of Cell Science
2074
Journal of Cell Science 119 (10)
Wnts and other signals controlling gastrulation movements appear to be largely independent of changes in gene transcription (reviewed by Veeman et al., 2003), indicating that alternative mechanisms such as protein modifications are involved. However, no systematic approach has yet been undertaken to identify potential target proteins that are translationally regulated or post-translationally modified during gastrulation. In this study, we have chosen a systematic comparative proteomic approach to identify proteins that are differentially expressed or modified between mesendodermal and ectodermal cells and might have essential roles for germ layer morphogenesis. We isolated 35 such proteins, four of which are likely to have functions in cytoskeletal organization. Comparison of our proteomic data with data obtained from an accompanying microarray-based gene expression screen revealed no significant correlation. This shows that we have identified proteins regulated on a translational or posttranslational level that would not have been discovered by gene expression analysis. Finally, the functional analysis of one of the isolated proteins, ezrin2, revealed that ezrin2 is activated by phosphorylation in mesendodermal cells and is crucially required for germ layer morphogenesis during gastrulation. Our findings demonstrate that comparative proteomics in zebrafish represents an effective method to identify candidate proteins with important functions during early development. Results Proteomic analysis of ectodermal versus mesendodermal progenitor cells To identify proteins involved in germ layer formation and morphogenesis, we performed a proteomic analysis of ectodermal versus mesendodermal progenitor cells (Fig. 1). We generated highly enriched pools of ectodermal and mesendodermal progenitor cells by overexpressing the Nodal signal Cyclops in wild-type embryos to obtain embryos primarily consisting of cells with mesendodermal character (Feldman et al., 2000) and using maternal zygotic one-eyedpinhead (oep) mutant embryos as a source for ectodermal cells (Gritsman et al., 1999). We then compared the proteomes of ectodermal with mesendodermal cells taken from embryos at 7 hours post fertilization (hpf), as at this time in wild-type embryos, the first ectodermal and mesendodermal progenitor cells have already been sorted into their respective germ layers and ingression of mesendodermal progenitors is still ongoing. We analyzed the samples by separating the proteins
according to their molecular mass and isoelectric point (pI) on large-format two-dimensional (2D) gels, both, in the basic (pI 7-11) and acidic (pI 4-7) range (Fig. 2). We took advantage of the DIGE system for pre-separation fluorescent protein labeling with three separate dyes. To reduce gel-to-gel variability owing to lack of gel homogeneity, one dye was used as a common standard applied to all replicate gels. Spot matching, quantification and statistical analysis were carried out using ‘Proteomweaver’ software and significantly up- or downregulated spots were selected for subsequent analysis by mass spectrometry. Comparison of ectodermal with mesendodermal cell extracts revealed 37 spots that significantly differed in their intensity on 2D gels (Table 1 and Table S1 in supplementary material). The large majority (31/37) of these were reduced in mesendodermal versus ectodermal cells. Using mass spectrometry, we were able to identify 36 out of 37 spots: four proteins have possible roles in the regulation of cytoskeletal dynamics, six proteins have less-defined but still potentially relevant functions for gastrulation (e.g. sialic acid synthase) and 25 proteins have metabolic or housekeeping functions. Two spots were identified as isoforms of the same protein. Comparison of proteomic and genomic analysis Microarray technology allows the quantitative analysis of gene expression on a genome-wide scale. To determine the overlap between comparative proteomics and gene expression profiling, we performed microarray analysis. The transcriptomes of ectodermal and mesendodermal cell populations, which were prepared with the same method as used for the proteomic screen, were analyzed on microarrays containing probes for more than 14,000 different zebrafish cDNAs (Affymetrix) (http://www.ebi.ac.uk/arrayexpress/ query/entry, experiment accession number: E-MEXP-171). Based on a maximal FDR (false discovery rate) of 5% using the Benjamini-Hochberg algorithm (Benjamini and Hochberg, 1995), 220 genes showed significant regulation (Student’s ttest: Pmax=0.0004). Contrary to the results from our proteomic approach, more genes were upregulated (131) than downregulated (89) in mesendodermal versus ectodermal cells (Fig. 3A and Table S2 in supplementary material). To estimate on a gene-to-gene level the correlation of the proteomics data with the gene expression data, we compared the regulation factors of the 31 genes identified by proteomics which were represented on the microarray. Plotting the regulation factor on the protein level against the regulation factor on the RNA level
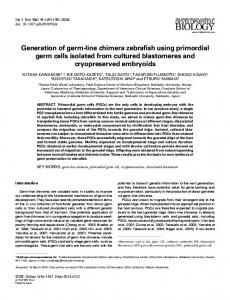
Fig. 1. Experimental layout. Ectodermal and mesendodermal protein extracts were labeled with Cy3 or Cy5 fluorescent dyes, combined and subsequently separated by 2D gel electrophoresis (DIGE). A common standard labeled with Cy2 was used for normalization. The scanned images were analyzed with Proteomweaver software to identify spots that displayed statistically significant changes. Differential spots were cut, digested with trypsin and analyzed by LCMS/MS. Database searches were performed in Ensembl and TIGR databases using MASCOT.
Regulators of germ layer morphogenesis
2075
Journal of Cell Science
Fig. 2. 2D gel electrophoresis. Three Cy-dye labeled extracts (50 g protein each) were combined and separated by 2D gel electrophoresis. First dimension: 24 cm strips pI 4-7 (A) and pI 7-11 (B). Second dimension, 25.5 ⫻ 20.5 cm 10% SDS polyacrylamide gels. Spots differentially regulated between ectodermal and mesendodermal cells are outlined in red, numbered and listed in Table 1.
revealed little correlation (Fig. 3B). Thus, the majority of the proteins identified by the proteomic approach were specifically regulated on a translational or post-translational level. This emphasizes the importance of comparative proteomics to identify protein modifications undetectable by gene expression profiling. Regulation of ezrin2 One of the significantly regulated spots turned out to be a zebrafish ERM (ezrin, moesin, radixin) protein. Analyzing the phylogenetic relationship of this ERM protein to other known ezrin, moesin and radixin gene homologues in mouse, humans and Drosophila showed that the identified protein is most
closely related to ezrin (Fig. 4A). We therefore termed it zebrafish ezrin2 although the same gene has previously been described as radixin (see ZFIN rdx). To test whether ezrin2 is maternally supplied and/or zygotically expressed during gastrulation, we performed in situ hybridizations on 32-cellstage (2 hpf), shield-stage (6 hpf), 70% epiboly-stage (7 hpf) and bud-stage (10 hpf) embryos. In both whole-mount and sectioned wild-type embryos, we observed strong ubiquitous expression of maternal ezrin2 at the 32-cell stage (data not shown), weak ubiquitous zygotic/maternal expression at shieldstage and 70% epiboly-stage, and strong zygotic expression within the head mesendoderm (prechordal plate) at bud stage (Fig. 4B). Apart from the expression in the prechordal plate, no difference in expression level between ectodermal and mesendodermal tissue could be detected (Fig. 4C). On 2D gels, the ezrin2 spot was reduced 1.6-fold in mesendodermal cells as compared with ectodermal cells. This reduction was detected in all seven gels tested and was statistically significant (P99% purity, Novagen) to degrade DNA/RNA. Protein concentration was determined by RC DC Protein assay (Bio-Rad). Insoluble particles were removed by centrifugation for 1 hour at 60,000 g. 50 g protein was then labeled with 200 pmol Cy dye as described in the user manual (Amersham Biosciences). The samples labeled with different dyes were combined. For 2D gels of proteins in the acidic range (pI 4-7), labeled samples were mixed with 450 l rehydration solution (pI 4-7: 7 M urea, 2 M thiourea, 4% Chaps, 5% isopropanol, 2.5% glycerol, 1% DTT, 5 l/ml Bio-Lytes 3/10 (Bio-Rad) and 450 l of this solution was applied to a 24 cm strip (pI 4-7, Amersham Biosciences) for rehydration loading overnight. The focusing conditions for Protean IEF cell (Bio-Rad) were 30 minutes linear 0 V to 150 V, 1.5 hours 150 V, 1 hours 250 V, 4 hours linear 250 V to 1000 V, 1.5 hours linear 1000 V to 5000 V, 2 hours linear 5000 V to 10,000 V, 10,000 V for 80 kVhours, 500 V until proceeding to second dimension. For 2D gels of proteins in the basic range (pI 711), labeled samples were brought to 10 mM DTT and 5 l/ml IPG buffer pH 611 (Amersham Biosciences). Strips (pI 7-11, Amersham Biosciences) were rehydrated overnight with 450 l rehydration solution (7 M urea, 2 M thiourea, 0.5% Chaps, 12 l/ml Destreak (Amersham Biosciences), 5 l/ml IPG buffer (pH 6-11). The sample was applied by cup-loading at the anodic side. The focusing conditions for Protean IEF cell (Bio-Rad) were 1 hour linear 0 V to 150 V, 1 hour 150 V, 3 hours 300 V, 2 hours 500 V, 3 hours linear 500 V to 1000 V, 5 hours linear 1000 V to 10,000 V, 10,000 V for 50 kVhours, 500 V till proceeding to second dimension. As protease inhibitors, we added to all buffers before the first dimension a mix of 1 mM EDTA, 10 M E64c, 0.002 mg/ml aprotinin and 1 M pepstatin A. Focused strips were reduced (15 minutes 20 mg/ml DTT) and alkylated (15 minutes
25 mg/ml IAA) in equilibration buffer (50 mM Tris-HCl pH 8.8, 6 M urea, 30% glycerol, 2% SDS, 0.002% Bromophenol Blue), loaded on 10% SDSpolyacrylamide gels and run on Ettan Daltsix (Amersham Biosciences) (2 hours 8 mA/gel, 16 hours 85 V). Gels were scanned with Typhoon 9410 Variable Mode Imager (Amersham Biosciences).
Quantification A mixture of mesendodermal and ectodermal samples was labeled with Cy2 and used as internal standard for all replicate gels. The experiment was performed in triplicate and every sample was analyzed once Cy3 and once Cy5 labeled. Spot detection, matching and quantification were performed using Proteomweaver 3.0 software (Definiens, Munich, Germany).
Mass spectrometry Gels were stained with colloidal Coomassie Blue (Kang et al., 2002) for visual detection of spots. Spots were manually excised, reduced, alkylated and in-gel digested with trypsin as previously described (Shevchenko et al., 1996). Extracted peptides were dried in a vacuum centrifuge and subsequently redissolved in 10 l of 0.04% trifluoroacetic acid (TFA). Samples were analyzed by LC-MS/MS with LTQ ion trap mass spectrometer (Thermo Electron, San Jose, CA) coupled to UltiMate Plus nano LC system (LC Packings, Amsterdam, The Netherlands). 4 l of the sample was injected and separated by reverse-phase HPLC (C18 PepMAP100, ID 75 m, length 15 cm; LC Packings) with mobile phases of 0.1% formic acid (A) and 80% acetonitrile (B) for 20 minutes 0-20% B, 15 minutes 20-50% B and 5 minutes 50-100% B. The mass spectrometer was operated in data-dependent mode alternating between MS and MS/MS on the five most abundant peaks using dynamic exclusion. Database search was performed using MASCOT (1.8, Matrix Science LTD, U.K.) against the TIGR zebrafish gene index (ftp://ftp.tigr.org/pub/data/tgi/Danio_rerio/ZGI.release_16.zip) and the Ensembl zebrafish peptide database (http://www.ensembl.org/info/data/ download.html zebrafish->peptide->*.fa.gz). MASCOT search parameters were peptide precursor mass tolerance, ±2 Da; mass tolerance fragment ions, ±0.5 Da; enzyme specificity, trypsin; missed cleavages tolerated, 1; fixed modifications, carbamidomethyl; no variable modifications.
Microarray analysis RNA was extracted from de-yolked cells using NucleoSpin RNA II kit (protocol 5.1, Macherey-Nagel, Dueren, Germany). RNA was then precipitated with sodium acetate pH 5.2, washed twice with 80% ethanol and re-suspended to a concentration of 1 g/l. ServiceXS (Leiden, The Netherlands) performed the labeling and hybridization experiments using MessageAMPII kit (Ambion, Austin TX, USA) and Affymetrix Zebrafish Genome arrays (Affymetrix, Santa Clara CA, USA). Statistical analysis was performed with ArrayAssist software (Stratagene, La Jolla CA, USA). The raw data (CEL-format) was processed by PLIER (www.affymetrix.com) probe level analysis and logarithmic transformation. Three independent replicates of each condition were analyzed. Student’s t-test was applied with a maximal FDR (false discovery rate) of 5% (Benjamini-Hochberg algorithm). Significantly regulated genes were centered, normalized and then hierarchically clustered with ‘Cluster 3.0’ software (Eisen et al., 1998). Fig. 3A was generated with ‘Gene Treeview’.
Phylogenetic tree Sequences fetched from NCBI were aligned using Clustal X (Thompson et al., 1997). The tree was generated with PHYLIP (Felsenstein, 1989), distancematrix protdist, 100 iterations calculated using the fitch algorithm.
Western blotting
De-yolked samples were dissolved in 2 l 2⫻ SDS sample buffer per embryo and incubated for 5 minutes at 95°C and loaded on SDS gels. Electrophoresis, blotting and detection was performed as previously described (Link et al., 2006). Before reprobing, membranes were incubated for 30 minutes at 50°C in stripping solution (100 mM 2-mercaptoethanol, 2% SDS, 62.5 mM Tris-HCl pH 6.7) followed by two washes for 5 minutes each with PBST. Antibodies used were anti-MEK1/2 (Cell Signaling #9122, 1:1000), anti-␣-tubulin (Sigma T6199, 1:2000), anti-ERM (BD Biosciences 610401, 1:1000) and anti-phosphorylated-ERM (Cell Signaling #3141, 1:1000).
Morpholino oligonucleotide and mRNA injection For MO injections the following MOs directed against zebrafish ezrin2 were injected into one-cell-stage embryos: (MO1 directed against the 5⬘ coding sequence) 5⬘-CGCGAACATTTACTGGTTTAGGCAT-3⬘ and (MO2 directed against the 5⬘UTR) 5⬘-GATGTAGATGCCGATTCCTCTCGTC-3⬘ (Gene Tools, Philomath, OR). MOs were designed according to Gene Tools targeting guidelines. MO sequences were then compared with the Ensembl database by using BLAST, and no significant similarities were found to any sequences other than zebrafish ezrin2. For mRNA injection, ezrin2 full-length cDNA was cloned by PCR into pCS2+ vector. Seven mutations changing two valines to isoleucines were introduced at the MO1 binding site (ATGCCTAAACCAa(G)Tc(A)AAc(T)a(G)Tc(T)a(C)Ga(C)GTC) so that MO1 could not bind the injected mRNA. mRNA was transcribed from
Regulators of germ layer morphogenesis pCS2-ezrin2 by using the SP6 mMessage mMachine (Ambion, Austin, TX) and injected into one-cell-stage embryos.
In situ hybridization and sectioning Whole-mount in situ hybridization was performed as previously described (Barth and Wilson, 1995). For ezrin2, sense and antisense RNA probes were synthesized from the ezrin2 full-length cDNA. For hgg1, ntl and dlx3 in situ hybridization, antisense RNA probes were synthesized from partial sequences of the respective cDNAs. For sectioning, in situ-stained embryos were equilibrated in gelatine/albumin solution (0.49% gelatine, 30% egg albumin, 20% sucrose in PBS), transferred into fresh polymerization solution (25% glutaraldehyde in gelatin/albumin solution, 1:10) and polymerized for 15 minutes at room temperature. 40 m serial sections were taken using a Leica Vibratome VT1000S.
Immunostaining of sectioned embryos
Journal of Cell Science
Embryos were fixed in 4% paraformaldehyde overnight at 4°C, dehydrated and embedded in paraffin wax. 10 m serial sections were taken on a microtome, dried overnight at 37°C and then rehydrated. Immunostaining was done according to manufacturer’s instructions for the anti-phosphorylated-ERM antibody (phosphoERM) (Cell Signaling #3141). Briefly, for antigen retrieval, the slides were boiled in 10 mM sodium citrate buffer pH 6.0 and kept at sub-boiling temperature for 10 minutes. Samples were washed with TBST (Tris-buffered saline, 1% Tween-20) and blocked with 5% normal goat serum in TBST for 2 hours at room temperature. Then, they were incubated overnight at 4°C with phospho-ERM antibody 1:25 in blocking solution, followed by several washes with TBST and incubation with secondary antibody (Alexa Fluor 488 anti-rabbit 1:1000; Invitrogen), for 2 hours at room temperature. After several washing steps, sections were mounted in DABCO medium and images were acquired with a Leica TCS SP2 confocal microscope.
Image acquisition and quantification DIC images were taken as previously described (Montero et al., 2003). For F-actin phalloidin staining, the embryos were fixed in 4% paraformaldehyde overnight at 4°C, permeabilized for 4-5 hours in PBST, incubated for 1 hour in Rhodamineconjugated phalloidin (1:200; Invitrogen) and then rinsed several times in PBST. Stained embryos were mounted on agarose-coated dishes in PBST medium with the animal pole facing up, and images were acquired with a Leica TCS SP2 confocal microscope. To record confocal time-lapse movies, we injected a mixture of 90 pg GAP43-eGFP mRNA and 30 pg GFP mRNA into one-cell-stage embryos. The movies were recorded as previously described (Montero et al., 2005) using a BioRad Radiance 2000 multiphoton confocal microscope with a 60⫻ water-immersion lens.
We thank Jennifer Geiger, Masa Tada and Laurel Rohde for reading earlier versions of this manuscript and Bianca Habermann for generating the phylogenetic tree of ezrin2. We are grateful to G. Junghanns, E. Lehmann, M. Fischer and J. Hueckmann for help with the fish care and to S. Witzel and S. Schneider for technical help. This work was supported by the DFG priority program SP 1049 (Molecular Control Mechanisms of Cell Migration) and the EC FP6 Zf-Models project.
References Adams, J. C. (2004). Roles of fascin in cell adhesion and motility. Curr. Opin. Cell Biol. 16, 590-596. Barth K. A and Wilson S. W. (1995). Expression of zebrafish nk2.2 is influenced by sonic hedgehog/vertebrate hedgehog-1 and demarcates a zone of neuronal differentiation in the embryonic forebrain. Development, 121, 1755-1768. Benjamini, Y. and Hochberg, Y. (1995). Controlling the false discovery rate–a practical and powerful approach to multiple testing. J. R. Stat. Soc. Ser. B Methodol. 57, 289-300. Bretscher, A., Edwards, K. and Fehon, R. G. (2002). ERM proteins and merlin: integrators at the cell cortex. Nat. Rev. Mol. Cell Biol. 3, 586-599. Crepaldi, T., Gautreau, A., Comoglio, P. M., Louvard, D. and Arpin, M. (1997). Ezrin is an effector of hepatocyte growth factor-mediated migration and morphogenesis in epithelial cells. J. Cell Biol. 138, 423-434. Dard, N., Louvet, S., Santa-Maria, A., Aghion, J., Martin, M., Mangeat, P. and Maro, B. (2001). In vivo functional analysis of ezrin during mouse blastocyst formation. Dev. Biol. 233, 161-173. Eisen, M. B., Spellman, P. T., Brown, P. O. and Botstein, D. (1998). Cluster analysis and display of genome-wide expression patterns. Proc. Natl. Acad. Sci. USA 95, 1486314868. Feldman, B., Dougan, S. T., Schier, A. F. and Talbot, W. S. (2000). Nodal-related signals establish mesendodermal fate and trunk neural identity in zebrafish. Curr. Biol. 10, 531-534. Felsenstein, J. (1989). PHYLIP–phylogeny inference package (Version 3.2). Cladistics 5, 164-166. Gong, L., Puri, M., Unlu, M., Young, M., Robertson, K., Viswanathan, S., Krishnaswamy, A., Dowd, S. R. and Minden, J. S. (2004). Drosophila ventral furrow morphogenesis: a proteomic analysis. Development 131, 643-656. Gritsman, K., Zhang, J., Cheng, S., Heckscher, E., Talbot, W. S. and Schier, A. F.
2083
(1999). The EGF-CFC protein one-eyed pinhead is essential for nodal signaling. Cell 97, 121-132. Hebestreit, H. F. (2001). Proteomics: an holistic analysis of nature’s proteins. Curr. Opin. Pharmacol. 1, 513-520. Jawhari, A. U., Buda, A., Jenkins, M., Shehzad, K., Sarraf, C., Noda, M., Farthing, M. J., Pignatelli, M. and Adams, J. C. (2003). Fascin, an actin-bundling protein, modulates colonic epithelial cell invasiveness and differentiation in vitro. Am. J. Pathol. 162, 69-80. Kang, D. H., Gho, Y. S., Suh, M. K. and Kang, C. H. (2002). Highly sensitive and fast protein detection with coomassie brilliant blue in sodium dodecyl sulfatepolyacrylamide gel electrophoresis. Bull. Korean Chem. Soc. 23, 1511-1512. Kimmel, C. B., Ballard, W. W., Kimmel, S. R., Ullmann, B. and Schilling, T. F. (1995). Stages of embryonic development of the zebrafish. Dev. Dyn. 203, 253-310. Kureishy, N., Sapountzi, V., Prag, S., Anilkumar, N. and Adams, J. C. (2002). Fascins, and their roles in cell structure and function. BioEssays 24, 350-361. Lamb, R. F., Ozanne, B. W., Roy, C., McGarry, L., Stipp, C., Mangeat, P. and Jay, D. G. (1997). Essential functions of ezrin in maintenance of cell shape and lamellipodial extension in normal and transformed fibroblasts. Curr. Biol. 7, 682-688. Link, V., Shevchenko, A. and Heisenberg, C. P. (2006). Proteomics of early zebrafish embryos. BMC Dev. Biol. 6, 1. Lopez, M. F. (1999). Proteome analysis. I. Gene products are where the biological action is. J. Chromatogr. B Biomed. Sci. Appl. 722, 191-202. Marlow, F., Topczewski, J., Sepich, D. and Solnica-Krezel, L. (2002). Zebrafish rho kinase 2 acts downstream of wnt11 to mediate cell polarity and effective convergence and extension movements. Curr. Biol. 12, 876-884. Matsui, T., Maeda, M., Doi, Y., Yonemura, S., Amano, M., Kaibuchi, K., Tsukita, S. and Tsukita, S. (1998). Rho-kinase phosphorylates COOH-terminal threonines of ezrin/radixin/moesin (ERM) proteins and regulates their head-to-tail association. J. Cell Biol. 140, 647-657. Mhawech, P. (2005). 14-3-3 proteins – an update. Cell Res. 15, 228-236. Montero, J. A., Kilian, B., Chan, J., Bayliss, P. E. and Heisenberg, C. P. (2003). Phosphoinositide 3-kinase is required for process outgrowth and cell polarization of gastrulating mesendodermal cells. Curr. Biol. 13, 1279-1289. Montero, J. A., Carvalho, L., Wilsch-Brauninger, M., Kilian, B., Mustafa, C. and Heisenberg, C. P. (2005). Shield formation at the onset of zebrafish gastrulation. Development 132, 1187-1198. Mullins, M. C., Hammerschmidt, M., Haffter, P. and Nusslein-Volhard, C. (1994). Large-scale mutagenesis in the zebrafish: in search of genes controlling development in a vertebrate. Curr. Biol. 4, 189-202. Patton, W. F. (1999). Proteome analysis. II. Protein subcellular redistribution: linking physiology to genomics via the proteome and separation technologies involved. J. Chromatogr. B Biomed. Sci. Appl. 722, 203-223. Puech, P. H., Taubenberger, A., Ulrich, F., Krieg, M., Muller, D. J. and Heisenberg, C. P. (2005). Measuring cell adhesion forces of primary gastrulating cells from zebrafish using atomic force microscopy. J. Cell Sci. 118, 4199-4206. Rodriguez, L. G. and Guan, J. L. (2005). 14-3-3 regulation of cell spreading and migration requires a functional amphipathic groove. J. Cell Physiol. 202, 285-294. Rutishauser, U. and Landmesser, L. (1996). Polysialic acid in the vertebrate nervous system: a promoter of plasticity in cell-cell interactions. Trends Neurosci. 19, 422-427. Sato, N., Funayama, N., Nagafuchi, A., Yonemura, S., Tsukita, S. and Tsukita, S. (1992). A gene family consisting of ezrin, radixin and moesin. Its specific localization at actin filament/plasma membrane association sites. J. Cell Sci. 103, 131-143. Schier, A. F. (2001). Axis formation and patterning in zebrafish. Curr. Opin. Genet. Dev. 11, 393-404. Schier, A. F. (2003). Nodal signaling in vertebrate development. Annu. Rev. Cell Dev. Biol. 19, 589-621. Shevchenko, A., Wilm, M., Vorm, O. and Mann, M. (1996). Mass spectrometric sequencing of proteins silver-stained polyacrylamide gels. Anal. Chem. 68, 850-858. Solnica-Krezel, L. (2005). Conserved patterns of cell movements during vertebrate gastrulation. Curr. Biol. 15, R213-R228. Stanford, W. L., Cohn, J. B. and Cordes, S. P. (2001). Gene-trap mutagenesis: past, present and beyond. Nat. Rev. Genet. 2, 756-768. Stern, C. (2004). Gastrulation: From Cells to Embryo. Cold Spring Harbor, NY: Cold Spring Harbor Laboratory Press. Thompson, J. D., Gibson, T. J., Plewniak, F., Jeanmougin, F. and Higgins, D. G. (1997). The CLUSTAL_X windows interface: flexible strategies for multiple sequence alignment aided by quality analysis tools. Nucleic Acids Res. 25, 4876-4882. Torres, M. A., Yang-Snyder, J. A., Purcell, S. M., DeMarais, A. A., McGrew, L. L. and Moon, R. T. (1996). Activities of the Wnt-1 class of secreted signaling factors are antagonized by the Wnt-5A class and by a dominant negative cadherin in early Xenopus development. J. Cell Biol. 133, 1123-1137. Ulrich, F., Krieg, M., Schotz, E. M., Link, V., Castanon, I., Schnabel, V., Taubenberger, A., Mueller, D., Puech, P. H. and Heisenberg, C. P. (2005). Wnt11 functions in gastrulation by controlling cell cohesion through Rab5c and E-Cadherin. Dev. Cell 9, 555-564. Varki, A. (1997). Sialic acids as ligands in recognition phenomena. FASEB J. 11, 248-255. Veeman, M. T., Axelrod, J. D. and Moon, R. T. (2003). A second canon. Functions and mechanisms of beta-catenin-independent Wnt signaling. Dev. Cell 5, 367-377. Wallingford, J. B., Fraser, S. E. and Harland, R. M. (2002). Convergent extension. The molecular control of polarized cell movement during embryonic development. Dev. Cell 2, 695-706. Warga, R. M. and Kimmel, C. B. (1990). Cell movements during epiboly and gastrulation in zebrafish. Development 108, 569-580.