Anim. Res. 51 (2002) 165–173 INRA, EDP Sciences, 2002 DOI: 10.1051/animres:2002011
165
Original article
Identification of the main factors that influence caecal fermentation traits in growing rabbits Javier GARCÍAa, Thierry GIDENNEb, Luisa FALCAO-E-CUNHAc, Carlos de BLASa*
a
Dpto Producción Animal, Universidad Politécnica de Madrid, ETSI Agrónomos, Ciudad Universitaria s/n, 28040 Madrid, Spain bStation de Recherches Cunicoles, INRA, Toulouse, BP 27, 31326 Castanet-Tolosan, France cInstituto Superior de Agronomía, Tapada da Ajuda, Universidade Técnica de Lisboa, Lisboa Codex 1399, Portugal (Received 7 January 2002; accepted 25 April 2002) Abstract — The aim of this work was to determine the main factors that affect caecal pH, the caecal concentrations and molar proportions of volatile fatty acids (VFA) and the weight of caecal contents. The database was constituted of data (n = 92) from three laboratories that included the mentioned traits and the chemical composition and nutritive value of the diets. The laboratory affected caecal pH (P < 0.001) probably because of the differences in sampling time among them. Dietary uronic acids (UA) were measured in 21 diets and were negatively correlated with caecal pH and positively with caecal VFA concentration and the proportion of propionic acid (P = 0.004, 0.06 and 0.03, respectively). When UA was removed from the model, no other chemical characteristics significantly affected caecal pH, and digestible NDF was the variable which was the best correlated with it (R 2 = 0.58; P < 0.001). Only one laboratory detected a relationship between caecal pH and caecal concentrations of VFA (P = 0.044) and N-NH3 (P = 0.14), which accounted for 12% of the variability observed in caecal pH. A linear and quadratic effect of dietary NDF and the degree of lignification of NDF on VFA concentration was found (R2 = 0.56; P < 0.001), indicating a positive effect of high levels of low lignified fibre on caecal VFA. The weight of caecal contents was quadratically influenced by dietary NDF (R2 = 0.39; P < 0.001). It was also linearly affected by the degree of lignification of NDF (P < 0.001). Dry matter intake was negatively correlated with caecal content weight (P < 0.001; R2 = 0.44), once the effects of the laboratory and dietary digestible energy concentration were discounted. caecal fermentation traits / fibre digestion / intake / growing rabbits
*Correspondence and reprints Tel.: 34 1 5492357; fax: 34 1 5499763; e-mail:
[email protected]
166
J. García et al.
Résumé — Identification des principaux facteurs affectant les paramètres de fermentation dans le caecum chez les lapins en croissance. Cette étude avait pour but d’identifier les principaux facteurs qui affectent le pH, les concentrations et les proportions molaires en acides gras volatils (AGV) du contenu du caecum, ainsi que le poids du contenu caecal. Une base de données a été constituée à partir de résultats fournis par trois laboratoires (n = 92) comprenant, outre les paramètres caecaux, la composition chimique et la valeur nutritive des régimes. Le laboratoire a eu un effet (P < 0,001) sur le pH caecal en raison probablement de différences dans les temps de prélèvement. Les teneurs en acides uroniques (AU), qui ont été mesurées sur 21 régimes, ont été négativement corrélées avec le pH caecal et positivement corrélées avec la concentration en AGV et la proportion d’acide propionique (P = 0,004, 0,06 et 0,03, respectivement). En enlevant les AU du modèle, le pH caecal n’a été influencé par aucune autre composante chimique et la variable la plus étroitement corrélée a été la teneur en NDF digestible (R2 = 0,58 ; P < 0,001). Un effet linéaire et quadratique du taux de NDF et du degré de lignification (R2 = 0,56 ; P < 0,001) a été observé sur la concentration en AGV, indiquant un effet positif des taux élevés de fibres peu lignifiées sur les AGV dans le caecum. Le contenu du caecum est influencé quadratiquement par la teneur en NDF de l’aliment (R2 = 0,39 ; P < 0,001). Il est aussi dépendant de la proportion de lignine dans le NDF (P < 0,001). L’ingestion de matière sèche a été négativement affectée par le poids du contenu caecal (R2 = 0,44 ; P < 0,001), une fois déduits les effets du laboratoire et de la concentration en énergie digestible de la ration. paramètres de fermentation / caecum / fibres / ingestion / lapin en croissance
1. INTRODUCTION Caecal pH and volatile fatty acid (VFA) concentrations are classical variables characterising the extent and the pattern of caecal fermentation, and constituting an indirect estimate of caecal microbial activity. In the rabbit, changes of these traits (an increase in caecal pH and/or decrease in VFA and changes in the molar proportions of the different VFA) are correlated with the health status of the growing animal [10, 16], that is also related to fibre intake. In addition, dietary level and intake of fibre also affect the weight of the caecal contents (CCW) and the ileo-rectal mean retention time [12]. When the latter is longer associated to low fibre levels and to changes in caecal contents weight, it is related to a lower feed intake and to an impairment of postweaning growth [5, 14, 17], and it is also unfavourable for the health status of the animal [10]. Therefore, the aim of this study was to determine the nutritional factors that affect caecal pH, the caecal concentration of VFA and the weight of caecal contents, by using data collected from the three laboratories.
2. MATERIALS AND METHODS 2.1. Database A total of 92 experimental diets from three laboratories (Universidad Politécnica de Madrid (UPM), Institut National de la Recherche Agronomique (INRA of Toulouse) and Universidade Técnica de Lisboa (UTL)) were used in the database, which included values of caecal pH, caecal VFA concentration, CCW, dietary chemical composition (on DM basis) and faecal apparent digestibility of the nutrients. The complete information for caecal traits was available for 45 diets. Mean values and variability of the traits studied and of the chemical composition and nutritive value of the diets are shown in Table I. The methodology used in each laboratory was described by Falcao-eCunha et al. [4], García et al. [7] and Gidenne et al. [14], and differed for some procedures. The time at slaughter was the most important difference: at 12:00 h in INRA and 19:00 h in UPM and UTL experiments. A second difference among the laboratories was the body weight of the rabbits. Data were obtained with growing
Factors influencing caecal traits in rabbits
rabbits, but the animals used at UPM and UTL weighed around 2 kg, whereas in some experiments at INRA, younger rabbits were used (up to 1.1 kg, on average 1.56 kg) (Tab. I). 2.2. Statistical analysis A correlation analysis was done in order to study the linear relationships between the caecal fermentation traits and the chemical composition and nutritive value of the diets. Prediction models of caecal traits were developed using the GLM procedure of SAS [19]; the laboratory was included as a classified effect and dietary chemical composition and digestion measurements as linear and quadratic covariates. The interactions between the laboratory and the covariates were also included in the model. 3. RESULTS AND DISCUSSION 3.1. Caecal pH An effect of the laboratory on caecal pH was detected (P < 0.001), explaining 48% of the total variance. Caecal pH tended to decrease during the feed intake period (evening and night), when a higher amount of substrate for the microorganisms was entering into the caecum [1]. Accordingly, caecal pH obtained in UPM and UTL rabbits was lower (P < 0.001) than that of INRA (see Tabs. I and II, Eqs. (1), (2) and (3)). Once the laboratory effect was taken into account, dietary uronic acid concentrations (UA) were the only dietary chemical measurement related to caecal pH (P = 0.004; n = 21) that decreased as UA increased (see Tab. II, Eqs. (1) and (2)). Uronic acids constitute an important fraction of pectic substances, which are the most available cell wall carbohydrates for caecal microorganisms [12]. In fact, UA account for an average 28% of total (water soluble and water insoluble) non starch polysaccharide (NSP)
167
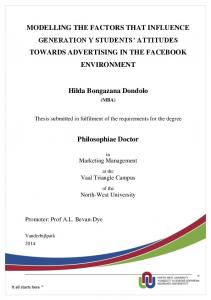
contents, but for 48% of total digestible NSP in six different sources of fibre studied by García et al. [6]. Likewise, total NSP of an alfalfa hay studied by Gidenne [8] contained 23% of UA and accounted for 39% of the total digestible NSP. Uronic acids are partially soluble in water and only a small proportion is retained in the NDF residue [2], which can explain its high digestibility. Indeed, both Carabaño et al. [2] and Gidenne [8] detected partial digestion of UA before the caecum (59 and 37% of the total digestible UA, respectively). This means that the UA digested in the caecum accounted for 46 and 27% of the total NSP digested in this organ, respectively. The prediction of caecal pH might be improved if the amount of total dietary pectins (mainly constituted by the UA backbone and rhamnose, arabinose and galactose) was available, instead of that of UA only, and especially the fraction digested in the caecum. Another substrate used by caecal microorganisms is the degradable insoluble cell wall that can be estimated as the dietary digestible NDF concentration (DNDF). When the laboratory and UA where included in the model, DNDF had a slight influence on caecal pH (P = 0.064) that decreased as DNDF increased (see Tab. II; Eq. (2)). Uronic acid content was determined in a relatively low number of diets (21 out of 92). The effect of diet on caecal pH was studied in a larger number of diets (n = 82), by removing dietary UA concentration from the model. No significant effect of any dietary chemical component was found. However, DNDF was negatively correlated with caecal pH (r = –0.76; P < 0.001; see Tab. II, Eq. (3)). This result might be explained by a positive correlation between dietary UA and DNDF content in this database, since the ingredients with a high proportion of pectic substances (such as sugarbeet pulp, soy hulls and alfalfa) also had a high DNDF content (see Fig. 1),
UPM + INRA + UTL n mean min max CV 92 5.94 5.43 6.83 4.63 78 57.4 18.1 99.8 28.6 78 76.7 64.7 87.2 6.74 78 6.51 3.30 11.1 26.1 78 16.7 5.76 28.4 28.1 62 8.53 1.86 23.9 55.9 64 5.40 3.43 9.10 20.5 92 34.8 19.3 55.0 24.0 92 21.0 9.80 44.5 34.5 92 5.64 1.00 36.0 76.8 92 13.8 1.40 26.2 33.7 92 15.3 6.80 31.2 35.3 92 40.1 7.25 60.2 30.6 92 43.8 17.3 87.6 21.5 92 16.1 5.11 73.3 64.2 92 25.8 5.59 80.9 43.8 21 5.91 1.80 9.60 38.8 82 30.6 3.20 61.4 41.4 67 22.6 0.30 69.2 57.1 82 10.5 0.91 32.9 48.6 67 4.28 0.070 12.4 60.5 85 114.9 60.0 174.0 20.7 82 11.7 6.4 16.1 17.3 82 83.4 43.7 134.5 24.5 90 2020 1100 2600 17.9
n 52 38 38 38 38 45 52 52 52 52 52 52 52 52 52 52 11 42 27 42 27 47 42 42 52
mean 5.83 57.5 76.0 6.52 17.5 8.81 5.37 37.0 23.8 6.90 13.2 16.9 35.8 45.5 18.7 28.1 7.14 30.9 26.3 11.4 5.60 124.3 10.7 79.2 2110
UPM min max 5.43 6.28 31.8 88.5 70.9 84.2 4.90 11.1 7.00 24.0 1.86 23.9 3.43 9.10 19.3 55.0 9.80 44.5 1.00 36.0 1.40 26.2 7.20 31.2 7.25 60.2 17.3 87.6 5.11 73.3 5.59 80.9 2.30 9.60 3.20 61.4 0.30 69.2 0.91 32.9 0.070 12.4 81.0 174.0 6.40 14.3 46.8 117.6 2000 2400
CV 3.23 26.7 3.63 20.0 20.6 58.5 20.5 23.5 31.4 75.3 39.0 34.5 35.3 24.1 65.7 47.2 26.2 47.3 60.0 52.9 53.6 17.8 16.4 21.3 6.72
n 22 22 22 22 22 17 12 22 22 22 22 22 22 22 22 22 10 22 22 22 22 20 22 22 20
mean 6.28 59.0 82.3 4.94 12.2 7.78 5.53 31.7 16.7 3.64 15.0 13.0 47.4 41.0 11.6 21.4 4.55 32.6 21.8 10.3 3.66 103.7 12.5 101.3 1559
INRA min 5.75 18.1 72.9 3.30 5.76 3.60 3.88 21.5 10.2 2.00 5.40 8.20 22.9 35.4 7.08 14.7 1.80 14.7 6.40 3.47 0.96 60.0 8.93 75.0 1100
max CV 6.83 4.12 95.0 27.5 87.2 4.94 7.28 22.7 20.0 31.5 15.2 45.7 7.50 20.9 46.4 21.8 26.9 27.2 9.30 46.7 21.2 26.7 20.8 25.8 55.7 17.6 50.4 9.47 26.7 44.7 34.6 24.9 7.22 43.4 51.7 32.9 39.9 47.9 19.2 41.1 7.30 56.6 140.0 23.2 15.2 13.2 134.5 17.9 2460 29.2
UTL n mean min max CV 18 5.83 5.65 6.00 2.07 18 55.0 36.7 99.8 35.2 18 71.3 64.7 76.9 4.56 18 8.39 6.80 9.70 11.2 18 20.3 15.3 28.4 16.8 18 31.9 22.9 45.2 22.1 18 18.1 9.90 26.6 31.0 18 4.45 1.60 9.20 47.5 18 13.8 6.90 18.7 26.0 18 13.7 6.80 24.1 35.5 18 43.8 27.8 58.0 23.0 18 42.2 28.8 56.4 20.3 18 14.0 5.53 25.8 40.9 18 24.8 9.39 40.0 36.1 18 27.6 11.8 45.4 35.3 18 18.0 4.40 30.1 51.4 18 8.57 2.98 13.2 32.1 18 3.07 0.55 5.94 48.0 18 102.6 72.4 128.8 15.5 18 13.0 9.66 16.1 14.3 18 71.5 43.7 96.9 23.9 18 2275 1900 2600 10.0
CV: coefficient of variation (%). Caecal [VFA] and [N-NH3]: mmol·L–1. Acetic, propionic and butyric acids: molar proportions of caecal VFA (% VFA). CCW: caecal contents weight (% body weight). NDF: dietary neutral detergent fibre (% DM). ADF: dietary acid detergent fibre (% DM). ADL: dietary acid detergent lignin (% DM). HEM: dietary hemicellulose (% DM) calculated as: NDF-ADF. CEL: dietary cellulose (% DM) calculated as: ADF-ADL. HEMNDF, CELNDF, ADLNDF: proportions of hemicellulose, cellulose and acid detergent lignin in dietary NDF (% NDF). ADLADF: proportion of ADL in dietary ADF (% ADF). UA: dietary uronic acids (% DM). NDFd and ADFd: dietary neutral and acid detergent fibre digestibilities (%). DNDF and DADF: dietary digestible NDF and ADF (% DM). DMI: dry matter intake (g DM·d–1). DE: dietary digestible energy (MJ·kg–1 DM). DEDCP: kJ digestible energy·g–1 digestible crude protein. Body weight: g.
J. García et al.
Variable Caecal pH Caecal [VFA] Acetic acid Propionic acid Butyric acid Caecal [N-NH3] CCW NDF ADF ADL HEM CEL HEMNDF CELNDF ADLNDF ADLADF UA NDFd ADFd DNDF DADF DMI DE DEDCP Body weight
168
Table I. Number of data, mean values and variability of the caecal traits studied, chemical composition and nutritive value of the diets.
Factors influencing caecal traits in rabbits
169
Table II. Factors affecting caecal pH. Equation
Intercept
UA
DNDF
n
R2
rsd
P
(1)
y = INRA: y = UPM:
6.56 ± 0.12 –0.074 ± 0.022 6.35 ± 0.17
21
0.67
0.18 < 0.001
(2)
y = INRA: y = UPM:
6.71 ± 0.13 – 0.063 ± 0.017 – 0.018 ± 0.0093 21 6.43 ± 0.16
0.73
0.17 < 0.001
(3)
y = INRA: 6.45 ± 0.059 y = UPM: 6.03 ± 0.056 y = UTL: 5.98 ± 0.057
0.58
0.19 < 0.001
– 0.017 ± 0.0042 82
UA: dietary uronic acids (% DM) (range: 1.8–9.6). DNDF: dietary digestible NDF (% DM) (range: equation (2): 0.91–19.2, and equation (3): 0.91–32.9). Range of caecal pH: equations (1) and (2): 5.61–6.57, and equation (3): 5.43–6.83.
7.0
Caecal pH
6.8 6.6
INRA (n= 22)
6.4
UPM (n = 42)
6.2
UTL (n = 18)
6.0
Beet pulp diets
5.8
Soy hull diets
5.6
Alfalfa diets
5.4 5.2
0
5
10
15
20
25
30
Dietary digestible NDF(% DM)
35
Figure 1. Effect of increasing levels of raw materials rich in pectic substances on caecal pH and dietary digestible NDF.
whereas the opposite occurred for cereal straw and defatted grape seed meal. Moreover, it would be expected that there is a direct influence of caecal VFA and N-NH3 concentrations on caecal pH since they are the main sources of H+ and OH-, respectively. When only data from
UPM were considered, caecal pH tended to decrease when VFA increased (P = 0.044) and N-NH3 decreased (P = 0.14), but these variables only accounted for 12% of the variability observed in caecal pH. However, these effects were not detected using data from INRA or UTL (in this case the N-NH3 concentration was not available). These
170
J. García et al.
results suggest the influence of other factors on caecal pH, such as the physicochemical characteristics of dry caecal contents, which are closely related to the proportion of particles smaller than 0.3 mm [7]. 3.2. Caecal VFA concentration and molar proportions of VFA There was no influence of the laboratory on caecal VFA concentration and it was not included in the model. Caecal VFA concentration (mmol·L–1) tended to increase with UA (P = 0.06) and NDF (P = 0.007) concentration (% DM) and to decrease (P = 0.04) with the degree of lignification of NDF (% of ADL on NDF: ADLNDF). The equation obtained was: VFA = 28.8 (± 16.8) + 2.40 (± 1.22) UA + 0.89 (± 0.29) NDF – 0.72 (± 0.33) ADLNDF; n = 21; R2 = 0.52; rsd = 15.5; P < 0.005. When all the information obtained was analysed excluding UA from the model (n = 78), dietary NDF concentration and the proportion of ADL on NDF had a linear and quadratic effect (P < 0.01) on caecal VFA concentration (see Tab. III). Caecal VFA concentration was favoured by increasing levels of low lignified fibre in the diet within the range studied. This fact was confirmed by the positive correlation observed between caecal VFA concentration and DNDF (r = 0.32; P = 0.005; n = 73). An effect of the laboratory on the molar proportions of VFA was detected (P < 0.001), explaining around 50% of the total variance.
Data from INRA tended to give the highest proportions of acetic and the lowest of propionic and butyric, whereas the opposite occurred for UTL data. For the database where the UA concentration was available (n = 21), the molar proportion of propionic acid increased linearly (P = 0.03) with dietary UA content. The coefficient of regression obtained was 0.30 (± 0.13). No other variables were included in the model. Otherwise, dietary chemical composition did not significantly affect the proportions of acetic or butyric acids. When the whole database (n = 78) was used, and UA content was removed from the model, a proportion of acetic acid tended to increase linearly (P = 0.01), and that of butyric to decrease (P = 0.08) when the dietary NDF content increased (the coefficients of regression were: 0.12 ± 0.047 and –0.094 ± 0.052, respectively). 3.3. Caecal contents weight Although the laboratory had no direct influence on CCW, it was included in the model because there was an interaction between dietary NDF concentration and the laboratory (P = 0.001). We observed that CCW was affected by the dietary NDF content and the degree of lignification of NDF (P < 0.001; see Tab. IV). An increase of the weight of the digestive tract contents with high levels of fibre is common to other non-ruminant species, which would be partially associated to an increase of feed intake [3, 15, 18]. In rabbits, the content of the caecum was affected quadratically by the
Table III. Factors affecting caecal volatile fatty acid concentration (mmol·L–1). Equation (1) (2) (3) (4)
Intercept
NDF
NDF2
ADLNDF
ADLNDF2
y = 20.9 ± 6.98 1.08 ± 0.20 y = 74.0 ± 26.3 –2.11 ± 0.51 0.045 ± 0.022 y = 83.2 ± 23.1 –1.90 ± 0.46 0.042 ± 0.017 –0.79 ± 0.16 y = 94.3 ± 21.6 –1.72 ± 0.42 0.041 ± 0.016 –2.62 ± 0.53 0.040 ± 0.011
n
R2
rsd
P
78 78 78 78
0.27 0.31 0.48 0.56
14.1 13.8 12.1 11.2
< 0.001 < 0.001 < 0.001 < 0.001
NDF: dietary NDF (% DM) (range: 19.3–55.0). ADLNDF: dietary ADL × 100/dietary NDF (range: 5.1–48.6).
Factors influencing caecal traits in rabbits
171
Table IV. Factors affecting caecal content weight (% BW). Equation 1y= (1) y = 1y= 2y= (2) y = 2y=
Intercept
INRA: 15.3 ± 1.93 UPM: 18.1 ± 2.15 INRA: 16.0 ± 1.80 UPM: 19.1 ± 2.00
NDF2
NDF –0.68 ± 0.28 –0.70 ± 0.11
n
R2
rsd
P
64
0.39
0.89
< 0.001
–0.031 ± 0.0091 64
0.49
0.82
< 0.001
ADLNDF
0.011 ± 0.0021 0.0087 ± 0.0016 0.012 ± 0.0019 0.0089 ± 0.0015
NDF: dietary NDF concentration (% DM) (range: 19.3–55.5). ADLNDF: dietary ADL × 100/dietary NDF (5.1–73.3). Range of caecal contents weight (% BW): 3.43–9.1.
Table V. Relation between DMI (y) and DE and CCW. Equation
n
R2
rsd
P
54
0.44
18.9
< 0.001
–5.46 ± 1.40 –8.46 ± 2.11 54
0.57
16.6
< 0.001
Intercept
(1) y = INRA:
185.6 ± 18.9
(1) y = UPM:
201.3 ± 16.4
(2) y = INRA:
211.3 ± 17.8
(1) y = UPM:
227.1 ± 15.7
DE
CCW
–7.21 ± 1.51
DMI: dry matter intake (g DM·d–1). DE: dietary digestible energy (MJ·kg–1 DM) (range: 6.4–14.6). CCW: caecal contents weight (% BW) (range: 3.43–9.1).
200
DMI (g DM/d) DMI (INRA) = 160.2 (± 13.6) - 11.0 CCW ( ± 2.26) DMI (UPM) = 182.5 (± 11.7) - 11.0 CCW ( ± 2.26) n = 54; R2 = 0.44; rsd = 18.7; P < 0.001
175 150 125 100 75 50
3
4
5
6
7
8
Caecal content weight (% BW) INRA (n = 12)
9
10
UPM (n = 42)
Figure 2. Relationship between weight of caecal content (CCW) and dry matter intake (DMI).
172
J. García et al.
dietary fibre level (see Tab. IV), meaning that the CCW would be high either for the highest and the lowest fibre level. This effect would be related to the positive effect of fibre on the ileo-caecal motility, since a decrease in dietary fibre concentration (from 39.6 to 21.7% NDF, on DM basis) increased the mean caecal retention time (from 16.6 to 28.6 h) [9]. The third variable included in the model was ADLNDF which tended to decrease CCW linearly (P = 0.001; see Tab. IV). This is in agreement with recent studies in which a decrease in the proportion of dietary ADL caused a longer total mean retention time [11] and a higher weight of caecal contents [17]. Another factor affecting CCW would be dietary particle size, since an increase in the dietary proportion of particles smaller than 0.3 mm also favours a longer ileo-rectal retention time [13] and an accumulation of digesta in the caecum [7]. A practical implication related to CCW is its negative correlation with dry matter intake (DMI) detected in single experiments [5, 17]. In our study, a global negative relationship between CCW and DMI was also found as shown in Figure 2, and even discounted the effect on DMI of dietary digestible energy concentration (DE) (P < 0.001; see Tab. V), which is the first variable usually related to DMI in rabbits. As shown in Table V, there was also an effect of the laboratory on DMI (P < 0.001), which explained 18% of the total variability of DMI. Animals from UPM showed a higher DMI compared to those of INRA (Tab. I), which might be explained by the use of more energetic diets and lighter animals at INRA than at UPM. A positive correlation was also observed between CCW and DE (r = 0.32; P = 0.016; n = 54).
gree of lignification of NDF) and the nutritive value (digestible NDF) of the diets explained between 50 to 70% of the total variability of the caecal traits studied. Other factors not measured could also influence these traits, such as the pectin level in the feed, or its physical structure (particle size). ACKNOWLEDGEMENTS This work has been developed with the help of the European Union, within the framework of the Cost Action 848.
REFERENCES [1]
[2]
[3]
[4]
[5]
[6]
[7]
[8]
4. CONCLUSION The combination of the laboratory, chemical composition (UA, NDF and de-
[9]
Bellier R., Gidenne T., Consequences of reduced fibre intake on digestion, rate of passage and caecal microbial activity in young rabbit, Brit. J. Nutr. 75 (1996) 353–363. Carabaño R., García J., De Blas J.C., Effect of fibre source on ileal apparent digestibility of non-starch polysaccharides in rabbits, Anim. Sci. 72 (2001) 343–350. Demigné C., Rémésy C., Stimulation of absorption of volatile fatty acids and minerals in the cecum of rats adapted to a very high fiber diet, J. Nutr. 115 (1985) 53–60. Falcao-e-Cunha L., Jorge J., Freire J.P., Pérez H., Fat addition to feeds for growing rabbits, differing in fiber level and nature: effects on growth rate, digestibility and caecal fermentation patterns, World Rabbit Sci. 8, Suppl. 1, Vol. C (2000) 191–198. García G., Gálvez J.F., De Blas J.C., Effect of substitution of sugarbeet pulp for barley in diets for finishing rabbits on growth performance and on energy and nitrogen efficiency, J. Anim. Sci. 71 (1993) 1823–1830. García J., Carabaño R., De Blas J.C., Effect of fiber source on cell wall digestibility and rate of passage in rabbits, J. Anim. Sci. 77 (1999) 898–905. García J., Carabaño R., Pérez-Alba L., De Blas J.C., Effect of fiber source on cecal fermentation and nitrogen recycled through cecotrophy in rabbits, J. Anim. Sci. 78 (2000) 638–646. Gidenne T., Effect of fibre level, particle size and adaptation period on digestibility and rate of passage as measured at the ileum and in the faeces in the adult rabbit, Brit. J. Nutr. 67 (1992) 133–146. Gidenne T., Effets d’une réduction de la teneur en fibres alimentaires sur le transit digestif du lapin. Comparaison et validation de modèles
Factors influencing caecal traits in rabbits
[10] [11]
[12]
[13]
[14]
d’ajustement des cinétiques d’excrétion fécale des marqueurs, Reprod. Nutr. Dev. 34 (1994) 295–307. Gidenne T., Caeco-colic digestion in the growing rabbit: impact of nutritional factors and related disturbances, Livest. Prod. Sci. 51 (1997) 73–88. Gidenne T., Arveux P., Madec O., The effect of the quality of dietary lignocellulose on digestion, zootechnical performance and health of the growing rabbit, Anim. Sci. 73 (2001) 97–104. Gidenne T., Carabaño R., García J., De Blas C., Fibre digestion, in: de Blas C., Wiseman J. (Eds.), The nutrition of the rabbit, Commonwealth Agricultural Bureau, Wallingford, UK, 1998, pp. 69–88. Gidenne T., Carré B., Ségura M., Lapanouse A., Gomez J., Fibre digestion and rate of passage in the rabbit: effect of particle size and level of lucerne meal, Anim. Feed Sci. Technol. 32 (1991) 215–221. Gidenne T., Pinheiro V., Falcao-e-Cunha L., A comprehensive approach of the rabbit digestion: consequences of a reduction in dietary fibre supply, Livest. Prod. Sci. 64 (2000) 225–237.
173
[15] Kass M.L., Van Soest P.J., Pond W.G., Utilization of dietary fiber from alfalfa by growing swine. I. Apparent digestibility of diet components in specific segments of the gastrointestinal tract, J. Anim. Sci. 50 (1980) 175–197. [16] Lebas F., Gidenne T., Perez J.M., Licois D., Nutrition and Pathology, in: de Blas C., Wiseman J. (Eds.), The nutrition of the rabbit, Commonwealth Agricultural Bureau, Wallingford, UK, 1998, pp. 197–213. [17] Nicodemus N., Carabaño R., García J., Méndez J., De Blas C., Performance response of lactating and growing rabbits to dietary lignin content, Anim. Feed Sci. Technol. 80 (1999) 43–54. [18] Stanogias G., Pearce G.R., The digestion of fibre by pigs. 3. Effects of the amount and type of fibre on physical characteristics of segments of the gastrointestinal tract, Brit. J. Nutr. 53 (1985) 537–548. [19] Statistical Analysis Systems Institute, SAS/ STAT user’s guide, version 6, fourth edition, SAS Institute Inc., Cary, NC, USA, 1990.
To access this journal online: www.edpsciences.org