Identity and place: The changing role of Swabian in modern Germany Karen V. Beaman Queen Mary, University of London Eberhard Karls University of Tübingen Conference on Language, Place and Periphery University of Copenhagen, Denmark Beaman – Language, Place and Periphery – University of Copenhagen January 2018 January –18-19, 2018
Page 1
Research Goals The goals of this research are: • to understand the nature and extent of dialect change in Swabia • to uncover the factors driving the attrition or retention of various dialect features.
Beaman – Language, Place and Periphery – University of Copenhagen – January 2018
Page 2
Research Background • Dialect Attrition / Dialect Contact Auer (2005); Britain (2009); Dorian (1978); Schilling-Estes & Wolfram (1999); Moore & Carter (2015); Smith & Durham (2012); Trudgill (1983, 1986); Vandekerckhove & Britain (2009); Wagener (2002)
• Apparent and Real Time Studies Labov (1966, 1975, 1991, 2001, ...); Sankoff (2005, 2006); Sankoff & Blondeau (2007); Wagner & Sankoff (2011)
• Longitudinal / Lifespan Studies Buchstaller (2015, 2016); Chambers (2003); Denis & Tagliamonte (2017); Rickford & Price (2013); Sankoff & Laberge (1978); Tagliamonte & D’Arcy (2009); Wagner (2012)
• Spatiality / Mobility Auer (2007); Blommaert (2016); Britain (2012, 2013, 2016); Coupland (2016); Johnstone et al. (2006); Johnstone (2011); Milroy (2002)
• Identity / Orientation Cheshire (2005); Coupland (2001); Eckert (1988); Johnstone (2016); Hoffmann & Walker (2010); LePage & Tabouret-Keller (1985); Sharma & Rampton (2015) Beaman – Language, Place and Periphery – University of Copenhagen – January 2018
Page 3
Swabian Swabian or Schwäbisch is a High German dialect, belonging to the Alemannic family, spoken by just over 800,000 people. Two communities: • Stuttgart area • Schwäbisch Gmünd
Beaman – Language, Place and Periphery – University of Copenhagen – January 2018
Page 4
Two Speech Communities Stuttgart
Schwäbisch Gmünd
Beaman – Language, Place and Periphery – University of Copenhagen – January 2018
Page 5
Corpus and Current Sample 1982
2017
40 speakers
24 speakers 16 speakers Stuttgart Gmünd Panel Study
72 speakers
36 speakers 36 speakers Stuttgart Gmünd
13 speakers Beaman – Language, Place and Periphery – University of Copenhagen – January 2018
Page 6
Linguistic Variables being Investigated Level Phonological
Morpho-syntactic
Description
Variation (SWG ~ STD)
1
STP – /-st/ Palatalisation
[∫t] ~ [st]
2
AIS1 – /ai/ Diphthong Shift
[ɔi] ~ [ai]
3
ANN – /an/ Nasalisation
[ã] ~ [an]
4
FRV1 – /ö/ Vowel Shift
[e] ~ [ö]
5
LEO – Long /e/ Opening
[ä] ~ [e]
6
EDP – Plural Inflection
[ed] ~ [en]
7
IRV1 – Irregular Verb ‘gehen’
[gangəd] ~ [ge:ən]
8
IRV3 – Irregular Verb ‘haben’
[hen] ~ [habən]
Examples (SWG ~ STD) [fɛ∫t] ~ [fɛst] Fest ‘party’ [gləin] / [glɔin] ~ [klain] klein ‘small’ [mã kã] ~ [man kan] man kann ‘one can' [meglɪç] ~ [møːklɪç] möglich ‘possible’ [i læsə] ~ [ɪç leːzə] ich lese ‘I read’ [mɪr ma:xəd] ~ [vɪr ma:xən] wir machen ‘we do/make’ [mɪr gangəd] ~ [vɪr ge:ən] wir gehen 'we go' [mɪr hen] ~ [vɪr habən] wir haben 'we have'
9
SAF1 – Diminutive Affix ‘le’
-le ~ -lein/-chen
bissle ~ bisschen 'little‘
10
PVB – Periphrastic Verb ‘tun’
däd ~ würde
es däd beeinflusse ~ es würde beeinflussen ‘it should influence'
Beaman – Language, Place and Periphery – University of Copenhagen – January 2018
Page 7
Social Factors being Investigated Fixed Effects: 1. Recording Year – 1982 and 2017 2. Community – Gmünd and Stuttgart 3. Gender – male and female 4. Swabian Orientation – continuous scale from 1 to 5 5. Individual Mobility – continuous scale from 1 to 5
Random Effects: Interviewer Name – five interviewers Speaker ID – 13 speakers, 26 interviews Beaman – Language, Place and Periphery – University of Copenhagen – January 2018
Page 8
Swabian Orientation Index (SOI) Swabian Allegiance:
Swabian Cultural Competence:
1-1. Self-Declared Swabian: Are you a ‘real’ Swabian?
3-1. Swabian Knowledge: Are there different Swabian dialects?
5=definitely, 4=maybe, 3=don't know, 2=not really, 1=no
1-2. Non-Swabian Friends: Do you have friends who are NOT Swabian? 5=no, 4=a few, 3=don't know, 2=many, 1=a lot
1-3. Swabian Ridicule: Do they laugh at how you speak? 5=always, 4=sometimes, 3=don't know, 2=not really, 1=not at all
1-4. Accommodation: Do you change how you speak? 5=not at all, 4=a little, 3=don't know, 2=a lot, 1=always
5=considerable, 4=some, 3=don’t know, 2=not much, 1=none
3-2. Swabian Specialties: Do you know how to make Spätzle? Maultaschen? 5=of course, 4=somewhat, 3=don’t know, 2=not well, 1=not at all
3-3. Swabian People & Jokes: Do you know [various well-known Swabians]? 5=of course, 4=somewhat, 3=don’t know, 2=not well, 1=not at all
3-4. Swabian Activities: Do you participate in Hocketse & local activities? 5=always, 4=some, 3=don’t know, 2=not much, 1=never
Swabian Language Attitudes:
Swabian Language Usage:
2-1. Opinion of Swabian Language: What do you think of the Swabian language?
4-1. Parents Speak Swabian: Do your parent speak Swabian?
5=super, 4=good, 3=don’t know, 2=not good, 1=awful
2-2. Job Prospects for Swabians: Is it difficult to find a job when you speak Swabian? 5=great, 4=good, 3=no impact/don’t know, 2=maybe some, 1=very difficult
2-3. Swabians Speaking German: Is it odd when a Swabian speaks standard German? 5=very odd/awful, 4=funny, 3=don’t know, 2=good, 1=great
2-4. Non-Swabians Speaking Swabian: Is it odd when a non-Swabian speaks Swabian? 5=very odd/awful, 4=funny, 3=don’t know, 2=good, 1=great
5=both, 3=one, 1=neither
4-2. Swabian with Friends & Family: Do you speak Swabian with …? 5=considerable, 4=some, 3=don’t know, 2=not much, 1=none
4-3. Swabian with Neighbors: Do you speak Swabian with …? 5=considerable, 4=some, 3=don’t know, 2=not much, 1=none
4-4. Swabian with Others: Do you speak Swabian with …? 5=considerable, 4=some, 3=don’t know, 2=not much, 1=none
e Mã, dr koi Spätzle mache kã, is koi richtige Mã. ein Mann, der kein Spätzle machen kann, ist kein richtiger Mann. a man, who can’t make Spätzle, is not a real man. Beaman – Language, Place and Periphery – University of Copenhagen – January 2018
Page 9
Positive SOI Examples Annelise-1982: e echter Schwââb isch ôifach so ôiner, der sich als Schwââb fühlt. ‘a real Schwab is simply someone who feels like a Schwab.‘ Louise-2017: i bin e Schwââb und bleib ôiner. ‘I‘m a Schwab and will stay one.’
Beaman – Language, Place and Periphery – University of Copenhagen – January 2018
Page 10
Examples of Changing SOI Ricarda-1982: die Annie zum Beispiel, derer gfällt s net, wenn i schwäbisch schwätz. es würd net zu mir passe. sie meint schweitzerisch oder österreichisch würd besser zu mir passe. des würd sich so lätschig anhöre. ‘Annie for example, doesn‘t like it when I speak Swabian. It doesn‘t go with me. She thinks Swiss German or Austrian German would go better with me. It would sound so slouchy.‘ Pepin-2017: von dem her war i mal typisch, und zum Glück nimme so arg. ‘[As a real Schwab] I was typical, and luckily not so much anymore.’ Beaman – Language, Place and Periphery – University of Copenhagen – January 2018
Page 11
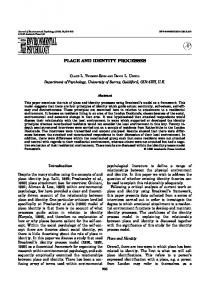
Swabian Mobility Index (SMI) Geographic distance from residence to workplace, weighted by number of years in each location. Beaman – Language, Place and Periphery – University of Copenhagen – January 2018
Page 12
The Methods • Sociolinguistic Interviews ―Labovian-style, casual interview questions
• Transcription/Annotation ―Native Swabian speakers ―Transcription Guidelines and Swabian Orthography ―Reviewed/Corrected by Principal Investigator
• Quantitative Analyses: ―Dialect Density Measure (DDM) ―Generalized Linear Mixed Models with Random Effects (GLMER)
• Qualitative Assessment: ―Quasi-Ethnographic Investigations Beaman – Language, Place and Periphery – University of Copenhagen – January 2018
Page 13
Dialect Density
DIALECT
• All but one speaker show significant dialect attrition
+
• Greater loss of morpho-syntactic variables than phonological ones • Greater diversity in across speakers in use of dialect variants in 2017
STANDARD
Beaman – Language, Place and Periphery – University of Copenhagen – January 2018
Legend: Orange – Women Blue – Men
Page 14
Main Effects for Five Social Factors n= 13 speakers 26 recordings 10 variables 22,559 tokens
Margin of Error: Percent that the differences between the probabilities may vary up or down
Significance levels: *** 0.001 ** 0.01 * 0.05 . 0.1
Random Effects Speaker ID Interviewer Name
lodds prob 0.2457 56.1% 0.2421 56.0% UNIVARIATE MAIN EFFECTS Factors spkrs weight lodds prob Year 1982 13 .638 0.0275 50.7% 2017 13 .362 -0.7949 31.1% Orientation lowest (2.1) 11 .371 -0.8984 28.9% highest (4.5) 15 .629 -0.0604 48.5% Mobility lowest (1.0) 17 .585 -0.0475 48.8% highest (5.0) 9 .415 -1.0731 25.5% Gender Men 12 .444 -0.6201 35.0% Women 14 .556 -0.1862 45.4% Community Gmünd 14 .507 -0.1399 46.5% Stuttgart 12 .493 -0.6745 33.8%
Beaman – Language, Place and Periphery – University of Copenhagen – January 2018
diff
merr sig
-19.6%
4.1% ***
19.6%
2.4% ***
-23.3%
2.7% ***
10.4% 11.9%
.
-12.8% 19.1% Page 15
Year and Gender Random Effects Speaker ID Interviewer Name Year Gender 1982 Men (Intercept) Women 2017 Men Women
lodds prob 0.3874 59.6% 0.3439 58.5% INTERACTION EFFECTS spkrs lodds prob diff merr sig 6 0.0044 50.1% 0.6% 19.2% 7 0.0286 50.7% 6 -1.5527 17.5% 21.3% 17.3% * 7 -0.4576 38.8%
Beaman – Language, Place and Periphery – University of Copenhagen – January 2018
Page 16
Swabian Orientation
ntation er Year Orientation Gender spkrs Orientation spkrs lodds lodds prob spkrs probdiff lodds merr diff prob sigmerr sigdiff (mean 1982 Low3.4) (mean Men3.4) 1 -0.0265 Low 1(mean -0.0265 49.3% 3.4) 49.3% 1 -0.0265 49.3% 0.9% 11.4% 0.9% 11.4% 0.9% (mean High4.1) (mean 4.1) 5 High 0.0106 5(mean 0.0106 50.3% 4.1) 50.3% 5 0.0106 50.3% en (mean Low3.6) (mean Women 3.6) 3 -0.1136 Low 3(mean -0.1136 47.2% 3.6) 47.2% 3 -0.1136 47.2% 6.2% 12.9% 6.2% 12.9% 6.2% (mean High4.3) (mean 4.3) 4 High 0.1352 4(mean 0.1352 53.4% 4.3) 53.4% 4 0.1352 53.4% (mean 2017 Low3.0) (mean Men3.0) 4 -1.9697 Low 4(mean -1.9697 12.2% 3.0) 12.2% 4 -1.9697 12.2% 20.5% 20.5% 9.3% *** 9.3% 20.5% *** (mean High4.0) (mean 4.0) 2 -0.7187 High2(mean -0.7187 32.8% 4.0) 32.8% 2 -0.7187 32.8% en (mean Low3.0) (mean Women 3.0) 3 -1.1905 Low 3(mean -1.1905 23.3% 3.0) 23.3% 3 -1.1905 23.3% 29.0% 29.0% 12.9% 12.9% *** 29.0% *** (mean High4.2) (mean 4.2) 4 High 0.0920 4(mean 0.0920 52.3% 4.2) 52.3% 4 0.0920 52.3%
merr sig 11.4% 12.9% 9.3% ***
Legend: Legend: Orange –– Women Women inin 1982 1982 Orange Red –– Women Women inin 2017 2017 Red Green – Men in 1982 Blue –– Men Men inin 2017 2017 Blue
12.9% ***
Beaman – Language, Place and Periphery – University of Copenhagen – January 2018
Page 17
Workplace Mobility Year Gender Mobility spkrs 1982 Men Low (mean 1.0) 5 High (mean 1.9) 1 Women Low (mean 1.0) 7 NA 0 2017 Men Low (mean 1.2) 2 High (mean 3.3) 4 Women Low (mean 1.2) 3 High (mean 3.3) 4
lodds 0.0343 -0.1448 0.0286 NA -0.8711 -1.8935 0.0910 -0.8692
Beaman – Language, Place and Periphery – University of Copenhagen – January 2018
prob diff merr sig 50.9% -4.5% 11.2% 46.4% 50.7% NA NA NA 29.5% -16.4% 8.5% *** 13.1% 52.3% -22.7% 6.9% *** 29.5% Page 18
Variable Usage by Year Morpho-syntactic Variables
Phonological Variables INTERACTION EFFECTS with RECORDING YEAR Varbl Year n lodds prob diff merr STP 1982 2757 1.1690 76.3% -17.6% 12.1% 2017 3463 0.3504 58.7% AIS1 1982 2013 -1.6104 16.7% -12.5% 6.2% 2017 2741 -3.1309 4.2% ANN 1982 1756 -0.3135 42.2% -23.2% 12.2% 2017 1863 -1.4504 19.0% FRV1 1982 606 -0.8642 29.7% -21.2% 9.8% 2017 661 -2.3847 8.4% LEO 1982 575 -0.7152 32.8% -17.1% 11.4% 2017 978 -1.6766 15.8%
sig ** *** *** *** **
Varbl EDP
IRV1 IRV3 SAF1 PVB
INTERACTION EFFECTS with RECORDING YEAR Year n lodds prob diff merr 1982 544 2.3765 91.5% -40.8% 13.0% 2017 612 0.0266 50.7% 1982 227 0.5554 63.5% -46.6% 17.4% 2017 295 -1.5925 16.9% 1982 636 0.2719 56.8% -42.4% 14.1% 2017 1203 -1.7861 14.4% 1982 673 -0.3670 40.9% -17.7% 12.0% 2017 746 -1.1964 23.2% 1982 103 0.7395 67.7% -45.1% 12.5% 2017 107 -1.2340 22.6%
Beaman – Language, Place and Periphery – University of Copenhagen – January 2018
sig
*** *** *** ** ***
Page 19
Variable Usage by Community Morpho-syntactic Variables
Phonological Variables INTERACTION EFFECTS with COMMUNITY diff merr Varbl Community n lodds prob STP Gmünd 3395 0.9277 71.7% -7.9% 20.3% Stuttgart 2825 0.5637 63.7% AIS1 Gmünd 2601 -1.3583 20.5% -17.7% 12.6% Stuttgart 2153 -3.5518 2.8% ANN Gmünd 1982 -0.8483 30.0% -1.5% 17.5% Stuttgart 1637 -0.9213 28.5% 744 -0.6121 35.2% FRV1 Gmünd -29.5% 20.0% Stuttgart 523 -2.8056 5.7% 729 -0.6507 34.3% LEO Gmünd -20.5% 19.7% Stuttgart 824 -1.8320 13.8%
sig
**
Varbl EDP IRV1 IRV3
** *
SAF1 PVB
Beaman – Language, Place and Periphery – University of Copenhagen – January 2018
INTERACTION EFFECTS with COMMUNITY Community n lodds prob diff merr Gmünd 681 1.6137 83.4% -16.1% 19.2% Stuttgart 475 0.7207 67.3% Gmünd 312 0.8337 69.7% -58.8% 29.0% Stuttgart 210 -2.0961 11.0% Gmünd 990 -0.2737 43.2% -22.1% 23.3% Stuttgart 849 -1.3211 21.1% Gmünd 855 -0.6207 35.0% -7.5% 20.0% Stuttgart 564 -0.9696 27.5% Gmünd 134 0.9161 71.4% -54.7% 26.2% Stuttgart 76 -1.6045 16.7%
sig
*** .
***
Page 20
Linguistic Variables by Community and Year Gmünd-1982 Gmünd-1982 Gmünd-1982 Average-1982 Average-1982
Gmünd-2017 Gmünd-2017 Stuttgart-1982 Stuttgart-1982 Stuttgart-1982 Average-2017
Stuttgart-2017 Stuttgart-2017
Beaman – Language, Place and Periphery – University of Copenhagen – January 2018
Page 21
Legend:
Speaker Dialect Attrition
Beaman – Language, Place and Periphery – University of Copenhagen – January 2018
Dialect Use in 2017 Attrition since 1982
Page 22
Some Ethnographic Insights • Opposing World Views: ―Rupert, Ph.D. sociologist and consultant, traveling nationally – 28% DDM attrition ―Angela, medical doctor specializing in childhood disabilities – 4% DDM attrition
• Differing Identities: ―Ricarda, local kindergarten teacher in Stuttgart (Waldorf School) – 27% DDM attrition ―Elke, local kindergarten teacher in small town outside of Gmünd – 2% DDM attrition
• Changing Mobilities: ―Markus, marketing manager for an IT company in Munich – 43% DDM attrition ―Annelise, medical doctor now working in Zurich – 21% DDM attrition
Beaman – Language, Place and Periphery – University of Copenhagen – January 2018
Page 23
In Summary • Dialect attrition occurs over time, but is driven or inhibited by factors such as Orientation and Mobility. • Swabian features index identity, Gmünders versus Stuttgarters • Morpho-syntactic variables have receded more than phonological • The Gender Effect is particularly significant for this group of speakers ―The women are more influenced by Orientation ―The men are more impacted by greater Mobility
Beaman – Language, Place and Periphery – University of Copenhagen – January 2018
Page 24
Next Steps • Expand the Panel Study to incorporate 6-10 more speakers • Incorporate a Trend Study to assess change across generations • Further evaluate the Gender Effect and ‘change from above’ • Further investigate interaction between Orientation and Mobility • Integrate a social network analysis and impact on dialect change • Add additional Swabian linguistic variables and investigate patterns • Evaluate acoustic properties on the changes in the vowels/diphthongs
Beaman – Language, Place and Periphery – University of Copenhagen – January 2018
Page 25
Thank You SPECIAL THANKS TO: Peter Auer, Harald Baayen, Jenny Cheshire, James Garrett, Gregory Guy, Michael Ramscar, Fabian Tomaschek for review and feedback on the statistics, findings, and presentation; any deficiencies remaining are, of course, my own. CONTACT INFORMATION: Karen V. Beaman Queen Mary, University of London Eberhard Karls University of Tübingen www.karenbeaman.com
[email protected] +49 152 5468 7070 Beaman – Language, Place and Periphery – University of Copenhagen – January 2018
Page 26
Karen Close Not-Close
Interviewer Effect Stuttgarter Area
Schwäbisch Gmünd Rupert
1982 Angela
Egbert
Herbert
2017
Markus
Louise
Annelise
Egbert
Herbert Annelise
Bertha
Pepin
Rupert Angela
Manni
Ricarda
Ema
Elke
Elke Louise
Markus
Beaman – Language, Place and Periphery – University of Copenhagen – January 2018
Manni
Ricarda
Ema Pepin
Bertha
Page 27
Five Individual Social Models Recording Year:
Orientation:
Mobility:
Gender:
Community:
Fixed effects: Estimate Std. Error z value Pr(>|z|) (Intercept) 0.20067 0.21001 0.956 0.339 dum_yr -1.19728 0.08346 -14.346 |z|) (Intercept) -0.94419 0.21127 -4.469 7.85e-06 *** SOIR 1.11074 0.05039 22.041 < 2e-16 *** Fixed effects: Estimate Std. Error z value Pr(>|z|) (Intercept) -0.07554 0.22835 -0.331 0.741 SMIR -0.66518 0.05643 -11.787 |z|) (Intercept) -0.5847 0.3128 -1.869 0.0616 . spk_genderW 0.4593 0.2972 1.545 0.1223
Fixed effects: Estimate Std. Error z value Pr(>|z|) (Intercept) -0.2991 0.3656 -0.818 0.413 spk_communityStuttgart -0.1401 0.4709 -0.298 0.766
Beaman – Language, Place and Periphery – University of Copenhagen – January 2018
Page 28
Social Model with Interaction Effects
Fixed effects: Estimate Std. Error z value Pr(>|z|) (Intercept) 0.3031 0.5366 0.565 0.572191 dum_yr -0.6943 0.2516 -2.759 0.005790 spk_communityStuttgart -2.2155 0.5780 -3.833 0.000127 spk_genderW 1.1690 0.4125 2.834 0.004600 SMIR -0.3844 0.1950 -1.971 0.048683 SOIR 0.5350 0.2199 2.432 0.014995 spk_genderW:SOIR -2.0432 0.2399 -8.518 < 2e-16 spk_communityStuttgart:SOIR 2.1122 0.3151 6.702 2.05e-11 dum_yr:SOIR -0.1740 0.2543 -0.684 0.493970 dum_yr:spk_genderW 0.9682 0.1187 8.155 3.49e-16 spk_genderW:SMIR -0.3694 0.2138 -1.727 0.084079 --Beaman – Language, Place and Periphery – University Copenhagen – January Signif. of codes: 0 ‘***’ 0.001 2018 ‘**’ 0.01 ‘*’ 0.05 ‘.’ 0.1 ‘ ’ 1
** *** ** * * *** *** *** .
Page 29
Fixed effects:
Linguistic Model > LINGSUM