Dr. Mark A. Lee, School of Business, Trinity Western University ... Dr. Liang-Chieh (Victor) Cheng, College of Technology, University of Houston, Texas, USA ... CASE STUDY: ADMINISTRATOR AND FACULTY SALARY COMPARISONS.
IJSM, Volume 15, Number 2, 2015
ISSN: 1555-2411
INTERNATIONAL JOURNAL OF ® STRATEGIC MANAGEMENT
EDITOR-In-CHIEF
Dr. Mark A. Lee, School of Business, Trinity Western University
A Publication of the
International Academy of Business and Economics®
.
IABE EU
1
IJSM, Volume 15, Number 2, 2015
ISSN: 1555-2411
EDITORIAL BOARD Dr. David Ward, European School of Economics, Milan, Italy Dr. Moshe Zviran, Tel Aviv University, Tel Aviv, Israel Dr. Bhavesh Patel, Ahmedabad University, Ahmedabad, Gujarat, INDIA Dr. Vishnuprasad Nagadevara, Indian Institute of Management, Bangalore, India Dr. Scott K. Metlen, University of Idaho, Moscow, Idaho, USA Dr. Fred N. Silverman, Pace University, White Plains, New York, USA Dr. Benoy Joseph, Cleveland State University, Cleveland, Ohio, USA Dr. Premilla D'Cruz, Indian Institute of Management, Ahmedabad, INDIA Dr. Alain Nurbel, University of La Reunion, CERESUR, France Dr. Anand Desai, Ohio State University, Columbus, OH, USA Dr. Xiaolin Xing, National University of Singapore, Singapore Dr. Chun Hung Roberts Law, Hong Kong Polytechnic University, Hong Kong, China Dr. Aharon Tziner, Dean, Netnaya University College, Netnaya, Israel Dr. C.B. Claiborne, Texas Souther University, Houson, Texas, USA Dr. Byron J. Hollowell, Pensylvania State University, Pensylvania, USA Dr. Michael Benham, European Business School, Germany Dr. Palaniappan Thiagarajan, Jackson State University, Jackson, USA Dr. Kevin K. F. Wong, Hong Kong Polytechnic University, Hong Kong, China Dr. Lokman Mia, Griffith University, Brisbane, Queensland, Australia Dr. Marek Cwiklicki, Cracow University of Economics, Krakow, Poland Dr. Sutana Boonlua, Mahasarakham Business School, Mahasarakham University Thailand Dr. Ironildes Bueno Da Silva, Catholic University Of Brasilia, Brasilia, Brazil Dr. Christine Duller, Johannes Kepler University Linz, Austria Dr. Silvio Bianchi Martini, University Of Pisa, Pisa, Italy Dr. Riccardo Sartori, University of Verona, Verona, Italy Dr. R. Raghavendra Kumar Sharma, Department of Industrial and Management, Engineering, IIT, Kanpur, India Dr. Flores Isaura, University of North Texas at Dallas, Texas, USA Dr. Joel Shulman, Babson College, Massachusetts, USA Dr. Nashwa Geroge, Larry L. Luing School of Business, Accounting and Finance, Faculty, Berkeley College, USA Dr. Jose Sanchez-Gutierrez, Head of Department of Marketing and International Business, Universidad de Guadalajara, Mexico Dr. Eric K. Wai Lau, BBA Marketing & Information Management Program Leader, Dept. of Marketing, City University of Hong Kong Dr. James Henson, Department of Information Systems & Decision Sciences, California State University, Fresno, USA Dr. Sathasivam Mathiyalakan, Dept. of Accounting & MIS, School of Business & Economics, Winston Salem State University Dr. Farrokh Mamaghani, School of Business, St. John Fisher College, Rochester, NY Dr. Liang-Chieh (Victor) Cheng, College of Technology, University of Houston, Texas, USA Dr. Neil Terry, Dean of the College of Business & Professor of Economics, West Texas A&M University, USA
The IJSM is a Registered Trademark of the IABE. The IJSM is a publication of the International Academy of Business and Economics. All rights reserved. ©2015 IABE. WWW.IABE.ORG
Disclaimer: IABE/AIBE or its representatives are not responsible any error(s), validity of data/conclusion(s) or copyright infringements in any article published in the journal. Author(s) is/are solely responsible for the entire contents of the paper published in the journal.
2
IJSM, Volume 15, Number 2, 2015
ISSN: 1555-2411
A Welcome Note from the Editor-In-Chief: It is our pleasure to present the International Journal of Strategic Management (IJSM), Volume 15, Number 2, 2015 issue. IJSM is a publication of the Academy of International Business and Economics. The IJSM has the ISSN (ISSN: 1555-2411) and Call Number HD30.28 1553 issued by the Library of Congress, Washington. The academic foundations and real-world applications related to business and economics are rapidly changing. Challenges for everyone are increasing daily. IJSM presents a perspective on these developments and we like to thank all authors who submitted papers in this issue. Help us get IJSM on more library shelves, starting with yours and donate the issue you are currently holding to your library. Give more visibility to your own research and share IJSM with a colleague or friend. We invite you to give us some feedback. If you have suggestions for future improvement, we’d like to hear from you. As usual, we hope to have the privilege of reviewing your work in the near future. Consult IJSM deadlines and guidelines at our website, www.iabe.org. All submitted work to the Journal goes through a double blind peer-review process of experts in the functional area. We wish to thank the scholars who contributed their time and expertise as reviewers for this issue. We are grateful to them and to our board members for donating their time for the cause of academics and research that makes this Journal possible. Our reviewers are a diverse group, from many academic areas and from many countries. We appreciate their dedication and especially for their work under very tight deadlines. We look forward to a challenging but bright future for IJSM, with your help. Best wishes!
Best regards, Dr. Mark A. Lee
Editor-In-Chief
The IJSM is a publication of the International Academy of Business and Economics. All rights reserved. ©2015 IABE. WWW.IABE.ORG Printed and Published in USA. Disclaimer: IABE/AIBE or its representatives are not responsible any error(s), validity of data/conclusion(s) or copyright infringements in any article published in the journal. Author(s) is/are solely responsible for the entire contents of the paper published in the journal.
3
IJSM, Volume 15, Number 2, 2015
ISSN: 1555-2411
TABLE OF CONTENTS Page
ASSESSMENT OF A TRAINING PROGRAM: EMPLOYEES ATTITUDES TO CREATIVITY AND INNOVATION
7
Gavin Suss, Keter Group CASE STUDY: ADMINISTRATOR AND FACULTY SALARY COMPARISONS
23
Michael Cosgrove, University of Dallas, Texas, USA Blake Frank, University of Dallas, Texas, USA WHAT ARE THE FACTORS AFFECTING A FIRM’S ABILITY TO INNOVATE?
29
Christine Custis, Shenandoah University Jigish Zaveri, Morgan State University Xingxing Zu, Morgan State University Gregory Ramsey, Morgan State University Nathan Austin, Morgan State University THE IMPACT OF EMPLOYEE DIVERSITY ON IT BUSINESS VALUE
57
Shady Fraiha, American University of the Middle East, Kuwait CREATING A LOGISTICAL-MEGA-GATEWAY: THE EMIRATE OF DUBAI POTENTIALS
69
Dr. Syd Gilani, Dubai Maritime Authority, Government of Dubai, United Arab Emirates Shahrin Osman, DNV GL Maritime, Dubai, United Arab Emirates SOCIAL MEDIA IN HUMAN RESOURCE MANAGEMENT
85
Ralph E. McKinney, Jr. Marshall University, Huntington, WV, USA Lawrence P. Shao, Slippery Rock University, Slippery Rock, PA, USA Dale H. Shao, Marshall University, Huntington, WV, USA CULTURAL ADAPTATION OF EXPATRIATE MANAGERS - EMPIRICAL INSIGHTS FROM THE MIDDLE EAST
91
Hanan Al Mazrouei, United Arab Emirates University, UAE James Thomas Kunnanatt, United Arab Emirates University, UAE Robert Zacca, Alfaisal University, Kingdom of Saudi Arabia GDP GROWTH RATES OF MEXICO, USA AND CANADA BEFORE AND AFTER THE INTERNATIONAL TREATY: NAFTA Rolando Pena-Sanchez, Texas A&M International University, USA
5
103
IJSM, Volume 15, Number 2, 2015
ISSN: 1555-2411
CASE STUDY: ADMINISTRATOR AND FACULTY SALARY COMPARISONS Michael Cosgrove, University of Dallas, Texas, USA Blake Frank, University of Dallas, Texas, USA
ABSTRACT This study examines the salary relationship between the top administrators and three faculty ranks at a small liberal arts university classified as IIA in the WSC region. The university encountered a period of financial hardship and this study examines the change in salaries among the groups during that time. Top administrator salaries had a major salary increase over the study period compared to full professor salaries. However, administrator salaries did not diverge much from the trend of associate and assistant professor salaries. Full professors may be less mobile than associate and assistant professors and are perhaps, in general, older than the average of faculty at the assistant and associate professor ranks. It appears that during the period of financial hardship, university administrators selected the full professor faculty segment as the one to take a sizable financial hit. Full professors may be the least mobile and the university needed to remain competitive in terms of salary at the assistant level in order to hire new faculty. In practical terms full professors, on average, took a sizeable purchasing power hit compared to other faculty groups, and university-funded contributions to their 403b accounts were similarly smaller. All these factors may result in older faculty working longer than planned. Keywords: Administrator salaries, Faculty salaries, Differences, Academic Ranks, Purchasing Power
1. INTRODUCTION A subject that is of both practical and theoretical interest to academicians is the relationship between the salaries of top administrators at a university and the faculty by rank. The University at issue is a small liberal arts university classified as IIA located in the West South Central region. This University had major financial issues over a 10-plus year period, which resulted in a one-time reduction in both salaries and benefits for faculty and staff and no or small upward salary adjustments for several years. Those no or small upward salary adjustments affected some faculty ranks more than others.
2. THEORY In for-profit entities the principal and agent relationship is assumed to reflect profit maximizing objectives of the entity. The CEO or agent is hired to advance the interest of the principals, the owners of the firm. The relationship among agents and principals are complex as shareholders may have different views depending on many issues including whether the shareholders are institutions or households and their tax status. Agency theory is less clear in the not-for-profit sector, in particular in the case of private liberal arts universities. The principals and agents in a not-for-profit private university do not expect to make a profit and there is no concern that the university will be bought or sold. The shutdown option, however, does become an option in times of extreme financial duress. University donors, according to Olson (2000), may be the principals and expect a return from their investment and may invest elsewhere if their expected returns are not met. Board members at universities may be substantial donors and in addition do not receive pay for their service. Board members may therefore be acting as principals and may have a special interest in financial management and control of a university.
23
IJSM, Volume 15, Number 2, 2015
ISSN: 1555-2411
O’Connell (2005) examined the principal-agent relation between institution performance and executive pay for liberal arts colleges and found that chief executive officers’ pay depended on factors such as the entity’s academic reputation and faculty salaries. His findings suggested that there is a positive significant relationship between the reputation of the college and the salary of the president. O’Connell also found a positive significant relationship between faculty salaries and the salary of the president. O’Connell also suggests that colleges with strong reputations have graduates that contribute to the college which leads to faculty having higher salaries. He suggests too that strong alumni support can make the job of the president easier, leading to lower compensation for the president. Other general approaches utilized to try and understand non-profit behavior include stewardship theory (Van Slyke, 2007) and stakeholder analysis (Chapleo & Simms, 2010.)
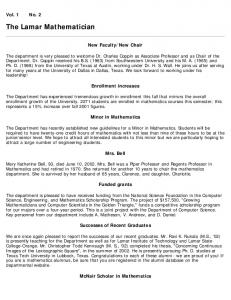
3. ANALYSIS The approach we chose was to compare the average of the top two highest paid executives at this IIA University to the average salaries of the professors by rank for the time period 2003 to 2013. This time period captures most of the financial difficulties and part of the recovery. We chose the two highest executive salaries instead of only the president since we are comparing salaries over time and the university had changes at the presidential level. In addition, for each of the faculty ranks of full, associate and assistant we are using the population mean salary of each rank and comparing that mean to the mean salary of the two highest paid executives at the university. The idea was to determine how the relationships held at this one university over the time period of financial issues. Since we are comparing salaries over time, all salaries were deflated by the CPI to also allow for purchasing power comparisons. 3.1 Full Professors The dollar difference between the average of the top two executive salaries and the average full professor salary is higher at the end point 2013 compared to beginning point of 2003 by $12,000. But in some of the intervening years the difference was much larger. The cumulative difference dollar amount over the 10-year period was $67,000, which says relative to 2003 the average salary of the top two executives increased by a cumulative $67,000 compared to the average full professor salary, graph 1. This compares the average to the average. However from 2004 to 2008 the average of the two top executives shared in some of the financial difficulties.
24
IJSM, Volume 15, Number 2, 2015
ISSN: 1555-2411
Graph 1. AVERAGE OF TOP TW O EXECUTIVE SALARIES MINUS FULL PROF 230 220
Difference between the average of top two executive salaries and full professor salaries
All salaries are deflated $223
210 (000) 200 190
The cumulative difference between the average of the top 2 executive salaries and the average full professor salary is $67000 compared to the 2003 base year difference
$192
180 $180 170 160
University = W SC IIA university
Source: Academe & Form 990 03
04
05
06
07
08
09
10
11
12
13
The university hired a new president and the change in the base salary of new president in 2009 over the previous president accounted for much of the difference in cumulative salaries from 2003-2013. Perhaps some portion of that cumulative difference between the averages of the top two executives at the university to the average full professor salary came from the pool of money utilized to compensate full professors. Full professors had a cumulative $78,000 purchasing power loss over 10 years due to not staying even with the increase in the CPI, Graph 2. The associate professors at the University had an equivalent loss of $19,000 while the assistant professors had an equivalent loss of $10,000 over the same time period. It is clear from the public salary information that the primary hit to purchasing power was taken by the average full professor. It varies from full professor to full professor but, in general, the average full professor is perhaps less mobile than either the average associate or assistant professor. University administrators may have allocated monies available for salary increases on the basis of the perceived degree of mobility and hiring needs as assistant professors had the smallest purchasing power loss while full professors had the largest. University officials responded to the marketplace in allocating monies by faculty rank. The cumulative purchasing power loss for the average professor by rank over this time period assumes that someone was full professor at the beginning of the study and full professor at the end of the study period. The same assumption holds for the other two ranks. Prior studies have reviewed both faculty rank purchasing power trends and faculty salary compression issues (Cosgrove, Frank and Marsh, 2011) and (Cosgrove and Frank, 2014.) Average salaries of full, associate and assistant professors at WSC IIA schools stayed even with or slightly ahead of inflation over the past 10-plus years. Associate professors stayed even with inflation while full and assistant professor salaries increased by a total of approximately $2000 relative to inflation over that 10 plus years. O’Connell suggested in his study that there was a positive significant relationship between faculty salaries and salaries of the president. At this university there is not a positive relationship between the average of full professor salaries and the average of the top two executive salaries.
25
IJSM, Volume 15, Number 2, 2015
ISSN: 1555-2411
Graph 2. INFLATION-ADJUSTED FULL PROFESSOR SALARIES
82
$80.9
The inflation-adjusted purchasing power dollar loss to a full professor was $78,000 between 2003 and 2013 from not staying even with inflation
80 78
$80.3
76 $(000) 74 72 70 68 Source: Academe
$66.7
66 03
04
05
06
07
08
09
10
11
12
13
3.2 Associate Professors The dollar difference between the average of the top two executive salaries and the average associate professor salary increased by $10,000 at the end point 2013 compared to the beginning year, 2003. The cumulative dollar amount over the 10-year period was $8,900, graph 3. Between 2003 and 2008 the average salary of the top two executives narrowed compared to the average full professor. This implies that the two top executives shared in the financial difficulty. But the cumulative difference of $8,900 for associate professors is 13% of the financial hit that the average full professor took. Graph 3. AVERAGE OF TOP TW O EXECUTIVE SALARIES - ASSOCIATE PROF 230 All salaries are deflated$226 Difference between the average of top two executive 220 salaries and assocate professor salaries (000) 210 The cumulative difference between the $205 average of the top 2 executive salaries and the average associate professor salary 200 is $8900 compared to the 2003 base year difference 190
$195
180 Source: Academe & Form 990
170 03
04
05
06
07
08
26
University = W SC IIA university 09
10
11
12
13
IJSM, Volume 15, Number 2, 2015
ISSN: 1555-2411
3.3 Assistant Professors On a cumulative basis there is essentially no dollar difference between the average of the top two executive salaries and the average salary of assistant professors, graph 4. Clearly the university needed to hire assistant professors and to do that they needed to pay approximate market salaries. Graph 4. AVERAGE OF TOP TWO EXECUTIVE SALARIES - ASSISTANT PROF 240
230
220
All salaries are deflated Difference between the average of top two executive $231 salaries and assistant professor salaries (000)
210
200
The cumulative difference between the average of the top 2 executive salaries and the average assistant professor salary is $155 compared to the 2003 base year difference
$211
$203
190 University = WSC IIA university
Source: Academe & Form 990
180 03
04
05
06
07
08
09
10
11
12
13
4. SUMMARY A small private liberal arts university in the WSC region classified as IIA encountered a period of financial hardship. This study compared the average behavior of the top two university executive average salaries to the average salaries of three faculty ranks. Compared to the top two executives, the full professor rank had a major salary cumulative shortfall of $67,000 over the 2003 to 2013 period of this study. But the change in salaries among the assistant and associate professors did not diverge greatly from that of the top two executives. The cumulative shortfall was $8,900 for the associate rank and nearly no change for the assistant. University administrators apparently allocated salary monies on the basis of potential mobility and hiring needs. Full professors are, on average, likely the least mobile while assistant professors are the most mobile, and the university needed to be able to hire faculty at the assistant professor rank which meant salaries needed to be competitive. Full professors had a purchasing power loss of $78,000 compared to the CPI during the financial hardship era while the associate professor rank had an equivalent loss of $19,000 and $10,000 for assistant professors. Since the difference in the cumulative salary change for the average of the top two executives and the average of the assistant professors was essentially zero it can be said that the average of the top two executives also had a slight loss in purchasing power over the study period.
27
IJSM, Volume 15, Number 2, 2015
ISSN: 1555-2411
REFERENCES: American Association of University Professors, The Annual Report on the Economic Status of the Profession, March-April 2003 to March-April 2013. Chapleo, Chris and Simms, Christopher, “Stakeholder Analysis in Higher Education: A Case Study of the University of Portsmouth”, Perspectives: Policy & Practice in Higher Education, Volume 14, Issue 1, pp. 12-20.” Cosgrove, Michael, Frank, Blake, Marsh, Daniel, “Is There Salary Compression?” Review of Business Research, Volume 11, Number 5, 2011. Cosgrove, Michael, Blake, Frank, “Case Study: Salary Compression”, Journal of International Management Studies, Volume 14, Number 3, 2014. O’Connell, John F., “Administrative Compensation In Private Nonprofits: The Case of Liberal Arts Colleges”, Quarterly Journal of Business and Economics, Volume 44, No.1/2, pp. 3-12, 2005. Olson, David E., “Agency Theory in the Not-for-Profit Sector: Its Role at Independent Colleges”, Nonprofit and Voluntary Sector Quarterly, Vol. 29, No. 2, 280-296, June 2000. Van Slyke, David M., “Agents or Stewards: Using Theory to Understand the Government-Nonprofit Social Service Contracting Relationship”, Journal of Public Administration Research and Theory, Volume 17, pp. 157-187.
AUTHOR PROFILES: Dr. Michael Cosgrove earned his Ph.D. at Ohio State University. Currently he is professor, College of Business, University of Dallas. Dr. Blake Frank earned his Ph.D. at University of Houston. Currently he is associate professor, College of Business, University of Dallas.
28