Image Fusion Algorithm Assessment based on Feature Measurement Jiying Zhao and Robert Lagani`ere School of Information Technology and Engineering University of Ottawa 800 King Edward Ave. Ottawa, ON K1N6N5 Canada E-mail: (jyzhao, laganier)@site.uottawa.ca
Abstract This paper presents a new metric to assess the performance of the image fusion algorithm. The proposed metric is based on image phase congruency, which provides an absolute measurement of image feature with a numeric value ranging from zero to one. By comparing the local crosscorrelation of corresponding phase congruence maps of input images and fusion output, the quality of the fused result is assessable without a perfect reference. The preliminary experimental results on multi-focused image pairs demonstrate the efficiency of this approach.
1
Introduction
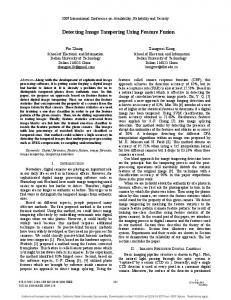
Pixel-level image fusion has been investigated in various applications and a number of algorithms have been developed and proposed. A typical fusion operation implemented at the pixel level is illustrated in Figure 1. The success of the post-processing or analysis relies largely on the efficiency of the particular fusion algorithm. However, few authors have addressed the problem of how to assess the efficiency of those algorithms and evaluate the resulting fused images objectively and quantitatively.
In such case, a cut and paste operation is applied to obtain the full-focused image that will serve as a reference for evaluating the fusion results. However, such operation does not assure a perfect reference image. In some applications, the ground truth reference can be generated from a more precise measurement [3]. Such comparison can only be applied after the acquired images are fully registered, i.e. converted to the same resolution, size, and format. The evaluation metric should be optimized for the image feature. Pixel-bypixel comparison does not meet the requirement, because in the original image pixels are closely related. Moreover, it would be better if the quantitative evaluation can still be achieved without the presence of reference image. This is the case of most practical applications. The evaluation metric should provide a measurement of how well the information of the inputs is integrated into the output. In this study, a new fusion quality index is proposed and implemented through the local cross-correlation of the phase congruency maps of the input images. Therefore, the image feature-based measure provides a blind evaluation of the fusion result, i.e. no reference image is needed. This metric takes the advantage of the phase congruency measure which provides a dimensionless contrast- and brightnessinvariant representation of image features. The fusion quality index is compared with recently developed blind evaluation metrics. The efficiency of the new metric is verified by the test on the fusion results achieved by several multiresolution pixel-level fusion algorithms.
2 2.1 Figure 1. Pixel-level image fusion. A typical example for pixel-level image fusion is the fusion of multi-focused images from a digital camera [6, 15].
Zheng Liu Institute for Aerospace Research National Research Council Canada Montreal Road 1200, Bldg M-14 Ottawa, ON K1A0R6 Canada E-mail:
[email protected]
Feature-based Assessment Image feature from phase congruency
Gradient-based image feature detection and extraction approaches are sensitive to the variations in illumination, blurring and magnification. The threshold applied needs to be modified appropriately. A model of feature perception named local energy was investigated by Morrone and
¯ are the average value of the two images. where A¯ and B As stated previously, a blind evaluation of the fused image is preferred for practical applications, because a ground truth or a perfect reference is not always available for comparison. The pixel-level fusion is to integrate image features like edges, lines, and region boundaries into one composite image. The success of the fusion algorithm will be assessed by the measure of the image features available in the fused image and those from multiple input sources. Phase E (x) congruency is used as the basis for the feature extraction (1) P C(x) = P n An (x) + ε and measurement. The flowchart in Figure 2 presents the p procedure to calculate the blind evaluation metric Pblind . (2) E (x) = F 2 (x) + H 2 (x) The phase congruency maps of the input and fused images are firstly calculated. A third feature map Mpc is dewhere P C (x) is the phase congruency at some location x rived by point-by-point maximum selection of the two input and E (x) is the local energy function. An represents the maps Apc and Bpc , i.e. retaining the larger feature points amplitude of the nth component in the Fourier series exMpc (i, j) = max (Apc (i, j) , Bpc (i, j)). The feature map pansion. A very small positive constant ε is added to the of the fused image, Fpc , is then compared to Apc ,Bpc , and denominator in case of small Fourier amplitudes. In the Mpc locally. At each sub-block, the cross-correlation values expression of local energy, F (x) is the signal with its DC between these maps are computed. The evaluation index P component removed and H (x) is the Hilbert transform of is the average over all the blocks. The flow chart is conF (x). trolled by three values: Apc , Bpc , and Fpc , and there is To extend the algorithm to images, the one-dimensional Dpc (k) = Apc (k) + Bpc (k). analysis is applied to several orientations and the results are combined in different ways. The 2D phase congruency can Again, when the local cross-correlation of the phase conbe expressed as [4]: gruency map is considered, the denominator in Equation 4 might be zero. However, this does not mean a low correP P lation. The summation of each block is considered in the Wo (x) ⌊Ano (x)∆Φno (x) − To ⌋ pc (x) = o n P P (3) flowchart of Figure 2: 1) when the input blocks are zero o n Ano (x) + ε (Dpc (k) = 0), the correlation result should be one if the fused block is zero too (Fpc (k) = 0 ); otherwise the crosswhere o denotes the index over orientation. The noise correlation value is set to zero; 2) when the fused block is compensation To is performed in each orientation indepennot zero, the cross-correlation value is computed with eidently. By simply applying the Gaussian spreading function ther of the input block that is not zero; 3) when both the across the filter perpendicular to its orientation, the oneinput and fused blocks are not zero (Dpc (k) 6= 0 ), the maxdimensional Gabor filter can be extended into two dimenimum of the cross-correlation of the fused block with Apc , sions. The orientation space can be quantified using a step Bpc , and Mpc is selected as the result. The overall crosssize of π/6, which results in 6 different orientations. For an PK 1 correlation value is:P = K extensive discussion of the underlying theory, readers are k=1 P (k) , where K is the total number of blocks. referred to reference [4, 5]. Herein, we use the maximum-selected feature map as 2.2 Evaluation metric part of the reference, because the feature can be compared through the dimensionless measure directly. Unlike pixels which are closely related in the original images, the points The comparison of images can be carried out by comin the phase congruency map indicate the salience of imparing their corresponding phase congruency features. It age feature. Therefore, the selection of feature points is not is appropriate to evaluate the space-variant features locally equivalent to the selection of pixels with larger value in the and combine them together [13, 14]. Cross-correlation can original image followed by the computation of the whole be one choice to measure the similarity between the feature phase congruency map. Selecting larger feature points can maps [8]. This value is computed by the zero-mean normalprovide a reference for comparison although this arrangeized cross-correlation (ZNCC) [8] in formula 4: ment is not always optimal. For the combinative fusion, es¢¡ ¢ PM PN ¡ pecially when heterogeneous sensors are involved, the fea¯ ¯ A (m, n) − A B (m, n) − B m=1 n=1 ture in the fused image may come from input images or a ZN CC = q ¢2 ¢ 2 PM PN ¡ PM PN ¡ ¯ ¯ combination of them, as shown in Figure 3. That is why B (m, n) − B A (m, n) − A · n=1 m=1 n=1 m=1 we need both the inputs and maximum-selected map for the (4) Owens [9]. This model postulates that features are perceived at points in an image where the Fourier components are maximally in phase. A wide range of feature types give rise to points of high phase congruency. With the evidence that points of maximum phase congruency can be calculated equivalently by searching for peaks in the local energy function, the relation between the phase congruency and local energy is established, that is [4, 5]:
Figure 2. The blind evaluation algorithm by using phase congruency map. similarity measure and comparison.
Figure 3. Four cases in a combinative fusion. For a small local region in the fused image, the local feature may come from the corresponding block of the input image A or B, or a combination of them.
3
Experimental Results
In the experiment, we use five pairs of multi-focused images for testing 1 The following algorithms are selected for comparison: Laplacian pyramid, gradient pyramid, ratio-of-lowpass (RoLP) pyramid, Daubechies wavelet four, spatially-invariant discrete wavelet transform (SIDWT), and Simoncelli’s steerable pyramid. The detailed implementation of these algorithms can be found in refer1 Courtesy
of SPCR Lab of Lehigh University and Ginfuku at Kyoto.
ences [1, 2, 12, 11, 7]. The basic fusion rule applied is averaging the low-frequency components while selecting the coefficients with larger absolute value in other frequency bands. The decomposition was carried out to level four and four orientational frequency bands were employed in the steerable pyramid implementation. The fused images were evaluated by Piella’s fusion quality index (Q) [10] and blind assessment method. The results are listed in Table 1 and the difference can be much easily identified from the proposed Pblind metric.
4
Summary
In this paper, we propose a new metric to assess the performance of mutliresolution image fusion algorithms. The metric is based on the local cross-correlation of image feature maps. The measurement of image feature is implemented with Kovesi’s phase congruency theory. Both the reference-based evaluation and blind assessment are carried out on the fusion of a group of multi-focused images.
References [1] E. H. Adelson, C. H. Anderson, J. R. Bergen, P. J. Burt, and J. M. Ogden. Pyramid methods in image processing. RCA
Lab book food Pepsi object
Table 1. Evaluation of the fusion result of multi-focused images. Assessment Lapacian Gradient Ratio-ofDaubechies SIDWT metric Pyramid pyramid lowpass wavelet (Haar) pyramid four Q 0.9566 0.9490 0.9178 0.9480 0.9627 Pblind 0.8505 0.8293 0.7331 0.8186 0.8466 Q 0.9474 0.9400 0.9253 0.9365 0.9569 Pblind 0.8159 0.7967 0.7094 0.7738 0.8236 Q 0.9803 0.9506 0.9771 0.9794 0.9829 Pblind 0.9098 0.8857 0.8916 0.9045 0.9098 Q 0.9667 0.9627 0.9342 0.9607 0.9711 Pblind 0.7612 0.7342 0.6691 0.7332 0.7662 Q 0.9629 0.9450 0.9559 0.9542 0.9693 Pblind 0.8534 0.8218 0.8051 0.7986 0.8356
[4]
[5] [6]
[7]
[8]
[9] [10]
[11]
[12]
Figure 4. The multi-focus images used for the test. From top to bottom: laboratory, books, Japanese food, Pepsi, and object. From left to right: full-focused image, left-focused image, and right-focused image.
[13] [14]
[15] Engineer, 29(6):33–41, 1984. [2] P. J. Burt and R. J. Kolczynski. Enhanced image capture through fusion. In Proceedings of 4th International Conference on Image Processing, pages 248–251, 1993. [3] D. S. Forsyth and J. P. Komorowski. NDT data fusion for
Steerable pyramid 0.9574 0.8585 0.9489 0.8268 0.9807 0.9124 0.9664 0.7936 0.9637 0.8471
improved corrosion detection. In X. E. Gros, editor, Applications of NDT Data Fusion. Kluwer Academic Publisher, 2001. P. Kovesi. Invarian Measures of Image Features from Phase Information. PhD thesis, University of Western Australia, May 1996. P. Kovesi. Image features from phase congruency. Videre: A Journal of Computer Vision Research, 1(3), 1999. H. Li, B. S. Manjunath, and S. K. Mitra. Multisensor image fusion using the wavelet transform. Graphical Models and Image Processing, 57(3):235–245, 1995. Z. Liu, K. Tsukada, K. Hanasaki, Y. K. Ho, and Y. P. Dai. Image fusion by using steerable pyramid. Pattern Recognition Letters, 22:929–939, 2001. J. Martin and J. L. Crowley. Experimental comparison of correlation techniques. In Proceedings of International Conference on Intelligent Autonomous Systems, 1995. M. C. Morrone and R. A. Owens. Feature detection from local energy. Pattern Recogntion Letters, 6:303–313, 1987. G. Piella and H. Heijmans. A new quality metric for image fusion. In Proceedings of International Conference on Image Processing, Bacelona, 2003. O. Rockinger. Image sequence fusion using a shift-invariant wavelet transform. In Proceedings of International Conference on Image Processing, volume 3, pages 288–301, 1997. A. Teot. Image fusion by a ratio of low-pass pyramid. Pattern Recognition Letters, 9:245–253, 1989. Z. Wang and A. C. Bovik. A universal image quality index. IEEE Signal Processing Letters, 9(8):81–84, 2002. Z. Wang, A. C. Bovik, H. R. Sheikh, and E. P. Simoncelli. Image quality assessment: from error measurement to structural similarity. IEEE Transactions on Image Processing, 13(1), 2004. Z. Zhang and R. S. Blum. Image fusion for a digital camera application. In Proceedings of 32nd Asilomar Conference on Signals Systems, and Computers, pages 603–607, Monterey, CA, 1998.