... [Ca2+]i in animal cells. (Campbell, 1983), but its use in plants has been limited to ... cell systems: giant salivary gland cells (Rose and Loewen- stein, 1975) ...
Imaging Calcium Dynamics in Living Plants Using Semi-Synthetic Recombinant Aequorins M a r c R. Knight, N i c k D. R e a d , A n t h o n y K. Campbell,* a n d A n t h o n y J. Trewavas Institute of Cell and Molecular Biology, University of Edinburgh, Edinburgh EH9 3JH, United Kingdom; and * Department of Medical Biochemistry, University of Wales College of Medicine, Cardiff CF4 4XN, United Kingdom
Abstract. The genetic transformation of the higher plant Nicotiana plumbaginifolia to express the protein apoaequorin has recently been used as a method to measure cytosolic free calcium ([Ca2+]i) changes within intact living plants (Knight, M. R., A. K. Campbell, S. M. Smith, and A. J. Trewavas. 1991. Nature (Lond.). 352:524-526; Knight, M. R., S. M. Smith, and A. J. Trewavas. 1992. Proc. Natl. Acad. $ci. USA. 89:4967-4971). After treatment with the luminophore coelenterazine the calcium-activated photoprotein aequorin is formed within the cytosol of the cells of the transformed plants. Aequorin emits blue light in a dose-dependent manner upon binding free calcium (Ca2+). Thus the quantification of light emission from coelenterazine-treated transgenic plant cells provides a direct measurement of [Ca2+]i. In this paper, by using a highly sensitive photoncounting camera connected to a light microscope, we have for the first time imaged changes in [Ca2+]i in response to cold-shock, touch and wounding in different tissues of transgenic Nicotiana plants. Using this ap-
proach we have been able to observe tissue-specific [Ca2+]i responses. We also demonstrate how this method can be tailored by the use of different coelenterazine analogues which endow the resultant aequorin (termed semi-synthetic recombinant aequorin) with different properties. By using h-coelenterazine, which renders the recombinant aequorin reporter more sensitive to Ca2÷, we have been able to image relatively small changes in [Ca2+]~ in response to touch and wounding: changes not detectable when standard coelenterazine is used. Reconstitution of recombinant aequorin with another coelenterazine analogue (ecoelenterazine) produces a semi-synthetic recombinant aequorin with a bimodal spectrum of luminescence emission. The ratio of luminescence at two wavelengths (421 and 477 nm) provides a simpler method for quantification of [Ca2+]~ in vivo than was previously available. This approach has the benefit that no information is needed on the amount of expression, reconstitution or consumption of aequorin which is normally required for calibration with aequorin.
QUORIN is a Ca2+-activated photoprotein normally produced by the marine jellyfish Aequorea victoria. The protein consists of a single polypeptide chain, apoaequorin, and a hydrophobic luminophore, coelenterazine. When Ca 2+ ions bind to this protein, the luminophore is discharged and a finite amount of blue light is emitted in a dose-dependent manner. For this reason aequorin has often been used as an indicator of cytosolic free calcium ([Ca2+]i) concentration (Campbell, 1983). Microinjected aequorin has been widely used for measuring [Ca2+]i in animal cells (Campbell, 1983), but its use in plants has been limited to photomultiplier measurements of large cells (Williamson and Ashley, 1982; Callaham and Hepler, 1991). Aequorin luminescence has been imaged in a few microinjected animal cell systems: giant salivary gland cells (Rose and Loewenstein, 1975), oocytes (Ridgeway et al., 1977; Gilkey et al., 1978; Eisen et al., 1984; Eisen and Reynolds, 1984; Miyazald et al., 1986; Fluck et al., 1991), amoebae (Cobbold, 1980), and neurons (Llifias et al., 1992).
We have recently developed a totally new approach for using aequorin for the measurement of [Ca2+]i in plants (Knight et al., 1991). We have produced transgenic Nicotiana plumbaginifolia plants which express apoaequorin (recombinant apoaequorin). Treatment of these plants with coelenterazine reconstitutes functional aequorin (recombinant aequorin) within the cytosol of their cells, thereby producing luminous plants whose light emission directly reports [Ca2+], This approach negates the need for large cells as a subject for study. Photomultiplier measurements of these plants has enabled us to detect rapid increases in [Ca2+]~ in response to wind (Knight et al., 1992), touch, cold-shock and fungal-elicitors (Knight et al., 1991). This work demonstrates that Ca2+could be involved in transducing the effects of these particular stimuli in plants. In this paper, we show that this approach can be greatly extended to allow for the first time both the imaging of [Ca2+]i changes in response to such stimuli in plants and also to provide a simple method to calibrate increases in
© The Rockefeller University Press, 0021-9525/93/04/83/8 $2.00 The Journal of Cell Biology, Volume 121, Number 1, April 1993 83-90
83
[Ca2÷]i. This involves the use of chemically synthesized analogues of coelenterazine (Shimomura et al., 1988, 1989, 1990; Shimomura, 1991), which endow the resultant aequorin (termed semi-synthetic aequorin; Shimomura et al., 1988) with modified properties. Microinjected semi-synthetic aequorin with a low sensitivity to Ca2÷ (n-aequorin) has been used to image very high Ca 2÷ concentrations in neuron cell microdomains (Llifias et al., 1992). We demonstrate here that this methodology can be applied to the recombinant aequorin system for measuring relatively small changes in [Ca2÷]~ concentration using a semi-synthetic recombinant aequorin (h-aequorin) which has a higher than normal sensitivity to Ca2÷. Another semi-synthetic aequorin has been described (e-aequorin) which has a bimodal spectrum of luminescence (Shimomura et al., 1988, 1989, 1990; Shimomura, 1991). The ratio between luminescence emission at two wavelengths, e.g., 421 and 477 nm, is proportional to free Ca 2+ so dual-wavelength luminometry provides a very simple method for calibration of calcium concentrations requiring no information on the amount of reconstituted aequorin. The advantage of applying this method in vivo is that [Ca2÷], calibration could be made without requiring knowledge of how much aequorin has been expressed, reconstituted or consumed unlike calibration at a single wavelength used for standard aequorin (Allen and Blinks, 1978; Blinks et al., 1979). We show here for the first time that this method can indeed be used for the simple quantification of [Ca2+]i in vivo.
two digital chemiluminometers as described above but with 421- and 477nm interference filters of 10-nm half-band width located in front of the photomultiplier tubes (Campbell et ai., 1983; Campbell, 1988). Calibration of recombinant e-aequorin was performed in 10 mM chelex N-tris[Hydroxymethyl]methyl-2-aminoethanesulphonic acid (TES), 150 mM spec pure KCI, 1 mM spec pure MgSO4 containing different concentrations of free Ca 2+ (Campbell and Dormer, 1975; Campbell et al., 1981). The signals from the two chemiluminometers were sent to a calibrated double-trace chart recorder, and ratios calculated from luminescence at 421 and 477 nm.
Imaging of Luminescence in Nicotiana Seedlings Whole 7-d-old transgenic Nicotiana seedlings were treated with coelenterazinc as described above and were then mounted and attached to glass coverslips using silicon grease. These seedlings were viewed with either a x4 or x l 0 plan-apo objective on an inverted Nikon Diaphot microscope. For luminescence imaging an extremely sensitive photon-counting camera (model C2400-20; Hamamatsu Photonics UK Limited, Enfield) was used. This consisted of a photocathode coupled to a specially designed intensifier tube with a two-stage microchannel plate. In this system, amplified photons strike a phosphor screen and are imaged by a Saticon tube camera (Hayakawa, 1991). Images were stored and processed using an Argus-50 image processor (Hamamatsu Photonics UK Limited). The discrimination was set at 100 (on a scale from 0 to 200) and resulted in virtually no light being imaged in unstimulated seedlings. Photons were collected in the 'slice' mode. Images shown in Figs. 1 and 2 represent photon-counts accumulated over 25 s. Once the luminescence images were captured they were processed and superimposed on a silhouette of the bright-field image. The Argus-50 image processor was driven by Hamamatsu software on a Compaq PC with an 80386 microprocessor. The cold-shock stimulus was applied by placing a small piece of ice next to the seedling and allowing it to melt. Contact of the tissue with the cold water resulted in the cold-shock response. For touch stimulation the cotyledon was gently lifted away from the coverslip and allowed to drop back on it. For the wounding response a single pin-prick from a very sharp needle was gently applied to the center of the seedling cotyledon.
Materials and Methods Genetic Transformation and Growth of Plants Nicotiana plumbaginifolia was genetically transformed with a ehimaeric gene in which the cauliflower mosaic virus 35S promoter was fused to the apoaequorin coding region as described previously (Knight et al., 1991). Seedlings homozygous for this gene were grown on half-strength M and S medium (Murashige and Skoog, 1962), 0.8% (wt/vol) bactoagar at 25°C, 16 h photoperiod for 7 d before reconstitution of aequorin.
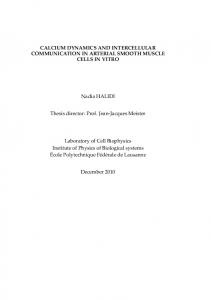
Results Imaging of Luminescence in Response to Cold-shock, Touch, and Wounding Fig. 1, A-C shows the imaging of [Ca~+]~-dependent lu-
To estimate the amount of aequorin reconstituted in vitro, 5 td of the reconstitution mixture was added to 500/xl of 200 mM Tris-HCl, 0.5 mM EDTA, pH 7.0, and the total luminescence measured upon the addition of 500 ttl 50 mM CaC12. The amount of aequorin reconstituted in vivo was estimated either by homogenizing single 7-d-old transgenic seedlings in 500/xl of 200 mM Tris-HC1, 0.5 mM EDTA, pH 7.0, and measuring the total luminescence in the same way as described above or by measuring the luminescence from whole Nicotiana seedlings in response to cold-shock (Knight et al., 1991). Chemiluminescence measurements were made using a digital chemiluminometer equipped with 9757AM EMI photomultiplier tube at 1 kV with a discriminator (Campbell et ai., 1985). The output was recorded by an eight-digit scaler. For luminescence measurements at different wavelengths, luminescence from samples was measured simultaneously with
minescence in response to cold-shock in the cotyledons, hypocotyls, and roots of Nicotiana seedlings, respectively. A dramatic increase in the level of [Ca2+]i-dependent luminescence was observed in the cotyledons (Fig. 1 A) and roots (Fig. 1 C), but very little was observed in the hypocotyls (Fig. 1, B and C). This is despite the fact that there is an equal amount of aequorin reconstituted in hypocotyls and cotyledons on a weight to weight basis (Knight et al., 1991). These data indicate a tissue-specific [Ca2+]~ response to cold-shock in Nicotiana seedlings. Previously we have shown that the Ca2+-channel blocker lanthanum (III) chloride inhibits the cold-shock response in Nicotiana seedlings treated with standard coelenterazine and to cold-shock (Knight et al., 1992). Imageable luminescence in similarly treated seedlings was also much reduced (data not shown). Very low levels of light are known to be emitted naturally from plant tissue as a result of chlorophyll luminescence (Breta, 1983) and ultraweak chemiluminescence (Abeles, 1987; Schauf et al., 1992). The background noise (mainly from non-aequorin luminescence and stray light) in unstimulated cotyledons varied between 2,700 and 4,700 photons counted over 25 s in the experiments presented here. Seedlings which were untreated with coelenterazine produced no imageable luminescence above background even upon stim-
The Journal of Cell Biology, Volume 121, 1993
84
Reconstitution of Aequorin In Vitro and In Vivo Aequorin was reconstituted in vivo by floating 7-d-old transgenic Nicotiana seedlings in water containing coelenterazine at 2/~M, and incubating them at room temperature in darkness for either 6 h or overnight. Seedlings treated with coelenterazine at this concentration in this way showed no signs of toxicity when compared with untreated seedlings (Knight et al., 1991). Aequorin was reconstituted in vitro from apoaequorin extracted either from Nicotiana or Aequorea victoria in a buffer containing 0.5 M NaC1, 5 mM /3-mercaptoethanol, 5 mM EDTA, 0.1% gelatin (wt/vol), 10 mM Tris-HCl, pH Z4, and 2.5 ttM coelenterazine in darkness.
Luminescence Measurements from Plant 1~ssue and Extracts
0s
r 90s
Os
41461 3 0 s
Z0683 6^-
376253 120s
108709 180s
~
3363
12600
4629
4408
Ba 4~ro9 30.
os
Ca
-
90s
28994 120s
s
J
66933 60s
~ ."t~~l e j I B '
97397
C
12224
180s
e
6614
F~'gure I. Imaging of the el~ fects of void-shock on ~he lCa2÷]i-dependcnt luminescence of (A) a cotyledon, (B) a hypocotyl, and (C) the root system of Nicotianu seedlings treated with standard ¢oelenterazine. Each image was captured at .'~3-sinter,,,zls (lime is given in t6p left corner of each image in seconds) and represents photons accumulated twer the previous 25 s. The total photon count for the previous 25 s is shown in the top right corner of each image (error = 5:10%). C, cotyledon; H, hypocotyl; and R, r~ts. Bars (A) 100 #m; (B and C) 250/an.
ulation (data not shown). The same result was obtained with seedlings trcaled with ip-coelenterazine (see Fig. 3 c) and coelenterazine 18 (see Fig, 3 d). This was attributed to the fact that not enough acquorin was reconstituted in vivo using these c~lelenterazines to report {CaZ+J, (see Fig. 4 b), In both the colyledons and roots the ICa-'*],-dependenl luminescence response was quite prolonged ("-,3 rain). In the case of the cotyledons a wave-like motion of [Ca:'l,dependenl luminescence across the cotyledon was observed (Fig. I A). In the case of the roots, however, no such wavelike motion was ~bserved. In roots the [Ca:'l,-dependent luminescence was concentrated in the main part of the root system (Fig. 1 C). Attempts to image [Ca'~],-dependent lu-
minescence in single root hair cells at higher magnification have not so Par been successful. Fig, 2, A and B shows the effect on the [Ca2÷]~-dependent luminescence of Nicotiana cotyledons of wounding and touch, respectively. These results were obtained by treating the seedlings with h-coelenterazine (Fig, 3 b) as the use of standard coelenterazine (Fig. 3 a) did not aIlow the detection of these responses due t(1 the lower sertsitivity of the resultant semi-synthetic aequorin. This suggests thai the magnitude of the [Ca2+], increases stimulated by both touch and wounding in the cotyledons are much smaller than those detected as a result of cold-shock. In the case of the wounding (Fig. 2 A) it is clear from the
Knigh~ eta]. lnulging Plant C.fcium Using Recombinant A¢,quorin
85
8551
"/043 ~
b (IP,~:
7046
4~n~
C
48251 1~n~
d Os
3823
3512
f 30s
14170 i 60s
b luminescence images obtained that the wounding signal is not confined to the region of the tissue immediately adjacent to the wounded cells. Indeed most of the responding cells are well away from the wound site, This seems to indicate that the wound signal is transmitted through the unwounded tissue which is then able to respond by an elevation in [Ca2+]~. This data does not discount the possibility that the primary wounding event involves an increase in [Ca2+], in the wounded cells themselves, as imaging was only possible to perform within 10 s after wounding. The wound-inducible response occurred in specific, discrete locations of the co W [edon. However these h~cations did not apparently correspond to specific morphological structures, e.g., wascular tissue in the cotyledon. In some cases cells around the periphery of the cotyledon, ",~300 ~m from the site of wounding, exhibited [Ca:']~ elevation indicating that thc putative wounding signal may have the capacity to travel quite far through plant tissue. Previous observations indicated that the touch-response involves a rapid [Ca~+]~ transient (Knight et al., 1991, 1992). As with wounding, imaging was not possible within 10 s of touch stimulation. Therefore the increases in [Ca-~l~ imaged here are most likely the more long-term effects of touch-stimulation. The time-scale of these responses yeas also more rapid than that of cold-shock (120 s fi~r wounding and 90 s for touch). The imageable luminescence shown in Figs. 1 and 2 most likely emanated from the topmost layers of cells as light
The Journal of Cell Biology, Volume 121, 1993
C
7O48
Figure 2. Imaging of the elZ fccts of (A) wounding and (B) touch on the [Ca2÷lcdepcn dent luminescence of cotyledons of Nicotiana seedlings treated with h-coelenterazine. The times and numbers of photons counted are as indicated in F~.g.I. W, hole in cotyledon produced by wounding with needle. Bar, 250 #m.
would not be expected to travel very far through the plant tissue. Marked heterogeneity in the responses of different cells within cotyledons subjected to cold-shock (Fig. 1 A), wounding (Fig. 2 A) and touch (Fig. 2 B) was observed: only certain individual cells or small groups of cells seemed to exhibit marked increases in |Ca-'÷J~
Reconstitution of Aequorin In Vitro and In Vivo using Different Chemical Analogues of Coelenterazine Fig, 4, a and b show the rates of reconstitution of aequorin from recombinant apoaequorin over 24 h using different coelenterazines (Fig. 3) in vitro and in vivo, respectively. All coelenterazines used, other than standard coelentcrazine, produced relatively unstable aequorins in vitro with a decay in the amount reconstituted over 24 h even in the CaZ+-free buffer used. Aequorin formed using standard coelenterazine (Fig. 3 a) was relatively stable with no significant reduction in the amount produced after I h. Although absolute amounts of aequorin reconstituted cannot be compared (due to the different quantum yields expected from the different coelenterazines), it seems that the stability of aequorin pro_ duced from h-coelenterazine (Fig. 3 b) is greater than that produced from ip-coelenterazine (Fig. 3 c) and both these aequorins are more stable than that produced from coelenterazine 18 (Fig. 3 d). When these rates were compared with the rates of reconstitution in vivo a marked difference was observed. In the cases of standard coelenterazine and h-coel-
lO00000Ie~=
b
a
•
a
•
5000001-~ ,..& w
t,/)
0
C
150001 10000
5000 ¢-
CI.I(CI~I,),
d
v
e
0 o o t(1) o t~
rE _1
Figure 3. Molecular structures of (a) standard coelenterazine, (b) h-coelenterazine, (c) ip-coelenterazine, (d) coelenterazine 18, and (e) e-coelenterazine.
.t
Oq--3- ~
Time (h) 300000 200000 100000 10000
,oootA.. O" :~ 6
enterazine the amount of aequorin reconstituted showed a steady increase over 24 h. In the case of ip-coelenterazine a transient increase was observed over the first 3 h followed by a slow decline (compare the situation in vitro where there was no increase at all and the rate of decline was more rapid). Also in the case of coelenterazine 18 a slight but detectable increase in reconstitution was observed over 24 h which was not detected in vitro.
Calibration of[Ca2÷], Increases in Response to Cold-shock: Use of e-Coelenterazine To examine whether the recombinant isoform of apoaequorin expressed in Nicotiana showed the altered spectral characteristics of luminescence when reconstituted with e-coelenterazine, as described for certain other isoforms (Shimomura et al., 1988), a discontinuous luminescence spectrum was measured for aequorins reconstituted from this isoform using both standard coelenterazine (Fig. 3 a) and e-coelenterazine (Fig. 3 e). Fig. 5, a and b shows the relative emissions of both these forms of recombinant aequorin at the wavelengths 421, 477, 486, 503, 546, and 586 nm. As can be seen from this data there seems to be a shift in the peak of luminescence towards the blue (lower wavelength). Another important feature of these spectra is the greatly increased 421:477 nm ratio of the recombinant e-aequorin with respect to the standard recombinant aequorin. In some of the other isoforms described in the literature an increase of the ratio 405:470 nm has been observed (Shimomura et al., 1988). In these isoforms the ratio 405:470 nm increases with increasing free Ca 2+ concentration and can therefore be used as a method of calibrating free Ca 2+ concentrations. To test the isoform expressed by Nicotiana we measured the 421: 477 nm ratio of both standard recombinant aequorin and recombinant e-aequorin (after reconstitution in vivo; Fig. 6 a) in the presence of increasing free Ca 2+ concentration. Fig. 6
Knight et al. Imaging Plant Calcium Using Recombinant Aequorin
9 12 15 18 2 f 2'4
9 12 15 18 21 2;-4
Time (h) Figure 4. Reconstitution time courses of aequorin in vitro (a) and in vivo (b) using standard coelenterazine (m), h-coelenterazine (A), ip-coelenterazine (o), coelenterazine 18 ( . ) , and methanol (v). (a) Nicotiana seedling tissue was homogenized in MO medium and aequorin reconstituted with coelenterazine added to 2.5 #M. Reconstitutions with each different coelenterazine was performed in triplicate. After 1, 2, 4, 6, and 22 h reconstituted aequorin was discharged by the addition of excess Ca2+ and the total amount of luminescence produced over 10 s measured. (b) Whole Nicotiana seedlings were floated on water containing 2.5/~M coelenterazine. After 1, 3, 6, and 24 h single seedlings were transferred to luminometer cuvettes and cold shocked as described previously (Knight et al., 1991). Each time point for each coelenterazine used is an average of five individual seedlings. In both a and b, controls consisted of identical conditions to experimental except that methanol was added to 1% instead of coelenterazine.
b shows a plot of this ratio against pCa. This data shows that although the 421:477 nm ratio did not change with increasing pCa for standard recombinant aequorin the ratio did increase proportionately with recombinant e-aequorin over the range tested (pCa = - 7 to - 4 ) . These characteristics make recombinant e-aequorin a good candidate for the calibration of [Ca2+]~ changes in vivo. To see whether recombinant e-aequorin could be reconstituted in vivo from e-coelenterazine, Nicotiana seedlings were incubated with e-coelenterazine as described above and the amount of recombinant e-aequorin formed was estimated after extraction (Fig. 6 c). This demonstrates that sufficient recombinant e-aequorin could be reconstituted in vivo to allow measurement of [Ca2+]i increase in response to cold-shock. When the coldshock-induced calcium-dependent luminescence was measured from Nicotiana seedlings treated with standard coelenterazine and e-coelenterazine the average 421:477 nm ratio
87
Figure 5. Discontinuous spectra of (a) normal recombinant aequorin and (b) recombinant e-aequorin. Recombinant apoo c 0.050 aequorin was extracted from Nicotiana and aliquots reo .-= 0.025 constituted with standard and e-coelenterazine as described for Fig. 4 a. Reconstituted ~ 0 b aequorin was discharged and ~-- 0.075 luminescence produced measured over 10 s as described ~, 0.050 for Fig. 4 a except that a dual photomultiplier tube lumi"5 0.025 nometer was used. One lu0 minometer measured total luminescence counts at the same o od I~- eO time as the other measured the amount of luminescence passWavelength (nrn) ing through different specific filters. Results are expressed as a ratio of the amount of light passing through the filters over the total amount of light emitted. These results have not been corrected for the spectral sensitivities of the two photomultiplier tubes used, nor their comparative efiiciencies, but this still allows comparison between the spectral differences of the luminescence of the two forms of recombinant aequorin.
== oo 0.075
+ &
was significantly different. In standard coelenterazine-treated plants this ratio was 0.57 + 0.031 (n = 5) and in e-coelenterazine-treated plants this ratio was 0.920 + 052 (n = 9). Using the calibration curve from Fig. 6 b this latter ratio represents an average [Ca2*]+ value of 1.8 #M occurring when Nicotiana seedlings are cold shocked.
a
Discussion Our data clearly show that sufficient light is emitted from reconstituted recombinant acquorin in vivo to image [Ca2+]~ within different plant tissues using a sensitive photoncounting camera. The level of light emitted in response to cold-shock was relatively high and although photons accumulated over 25 s periods were used for imaging, shorter integration times could have been used. The responses to both touch and wounding signals were smaller and integrations of 25 s were the minimum we could usefully use. The transformant line of Nicotiana plumbaginifolia used for this study was selected from 12 independent transformants and had the highest level of apoaequorin expression. However our estimates of this level of expression (Knight, M. R., A. K. Campbell, and A. J. Trewavas, unpublished) suggest that we could produce plants with a much higher level of expression so that the effects of wounding or touch could then profitably be examined at much shorter time intervals. The response of Nicotiana cotyledons to cold-shock as shown in Fig. 1 A involved increases in [Ca2÷]i in what appeared to be a wave-like movement across the tissue. In the case of the roots (Fig. 1 C), the [Ca2+]i increase occurred instantly and not gradually as in the cotyledons. The area seen to be the most responsive in this case is the main part of the root. With time the response declined but was still confined to this region of the root. The hypocotyl apparently released no light at all in response to cold-shock: a surprising observation since we have dissected these seedlings into cotyledons, hypocotyl and roots and shown that the hypocotyl contains about 20% of the total reconstituted ae-
b
C A
-25 20
8
15
8
10
~, =o
•
E
0.9 o.a
,~ o.7
5
o
--"_m o
•"~
'~15 'I"o -10
=E 1.41.3 ~ 12 ~t 1.1 "" 1.0
3
6
9
1215182124
5
~
1
0.6
0.5 a: 0.4 0
8
-
, -8
-7
-6
Time (h)
-5
pCa
-4
-3
0 --
1
3
17
Time (h)
Figure 6. (a) Time course of the in vitro reconstitution of aequorin (a), e-aequorin (A), recombinant aequorin (o), recombinant e-aequorin ( . ) , and no coelenterazine (v). Reconstitutions were performed in vitro as described for Fig. 4 a using apoaequorin extracted from Aequorea victoria (to produce aequorin and e-aequorin) and Nicotiana (to produce recombinant aequorin and recombinant e-aequorin). Luminescence measurements were also performed as described for Fig. 4 a. (b) Plot of pCa versus the ratio of luminescence emission at 421/477 nm of recombinant aequorin (m) and recombinant e-aequorin (o). Aliquots (5 #1) of recombinant aequorin and recombinant e-aequorin were added to 250 #1 of buffer (10 mM chelex TES, 150 mM spec pure KC1, 1 mM spec pure MgSO+) and an equal volume of CaCI2 to various concentrations in the same buffer added. Measurements of luminescence at 427 and 477 nm were made simultaneously using a dual-wavelength luminometer connected to a double-trace chart-recorder and ratios calculated. These relative ratios do not take into account the relative efficiencies or spectral sensitivities of the two photomultiplier tubes used. Estimation of [Ca2+]i in vivo used exactly the same luminometer configuration as for this calibration curve. (c) In vivo reconstitution of recombinant e-aequorin (Ea) compared with recombinant aequorin (a). Reconstitutions in vivo were carried out as described for Fig. 4 a. After reconstitution single seedlings were homogenized in 200 mM Tris-HCl, 0.5 mM EDTA, pH 7, and luminescence measured upon addition of an equal volume of 50 mM CaC12. For each time point three individual seedlings were homogenized and measured.
The Journal of Cell Biology, Volume 121, 1993
88
quorin in the seedling (Knight et al., 1991). This suggests that Nicotiana hypocotyls are relatively insensitive to coldshock. There are clearly two explanations for the wave-like [Ca2÷]i increases occurring in the cotyledons in response to cold-shock. The first is that this pattern represents the effect of ice-cold water from the melting ice passing progressively over the tissue initiating a cold-shock response progressively in the cells with which it comes into contact. In this way uneven rates of cooling could account for the uneven distribution and timing of the calcium-dependent light emission. The fact that we have never observed a similar wave in elevated [Ca2+]i within roots (Fig. 1 C) does not support this possibility. The second explanation is that the cold-shock signal is perceived at the tip of the cotyledon and a signal is transmitted through the tissue not in direct contact with the stimulus. The appearance of action potentials which move from the point of application of a drop of cold water was first described in 1938 (Houwink, 1938) and has surfaced in the literature at occasional intervals (Pickard, 1984). It has been shown that the rate of cooling may be important in the production of the action potential (Minorsky, 1985). What has always proved difficult to understand is how an action potential could induce the subsequent metabolic changes which accompany the events induced by cold. It has been suggested previously that chilling injury in plants results from a failure in [Ca2+]i homeostasis (Minorsky, 1985). This paper describes a direct demonstration that a rise in [Ca2+]i is one of these metabolic alterations. Many phenomena in plants such as cold acclimation, vernalisation and dormancy-breakage are dependent on long periods at low temperatures. The use of the recombinant aequorin technique described here suggests that the ubiquitous second messenger, Ca 2÷, may be involved. In this way [Ca2+]~elevation might be a primary step in a signal transduction pathway leading to these and other cold-induced metabolic alterations in plants. Attachment of aequorin to membrane proteins may provide a method of much greater sensitivity and enable the detection of much smaller changes in Ca 2÷ homeostasis than described here. Further work is now required to show whether or not the elevation in [Ca~+]i is the direct consequence of an action potential. Clearly an elevation in [Ca2+]i is not the only event which is induced by action potent!als in plants. Cold-induced action potentials affect membrane properties (Pyatygin et al., 1992) and wound-induced action potentials have effects on plant defense gene expression (Wildon et al., 1992). Whether these sorts of effects are mediated by a concomitant [Ca2+]i elevation or not remains to be resolved. Our data also suggest the transmission of signals in both wounding and touch. Both signals have also b u n associated in the past with the transmission of information from their point of impact (Bentrup, 1979; Farmer and Ryan, 1990, 1992; Ryan and Farmer, 1991). In the case presented here (Fig. 2 A) it is clear that upon wounding many ceils in areas remote from the cotyledon respond and increase their [Ca2+]~. However this effect is much reduced and selective when compared to cold-shock. In wheat leaves small impact points like these lead to lignlfication in areas remote from the wound (Barber et al., 1989). As [Ca2+]i elevations also occur in areas remote to the wound it might be possible that [Ca2+]~ is involved as a signal to mediate lignification. Fur-
Knight et al. Imaging Plant Calcium Using Recombinant Aequorin
ther work is required to determine whether there is any correlation between cells in which [Ca2+]i occurs as a response to wounding and cells in which lignification (Barber et al., 1989) and defense gene expression (Wildon et al., 1992) occurs. Perhaps the most interesting feature is that only some cells respond suggesting possibly different sensitivities of cells to the transmitted wounding signals may operate. Alternatively, we may be seeing the stimulation of certain cells along particular routes during the transmission of this wounding signal. The detection of wounds has been shown in a number of cases to involve movement of the signal from its point of impact (Bentrup, 1979; Ryan and Farmer, 1991). Our data provides a visual detection of that movement. We do not as yet know how homogeneously the apoaequorin is expressed in the cells of the Nicotiana seedlings nor if there is a difference in the availability of coelenterazine to different cell types. For this reason the numbers of photon counts measured over the 25-s integrations can only provide a rough guide to the relative responses between different tissues and responses. Future development of the technique described here whereby imaging could be combined with the use of e-aequorin which allows calibration of [Ca2+]~ changes irrespective of the distribution of the aequorin is one way in which this problem can be solved. When comparing the usefulness of different coelenterazinc analogues for the in vivo measurement of [Ca2+]i (Figs. 4 b and 6 c) it can be seen that under the conditions described here only standard coelenterazine, h-coelenterazine and e-coelenterazine reconstitute sufficient reporter aequorin to be of any benefit. The other two coelenterazines, ip-coelenterazine and coelenterazine 18 are limited due to their instability even under Ca2+-free conditions (Fig. 4 a). A brief rise in the level of reconstituted aequorin in vivo is detected after a few hours (Fig. 4 b) so to be of any use for [Ca2+]i measurement these coelenterazines would have to be used at very high concentrations with tissue only treated for a relatively short time. Fig. 5 shows that the apoaequorin isoform expressed in Nicotiana shows altered luminescence spectral characteristics as already described for other isoforms (Shimomura et al., 1988) when reconstituted to aequorin using e-coelenterazine. The graph in Fig. 6 b shows that the ratio of luminescence of recombinant e-aequorin at 421 and 477 nm increases with increasing free Ca ~÷ concentration. This graph can be used as a calibration curve to quantify changes in [Ca2÷]~by measuring this ratio upon stimulation of tissue. The advantage of this method is that it does not rely on knowledge of how much aequorin has been expressed, reconstituted, or consumed unlike calibration at a single wavelength used for standard aequorin (Blinks et al., 1978; Allen and Blinks, 1978). To demonstrate the feasibility of this method we chose to calibrate the cold-shock response as this is the response which shows the least variation between individual plants of all the responses we have studied to date. Using this method we have obtained an average value for the elevation of [Ca2+]~ in response to cold-shock of 1.8 #M. Clearly one of the goals for the future will be to be able to use the recombinant aequorin method to image [Ca2÷]i changes in single cells. The advantages of this approach are that responses of a single cell could be measured without the
89
Abeles, F. B. 1987. Plant chemi-luminescence-an overview. Physiol. Plant. 71:127-130. Allen, D. G., and J. R. Blinks. 1978. Calcium transients in aequorin-injected frog cardiac muscle. Nature (Lond.). 273:509-513. Barber, M, S., R. E. Bertram, and J. P. Ride. 1989. Chitin oligosaccharides elicit lignification in wounded wheat leaves. Physiol. Mol. Plant Pathol. 34:3-12. Bentrup, F. W. 1979. Reception and transduction of electrical and mechanical stimuli. In Encyclopedia of Plant Physiology New Series Vol. 7. W. Haupt and E. Feinleib, editors. Springer-Veflag, Berlin. 42-70. Blinks, J. R., P. H. Mattingly, B. R. Jewell, M. Van Leeuwen, G. C. Hatter, and D. G. Allen. 1978. Practical aspects of the use of aequorin as a calcium indicator: assay, preparation, microinjection, and interpretation of signals. Methods Enzymol. 57:292-328. Breton, J. 1983. The emission of chlorophyll in vivo-antenna fluorescence or ultrafast luminescence from the reaction centre pigments. FEBS (Fed. Fur. Biochem. Soc.) Lett. 159:1-5. Callaham, D. A., and P. K. Heplar. 1991. Measurement of free calcium in plant cells. In Cellular Calcium. A Practical Approach. J. G. McCormack and P. H. Cobbold, editors. IRL Press, Oxford, UK. 383-410. Campbell, A. K. 1983. Intracellular calcium-its universal role as regulator. Wiley, Chichester, UK. 556 pp. Campbell, A. K. 1988, Chemiluminescence. Principles and applications in biology and medicine. VCH, Weinheim, Germany. 608 pp. Campbell, A. K., and R. L. Dormer. 1975. The pormeability to calcium of pigeon erythrocyte 'ghosts' studied by using the calcium-activated luminescent protein, obelin. Biochem. J. 152:255-265. Campbell, A. K., and A. Patel. 1983. A homogenous immunoassay for cyclic nucleetides based on chemiluminescence energy transfer. Biochem. J. 216: 185-194. Campbell, A. K., R. A. Daw, M. B. Hallett, andJ. P. Luzio. 1981. Direct mea-
surement of the increase in intracellular free calcium ion concentration in response to the action of complement. Biochem. J. 194:551-560. Campbell, A. K., M. B. Hallett, and I. Weeks. 1985. Chemi-luminescence as an analytical tool in cell biology and medicine. Methods Biochem. Anal. 31:317--416. Cobbold, P. H. 1980. Cytoplasmic free calcium and amoeboid movement. Nature (Lond. ). 285:441--446. Cobbold, P. H., and T. J. Rink. 1987. Fluorescence and bioluminescence measurement of cytoplasmic free calcium. Biochem. J. 248:313-328. Eisen, A., and G. T. Reynolds. 1984. Calcium transients during early development in single starfish (Asterias forbesi) oocytes. J. Cell Biol. 99:18781882. Eisen, A., D. P. Kiehart, S. J. Wieland, and G. T. Reynolds. 1984. Temporal sequence and spatial-distribntion of early events of fertilization in single seaurchin eggs. J. Cell Biol. 99:1647-1654. Farmer, E. E., and C. A. Ryan. 1990. Interplant communications: airborn methyl jasmonate induces synthesis of proteinase inhibitors in plant leaves. Proc. Natl. Acad. Sci. USA. 87:7713-7716. Farmer, E. E., and C. A. Ryan. 1992. Octadecanoid precursors of jasmonic acid activate the synthesis of wound-inducible proteinase-inhibitors. Plant Cell. 4:129-134. Fluck, R. A., A. L. Miller, and L. F. Jaffe. 1991. Slow calcium waves accompany cytokinesis in medaka fish eggs. J. Cell Biol. 115:1259-1265. Gilkey, J. C., L. F. Jaffe, E. B. Ridgeway, and G. T. Reynolds. 1978. A free calcium wave traverses the activating egg of the medaka, Oryzias latipes. J. Cell Biol. 76:448--466. Hayakawa, T. 1991. Single photon imaging. In Image Analysis in Biology. D. P. Hader, editor. CRC Press, Boca Raton, FL. 75-86. Houwink, A. L. 1938. The conduction of excitation in Clematis zeylanica and in Mimosa pudica. Annales du Jardin Botanique de Buitenzorg. 48:1-16. Kendall, J. M., G. Sala-Newby, V. Ghalant, R. L. Dormer, A. K. Campbell. 1992. Engineering the Ca~+-activated photoprotein aequorin with reduced affinity for calcium. Biochem. Biophys. Res. Comm. 187:1091-1097. Knight, M. R., A. K. Campbell, S. M. Smith, and A. J. Trewavas. 1991. Transgenic plant aequorin reports the effects of touch and cold-shock and elicitors on cytoplasmic calcium. Nature (Lond.). 352:524-526. Knight, M. R., A. K. Campbell, and A. J. Trewaves. 1992. Wind-induced plant motion immediately increases cytosolic calcium. Proc. Natl. Acad. Sci. USA. 89:4967-4971. Llifias, R., M. Sugimori, and R. B. Silver. 1992. Microdomains of high calcium concentration in a presynaptic terminal. Science (Wash. DC). 256: 677-679. Minorsky, P. V. 1985. An heuristic hypothesis of chilling injury in plants-a role for calcium as the primary physiological transducer of injury. Plant Cell Environ. 8:75-94. Miyazaki, S.-I., N. Hashimoto, Y. Yoshimoto, T. Kishimoto, Y. Igusa, and Y. Hiramoto. 1986. Temporal and spatial dynamics of the periodic increase in intracellular free calcium of golden hamster eggs. Dev. Biol. 118:259267. Murashige, T., and F. Skoog. 1962. A revised medium for rapid growth and bioassays with tobacco tissue cultures. Physiol. Plant. 15:473-497. Pickard, B. G. 1984. Voltage transients elicited by brief chilling. Plant Cell Environ. 7:679-681. Pyatygin, S. S., V. A. Opritov, and V. A. Khudyakov. 1992. Subthreshold changes in excitable-membranes of Cucurbita pepo L. stem-cells during cooling-induced action-potential generation. Planta (Heidelb). 186:161165. Ridgeway, E. B., J. C. Gilkey, and L. F. Jaffe. 1977. Free calcium increases explosively in activating meduka eggs. Proc. Natl. Acad. Sci. USA. 74: 623-627. Rose, B., and W. R. Loewenstein. 1975. Permeability of cell junction depends on local cytoplasmic activity. Nature (Lond.). 254:250-252. Ryan, C. A., and E. E. Farmer. 1991. Oligosaccharide signals in plants-a current assessment. Anau. Rev. Plant. Phys. Mol. Biol. 42:651-674. Schauf, B., L. M. Repas, and R, Kaufman. 1992. Localization of ultraweak photo-emission in plants. Photochem. PhotobioL 55:287-291. Shimomura, O. 1991. Preparation and handling of aequorin solutions for the measurement of cellular Ca ~+. Cell Calcium. 12:635-643. Shimomura, O., B. Musicki, and Y. Kishi. 1988. Semi-synthetic aequorin as a tool for the measurement of calcium-ion concentration. Biochem. J. 251:405-4 10. Shimomura, O., B. Musicki, and Y. Kishi. 1989. Semi-synthetic aequorins with improved sensitivity to Ca2÷ inns. Biochem. J. 261:913-920. Shimomura, O., S. Inouye, B. Musicki, and Y. Kishi. 1990. Recombinant aequorin and recombinant semi-synthetic aequorins-cellular Ca2÷ ion indicators. Biochem. J. 270:309-312. Wildon, D. C., J. F. Thain, P. E. H. Minchin, I. R. Gubb, A. J. Reilly, Y. D. Skipper, H. M. Doberty, P. J. O'Dormell, and D. J. Bowles. 1992. Electrical signalling and systemic proteinase-inhibitor induction in the wounded plant. Nature (Lond,). 360:62-65. Williamson, R. E., and C. C. Ashley. 1982. Free Ca2÷ and cytoplasmic streaming in the alga Chara. Nature (Lond.). 296:647-651.
The Journal of Cell Biology, Volume 121, 1993
90
need of disruptive microinjection and also in the context of its location in a tissue system. It is possible that this approach would alleviate the cell size constraints described for conventional aequorin imaging (Cobbold and Rink, 1987). The one single-ceU system we looked at, root hair cells, failed to provide conclusive evidence of single-ceU luminescence imaging and we do not yet know whether the "hot spots" of luminescence observed in Figs. 1 and 2 represent single cells, although it is possible. To improve chances of successful single-ceU luminescence imaging the expression of apoaequorin needs to be maximized. As we have not yet optimized expression of apoaequorin in Nicotiana, single-cell luminescence imaging in Nicotiana remains an exciting possibility for the future. This paper demonstrates some of the ways in which the recombinant aequorin method for [Ca2+]i measurement can be "fine tuned" for special applications (i.e., imaging, measurement of relatively small [Ca2÷]i changes, and calibration of [Ca2+]i changes by the use of different coelenterazine analogues). It has allowed aequorin luminescence imaging in plants for the first time, but the scope of the technique extends to all genetically transformable cells. Clearly this approach can be extended to encompass the many other coelenterazine analogues already synthesized (Shimomura et al., 1988, 1989). Another way forward to achieve similar goals is the engineering of the apoaequorin itself to modify the properties of aequorin (Kendall et al., 1992). It seems that this approach is likely to yield even more dramatic and useful variations of aequorin. We thank the Science and Engineering Research Council for financial assistance and Colin Wright of Hamamatsu Photonics UK Limited, Enfleld for the loan of Hamarnatsu imaging equipment. Received for publication 27 October 1992 and in revised form 16 December 1992. References