CME MOVEMENT DISORDERS
Clinical Medicine 2016 Vol 16, No 4: 371–5
Imaging in Parkinson’s disease
ABSTRACT
Authors: Gennaro Pagano, A Flavia NiccoliniB and Marios PolitisC
The clinical presentation of Parkinson’s disease (PD) is heterogeneous and overlaps with other conditions, including the parkinsonian variant of multiple system atrophy (MSA-P), progressive supranuclear palsy (PSP) and essential tremor. Imaging of the brain in patients with parkinsonism has the ability to increase the accuracy of differential diagnosis. Magnetic resonance imaging (MRI), single photon emission computed tomography (SPECT) and positron emission tomography (PET) allow brain imaging of structural, functional and molecular changes in vivo in patients with PD. Structural MRI is useful to differentiate PD from secondary and atypical forms of parkinsonism. 123 I-ioflupane (DaTSCANTM) SPECT is a valid tool in the differential diagnosis between PD and non-degenerative tremors, while cardiac 123I-metaiodobenzylguanidine SPECT and 18F-fluorodeoxyglucose PET are valid in the differential diagnosis between PD and atypical parkinsonism (MSA-P, PSP). However, despite significant evidence for the utility of neuroimaging in assessing parkinsonian patients, none of the neuroimaging techniques are specifically recommended for routine use in clinical practice. Hopefully, future larger trials will help to demonstrate additional evidence for the clinical utility of neuroimaging and will include an analysis of the financial benefits for the NHS in the longer term management of the patients.
Introduction Since the 1970s, neuroimaging studies, including structural, functional and molecular imaging of the brain with the use of magnetic resonance imaging (MRI), single photon emission computed tomography (SPECT) and positron emission tomography (PET), have aimed to assess the clinical utility of neuroimaging in patients with Parkinson’s disease (PD).1 One of the scopes of neuroimaging studies is to identify mechanisms underlying clinical presentation of PD and their link with neuropathological changes.
Authors: Aclinical research fellow in neurology, Neurodegeneration Imaging Group, King’s College London, London, UK; Bsenior clinical research fellow in neurology, Neurodegeneration Imaging Group, King’s College London, London, UK; Cclinical senior lecturer and consultant neurologist, Neurodegeneration Imaging Group, King’s College London, London, UK © Royal College of Physicians 2016. All rights reserved.
CMJv16n4-CME_Pagano.indd 371
Abnormal intra-neuronal (Lewy bodies) and intra-neuritic (Lewy neurites) deposits of fibrillary aggregates are currently considered the key neuropathological alterations in PD. The majority of these aggregates, mainly composed of alpha (α)−synuclein, are located at presynaptic level and impair axonal trafficking, resulting in a series of noxious events that cause neuronal damage to the substantia nigra pars compacta with a subsequent dopaminergic denervation of the striatum. The cardinal motor features of PD (bradykinesia and rigidity, with or without resting tremor) manifest after a substantial denervation of substantia nigra, which is associated with about 60–80% loss of dopamine terminals in the striatum. The clinical presentation of PD includes a number of nonmotor symptoms such as hyposmia, constipation, depression and sleep problems, among others.2 Non-motor symptoms have been associated with the damage induced by α-synuclein aggregates in non-dopaminergic pathways, and PET molecular imaging has linked, for example, the development of depression3 and weight changes4 with deficits in the serotonergic system in patients with PD.
Key points No neuroimaging technique is specifically recommended for routine use in clinical practice for Parkinson’s disease (PD). 123
I-FP-CIT (DaTSCANTM) SPECT can be used in the differential diagnosis between PD and non-degenerative forms of parkinsonism. Brain MRI, cardiac 123I-mIBG SPECT and 18F-FDG PET have the potential to differentiate PD from atypical parkinsonism. PET imaging provides the means to discriminate and reveal sub-phenotypes of PD and associations with non-dopaminergic deficits. Further larger neuroimaging trials, including NHS-related financial analyses, are needed to evaluate the longer term benefits of these techniques in the management of patients with PD. KEYWORDS: Imaging, Parkinson’s, MRI, PET, SPECT, DaTSCAN™, mIBG, FDG ■
371
30/06/16 6:55 PM
CME Movement disorders
The clinical presentation of PD, therefore, could be heterogeneous because of underlying dopaminergic and nondopaminergic pathophysiology and overlap with other types of parkinsonism, including the parkinsonian variant of multiple system atrophy (MSA-P), progressive supranuclear palsy (PSP), and essential tremor (ET). Neuroimaging modalities have the ability to increase the accuracy of differential diagnosis.1 Brain MRI uses different sequences and contrasts to study brain structure and function while SPECT and PET imaging use ionising radioactive ligands to quantitatively measure receptors, transporters or enzymes at nanomolecular level with high specificity and power of resolution. This review discusses the role of neuroimaging in PD clinical practice (Box 1).
Structural and functional imaging Traditional structural imaging modalities, such as X-ray computed tomography and brain MRI using anatomical T1 or T2-weighted sequences, are limited to use for identifying the dopaminergic deficits in the brain of patients with PD. However, MRI can be useful in the identification of structural lesions associated with other forms of parkinsonism, such as those underlined by vascular pathology or neoplasms. Structural MRI can also be useful for measuring the degree and distribution of brain atrophy. With regards to differential diagnosis, it has been shown that abnormal T2 MRI hypointensities in the putamen discriminate MSA-P from PD with 88% sensitivity and 89% specificity.5 Decreased putaminal signal intensities were higher using T2*-weighted gradient echo than T2-weighted fast-spin echo sequences and more useful in differentiating PD from MSA-P.6 Atrophy of the superior cerebellar peduncles7 and the frontal cortex8 also aid in discriminating PSP from PD with 74/94% and 95/91% specificity/sensitivity, respectively (Table 1).
Box 1. Use of neuroimaging in Parkinson’s disease clinical practice. In clinical practice, no neuroimaging modalities are currently recommended for routine use.
Table 1. Diagnostic accuracy of MRI modalities. Technique
Participants Sensitivity (n) (%)
Specificity (%)
Abnormal putaminal T2 hypointensity
MSA-P (24) vs PD (27)
87.5
88.89
Proton density MSA-P (24) putaminal hyperintensity vs PD (27)
83.3
100
T1 MRI: midbrain superior profile
PSP (25) vs PD (27)
68
88.8
T1 MRI: midbrain atrophy
PSP (25) vs PD (27)
68
77.7
T2 MRI: tegmental hyperintensity
PSP (25) vs PD (27)
28
100
Putaminal T2 hypointensity T2 hyperintensity combined
MSA (28) vs PD (32) PSP (30) CBD (26)
32 32 32
100 93 85
Overall MRI abnormalities
PD (32) vs MSA (28) PSP (30) CBD (26)
71 70 92
91 91 91
T1 MRI: voxel-based morphometry of cerebral peduncles and midbrain
PSP (12) versus PD (12)
83
79
Diffusion-weighted MRI MSA-P (10) Putaminal rADC vs PD (11)
100
100
Putaminal hyperintense rim
MSA-P (10) vs PD (11)
80
91
Putaminal atrophy
MSA-P (10) vs PD (11)
60
100
CBD = corticobasalganglionic degeneration; MRI = magnetic resonance imaging; MSA-P = multiple system atrophy parkinsonian type; PD = Parkinson’s disease; PSP = progressive supranuclear palsy; rADC = regional apparent diffusion coefficient.
Structural MRI Brain MRI is helpful to detect cerebrovascular damages and to quantify brain atrophy in patients with parkinsonism. MRI is needed to identify the presence of a structural lesion (or lesions) that may cause or contribute to parkinsonism, gait disorder and tremor and should be considered in differential diagnosis between PD and other types of parkinsonism. SPECT DaTSCANTM SPECT should be considered in differential diagnosis between degenerative and nondegenerative parkinsonism in patients with tremor (Box 2). Cardiac 123I-mIBG SPECT and 18 F-FDG PET scanning should be considered in differential diagnosis between PD and atypical forms of degenerative parkinsonism (MSA-P, PSP). 123 I-mIBG = 123I-metaiodobenzylguanindine; 18F-FDG = 18F-fludeoxyglucose; DaTSCANTM = 123I-ioflupane; MRI = magnetic resonance imaging; MSA-P = multiple system atrophy parkinsonian type; PD = Parkinson’s disease; PET = positron emission tomography; PSP = progressive supranuclear palsy; SPECT = single-photon emission computed tomography.
372
CMJv16n4-CME_Pagano.indd 372
Advanced MRI modalities, such as diffusion-weighted imaging (DWI), spectroscopy, arterial spin labelling (ASL) and resting-state functional MRI, are showing promise for detecting and discriminating PD cases from other forms of parkinsonism.9 DWI is based on effects of diffusion of water molecules in MRI images and allows imaging of white matter axonal tracts, including the large-scale structural connections of the brain. Using single tensor DWI modelling, a study showed that patients with PSP and MSA-P were differentiated from those with PD with 90–100% sensitivity and specificity.9 However, this technique does not allow the separation of water in brain tissue from water in extracellular space. A novel bitensor diffusion analysis model was implemented in 2016 and used to discriminate PD from PSP and MSA-P.10 They found that all forms of parkinsonism had elevated free-water in the substantia nigra, but only PSP and MSA-P showed a broad network of elevated free-water in the basal ganglia, thalamus, and cerebellum. Spectroscopy allows direct imaging of a wide range of endogenous compounds, such as dopamine, GABA, © Royal College of Physicians 2016. All rights reserved.
30/06/16 6:55 PM
CME Movement disorders
glutamate, N-acetylaspartate and glutathione. A proton density hyperintensity was found uniquely in patients with MSA-P and was able to differentiate MSA-P from advanced PD patients with 83% sensitivity and 100% specificity.5 However, these results were not replicated in a cohort of early PD patients,11 thus this warrants futher study. ASL is a MRI-based technique that allows imaging of cerebral blood flow and can be used to quantify brain perfusion as index of neurovascular status. Using ASL, posterior cerebral hypoperfusion was found in patients with PD and correlated positively with Montreal cognitive assessment scores. These findings provide evidence of alterations in neurovascular status in PD.12 Functional MRI measures blood oxygenation-level dependent (BOLD) signal, which is sensitive to localised changes in levels of blood oxygenation in brain regions that are activated. Functional connectivity can be assessed during tasks or in the resting state. Resting-state functional connectivity is considered an intrinsic functional connectivity network and is characterised by a regional homogeneity in a cluster of voxels and by the amplitude of low frequency fluctuations (ALFF) or fractional ALFF. Using this sequence, a PD-related pattern has been identified as reduction of ALFF in striatum, supplementary motor area, middle frontal gyrus and occipital cortex, and increase of ALFF in thalamus, cerebellum, precuneus, superior parietal lobule, and temporal cortex.13 With a 91%/89% sensitivity/ specificity, this ALFF-PD-related pattern could be potentially useful for differentiating PD patients from healthy controls at an individual patient’s level.
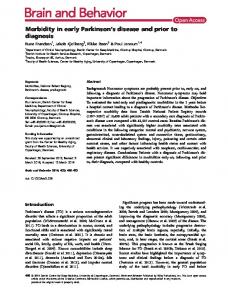
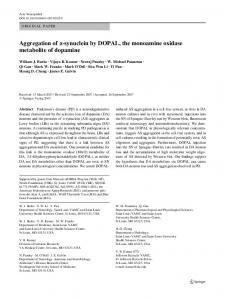
Molecular imaging Imaging with PET or SPECT are powerful methods to detect in vivo changes in the brain at molecular level. In patients with PD, PET and SPECT imaging of presynaptic dopaminergic function have shown marked reductions in vesicular monoamine transporter type 2 (VMAT2), dopamine transporter (DAT) and L-aromatic amino acid decarboxylase (L-AAAD) (Fig 1).1 Signal loss is commonly
Table 2. Diagnostic accuracy of SPECT imaging: differentiation of tremulous disorders. Test
Population
Sensitivity Specificity (%) (%)
DaTSCANTM 14
158 PD vs 27 ET
97
DaTSCANTM 15
38 PD vs 38 Non-PD 87
-
100
123
16
29 PD vs 32 ET
96.7
-
123
17
35 patients
90
100
I-β-CIT SPECT I-β-CIT SPECT
I-β-CIT = 123I-2beta-carbomethoxy-3beta-(4-iodophenyl) tropane; PD = parkinsonian syndrome; ET = essential tremor; SPECT = single-photon emission computed tomography; DaTSCANTM = 123I-Ioflupane; 123
asymmetric and profound in the posterior putamen, contralateral to the most clinically affected side. Although several PET and SPECT molecular imaging techniques have shown evidence of accuracy for aiding differential diagnosis in PD, only 123I-iof lupane (123I-FP-CIT; DaTSCAN TM) SPECT is licensed for clinical use in the UK. All DaTSCAN TM studies have demonstrated high sensitivity (87–98%) and specificity (80–100%) in the differentiation of PD from non-degenerative forms of parkinsonism, such as essential tremor, vascular and drug-induced parkinsonism (Table 2 , Box 2).14–17 However, DaTSCAN TM uptake is often reduced in MSA and PSP and cannot be used to differentiate PD from atypical forms of degenerative parkinsonism with high accuracy. This differentiation may be facilitated by the use of PET with postsynaptic dopaminergic ligands, but these are generally expensive and are available only in specialised centres. Another pathognomonic characteristic of PD is the impairment of the sympathetic nervous system. A reduced uptake of cardiac 123I-metaiodobenzylguanidine (123I-mIBG) SPECT has been demonstrated in patients with PD but not in MSA and PSP patients.18 Thus, cardiac 123I-mIBG could have an application in aiding the differential diagnosis between PD and atypical degenerative forms of parkinsonism.
Fig 1. Molecular imaging of dopaminergic dysfunction in Parkinson’s disease. PET and SPECT imaging in a PD patient show reduction of VMAT2 activity, DAT availability, and DDC activity compared with a healthy control. DAT = dopamine transporter; DDC = dopa decarboxylase; PD = Parkinson’s disease; PET = positron emission tomography; SPECT = single-photon emission computed tomography; VMAT2 = type 2 vesicular monoamine transporter. Reproduced with permission from Politis M (2014).1
© Royal College of Physicians 2016. All rights reserved.
CMJv16n4-CME_Pagano.indd 373
373
30/06/16 6:55 PM
CME Movement disorders
Box 2. Differential diagnosis of idiopathic Parkinson’s disease Degenerative disorders > Multiple system atrophy parkinsonian type > Progressive supranuclear palsy > Corticobasal degeneration > Dementia with Lewy bodies. Nondegenerative disorders > Essential tremor > Dystonic tremor > Vascular parkinsonism > Drug-induced parkinsonism > Tremor related to metabolic (eg hyperthyroidism) or functional causes.
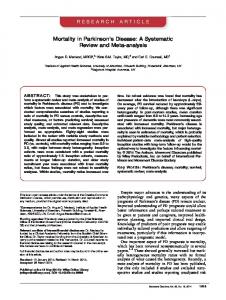
Using PET imaging with 18F-fludeoxyglucose (18F-FDG), patterns of regional brain metabolism can be measured using a map of regional abnormalities of known diseasespecific templates obtained in established patient cohorts. A quantification of disease-related spatial covariance patterns has been performed in PD, MSA and PSP.19 The PD-related pattern was characterised by increased activity in basal ganglia, pons and cerebellum with concurrent reductions of glucose metabolism in premotor, pre-supplementary motor and posterior parietal cortices; the MSA-related pattern by decreased metabolism in the putamen and cerebellum; and the PSP-related pattern by metabolic decreases in the brainstem and medial frontal cortex. These metabolic patterns can be used to differentiate PD from atypical degenerative forms parkinsonism (Fig 2).19 PET imaging with 18 kDa translocator protein (TSPO) ligands, such as 11C-PK11195 or 11C-PBR28, are used to quantify in vivo activated microglia. An increased binding of 11 C-PK11195 was described in the pons, basal nuclei, frontal and temporal cortical areas, and in the midbrain.20 Increased midbrain 11C-PK11195 binding was correlated with DAT
reduction in the putamen and with greater severity of motor symptoms according to the Unified Parkinson's Disease Rating Scale.20 These findings support the hypothesis that neuroinflammation may drive neurodegenerative processes in PD. Considering that mechanisms underlying neurodegeneration and loss of dopaminergic signalling in PD are still unclear, recent studies have focused on novel potential targets. Among them, our group has studied phosphodiesterase 10A (PDE10A) using 11C-IMA107 in PD.21 PDE10A regulates cAMP and cGMP signalling cascades in the basal ganglia, thus it might have a key role in the regulation of dopaminergic transmission, and in neuronal survival. PDE10A in caudate, putamen and globus pallidus was lower in PD patients compared with healthy controls, and correlated with longer disease duration, worse motor scores and higher severity of dyskinesia (Fig 2).21 These findings support the hypothesis that PDE10A could be targeted with novel pharmacotherapy, and this may improve dopaminergic signalling and striatal output, and therefore alleviate symptoms and complications of PD. In advanced PD, PET studies have been used to identify the mechanisms underlying motor complications, such as dyskinesias. Our group has demonstrated in vivo that maladaptive serotonergic mechanisms are responsible for dysregulated striatal dopamine levels in patients with PD who regularly experienced levodopa-induced dyskinesias.22
Conclusions Despite significant evidence for the utility of neuroimaging in assessing parkinsonian patients, none of the currently available neuroimaging techniques are specifically recommended for routine use in clinical practice of PD. Future larger trials, including NHS-related financial analyses, are need to demonstrate the clinical utility of neuroimaging in the longer term management of patients with PD. ■
Conflicts of interest All authors have no conflicts of interest.
Fig 2. Molecular imaging of glucose metabolism and PDE10A expression in Parkinson’s disease. PET imaging shows decreased glucose metabolism and PDE10A expression in a patient with PD compared with a healthy control. PD = Parkinson’s disease; PDE10A = phosphodiesterase 10 A; PET = positron emission tomography. Reproduced with permission from Politis M (2014).1
374
CMJv16n4-CME_Pagano.indd 374
© Royal College of Physicians 2016. All rights reserved.
30/06/16 6:55 PM
CME Movement disorders
References 1 2
3
4
5
6
7
8
9
10 11
12
13
Politis M. Neuroimaging in Parkinson disease: from research setting to clinical practice. Nat Rev Neurol 2014;10:708–22. Politis M, Wu K, Molloy S, G Bain P, Chaudhuri KR, Piccini P. Parkinson’s disease symptoms: the patient’s perspective. Mov Disord 2010;25:1646–51. Politis M, Wu K, Loane C et al. Depressive symptoms in PD correlate with higher 5-HTT binding in raphe and limbic structures. Neurology 2010;75:1920–7. Politis M, Loane C, Wu K, Brooks DJ, Piccini P. Serotonergic mediated body mass index changes in Parkinson's disease. Neurobiol Dis 2011;43:609–15. Righini A, Antonini A, Ferrarini M et al. Thin section MR study of the basal ganglia in the differential diagnosis between striatonigral degeneration and Parkinson disease. J Comput Assist Tomogr 2002;26:266–71. Kraft E, Trenkwalder C, Auer DP. T2*-weighted MRI differentiates multiple system atrophy from Parkinson’s disease. Neurology 2002;59:1265–7. Paviour DC, Price SL, Stevens JM, Lees AJ, Fox NC. Quantitative MRI measurement of superior cerebellar peduncle in progressive supranuclear palsy. Neurology 2005;64:675–9. Cordato NJ, Pantelis C, Halliday GM et al. Frontal atrophy correlates with behavioural changes in progressive supranuclear palsy. Brain 2002;125:789–800. Schocke MF, Seppi K, Esterhammer R et al. Diffusion-weighted MRI differentiates the Parkinson variant of multiple system atrophy from PD. Neurology 2002;58:575–80. Planetta PJ, Ofori E, Pasternak O et al. Free-water imaging in Parkinson’s disease and atypical parkinsonism. Brain 2016;139:495–508. Weiduschat N, Mao X, Beal MF et al. Usefulness of proton and phosphorus MR spectroscopic imaging for early diagnosis of Parkinson’s disease. J Neuroimaging 2015;25:105–10. Al-Bachari S, Parkes LM, Vidyasagar R et al. Arterial spin labelling reveals prolonged arterial arrival time in idiopathic Parkinson’s disease. Neuroimage Clin 2014;6:1–8. Wu T, Ma Y, Zheng Z et al. Parkinson’s disease-related spatial covariance pattern identified with resting-state functional MRI. J Cereb Blood Flow Metab 2015;35:1764–70.
© Royal College of Physicians 2016. All rights reserved.
CMJv16n4-CME_Pagano.indd 375
14 Benamer TS, Patterson J, Grosset DG et al. Accurate differentiation of parkinsonism and essential tremor using visual assessment of [123I]-FP-CIT SPECT imaging: the [123I]-FP-CIT study group. Mov Disord 2000;15:503–10. 15 Benamer HT, Oertel WH, Patterson J et al. Prospective study of presynaptic dopaminergic imaging in patients with mild parkinsonism and tremor disorders: part 1. Baseline and 3-month observations. Mov Disord 2003;18:977–84. 16 Asenbaum S, Pirker W, Angelberger P et al. [123I]beta-CIT and SPECT in essential tremor and Parkinson’s disease. J Neural Transm (Vienna) 1998;105:1213–28. 17 Jennings DL, Seibyl JP, Oakes D et al. (123I) beta-CIT and singlephoton emission computed tomographic imaging vs clinical evaluation in Parkinsonian syndrome: unmasking an early diagnosis. Arch Neurol 2004;61:1224–9. 18 Orimo S, Suzuki M, Inaba A, Mizusawa H. 123I-MIBG myocardial scintigraphy for differentiating Parkinson’s disease from other neurodegenerative parkinsonism: a systematic review and metaanalysis. Parkinsonism Relat Disord 2012;18:494–500. 19 Tang CC, Poston KL, Eckert T et al. Differential diagnosis of parkinsonism: a metabolic imaging study using pattern analysis. Lancet Neurol 2010;9:149–58. 20 Gerhard A, Pavese N, Hotton G et al. In vivo imaging of microglial activation with [11C](R)-PK11195 PET in idiopathic Parkinson’s disease. Neurobiol Dis 2006;21:404–12. 21 Niccolini F, Foltynie T, Reis Marques T et al. Loss of phosphodiesterase 10A expression is associated with progression and severity in Parkinson’s disease. Brain 2015;138:3003–15. 22 Politis M, Wu K, Loane C et al. Serotonergic mechanisms responsible for levodopa-induced dyskinesias in Parkinson’s disease patients. J Clin Invest 2014;124:1340–9.
Address for correspondence: Dr M Politis, Neurodegeneration Imaging Group, Maurice Wohl Clinical Neuroscience Institute, Institute of Psychiatry, Psychology & Neuroscience (IoPPN), 125 Coldharbour Lane, Camberwell, London SE5 9NU, UK. Email:
[email protected]
375
30/06/16 6:55 PM